Alert Webhook
Overview
To forward Grafana alerts to CloudOps, configure your Grafana instance so that fired alerts are routed to a Webhook contact point pointing at the CloudOps webhook endpoint.
This guide is written for Grafana Unified Alerting (Grafana 8.0+ standard). For legacy alerting, refer to the Grafana documentation .
Supported payload formats — this plugin targets Grafana Unified Alerting’s Webhook Payload Version 1 (Grafana 9.0+).
- Standard — Grafana 9.0+ Unified Alerting (Webhook Payload Version 1)
- Legacy — Grafana 7.x–8.x Dashboard Alerting (removed in Grafana 11; legacy compatibility)
- AWS SNS — via the SNS Notification wrapper
You will need:
- CloudOps webhook URL — the endpoint that CloudOps issues when you register a Grafana Alerting webhook source. Obtain it first by following Integrate Grafana to CloudOps. The URL has the form
https://<external-host>/integration-hub/webhooks/<webhook-id>/<token>/webhook-ingest. - Grafana editor (or admin) role on the organization where you will register the contact point and the notification policy.
The setup follows this order:
- Add a Contact Point
- Route alerts to the Contact Point
- Test the integration
1. Add a Contact Point
A Contact Point defines where Grafana sends an alert. For CloudOps, the contact point uses the Webhook integration.
Open Contact Points
In the Grafana side navigation, go to [Alerting > Contact points].
Add a new Contact Point
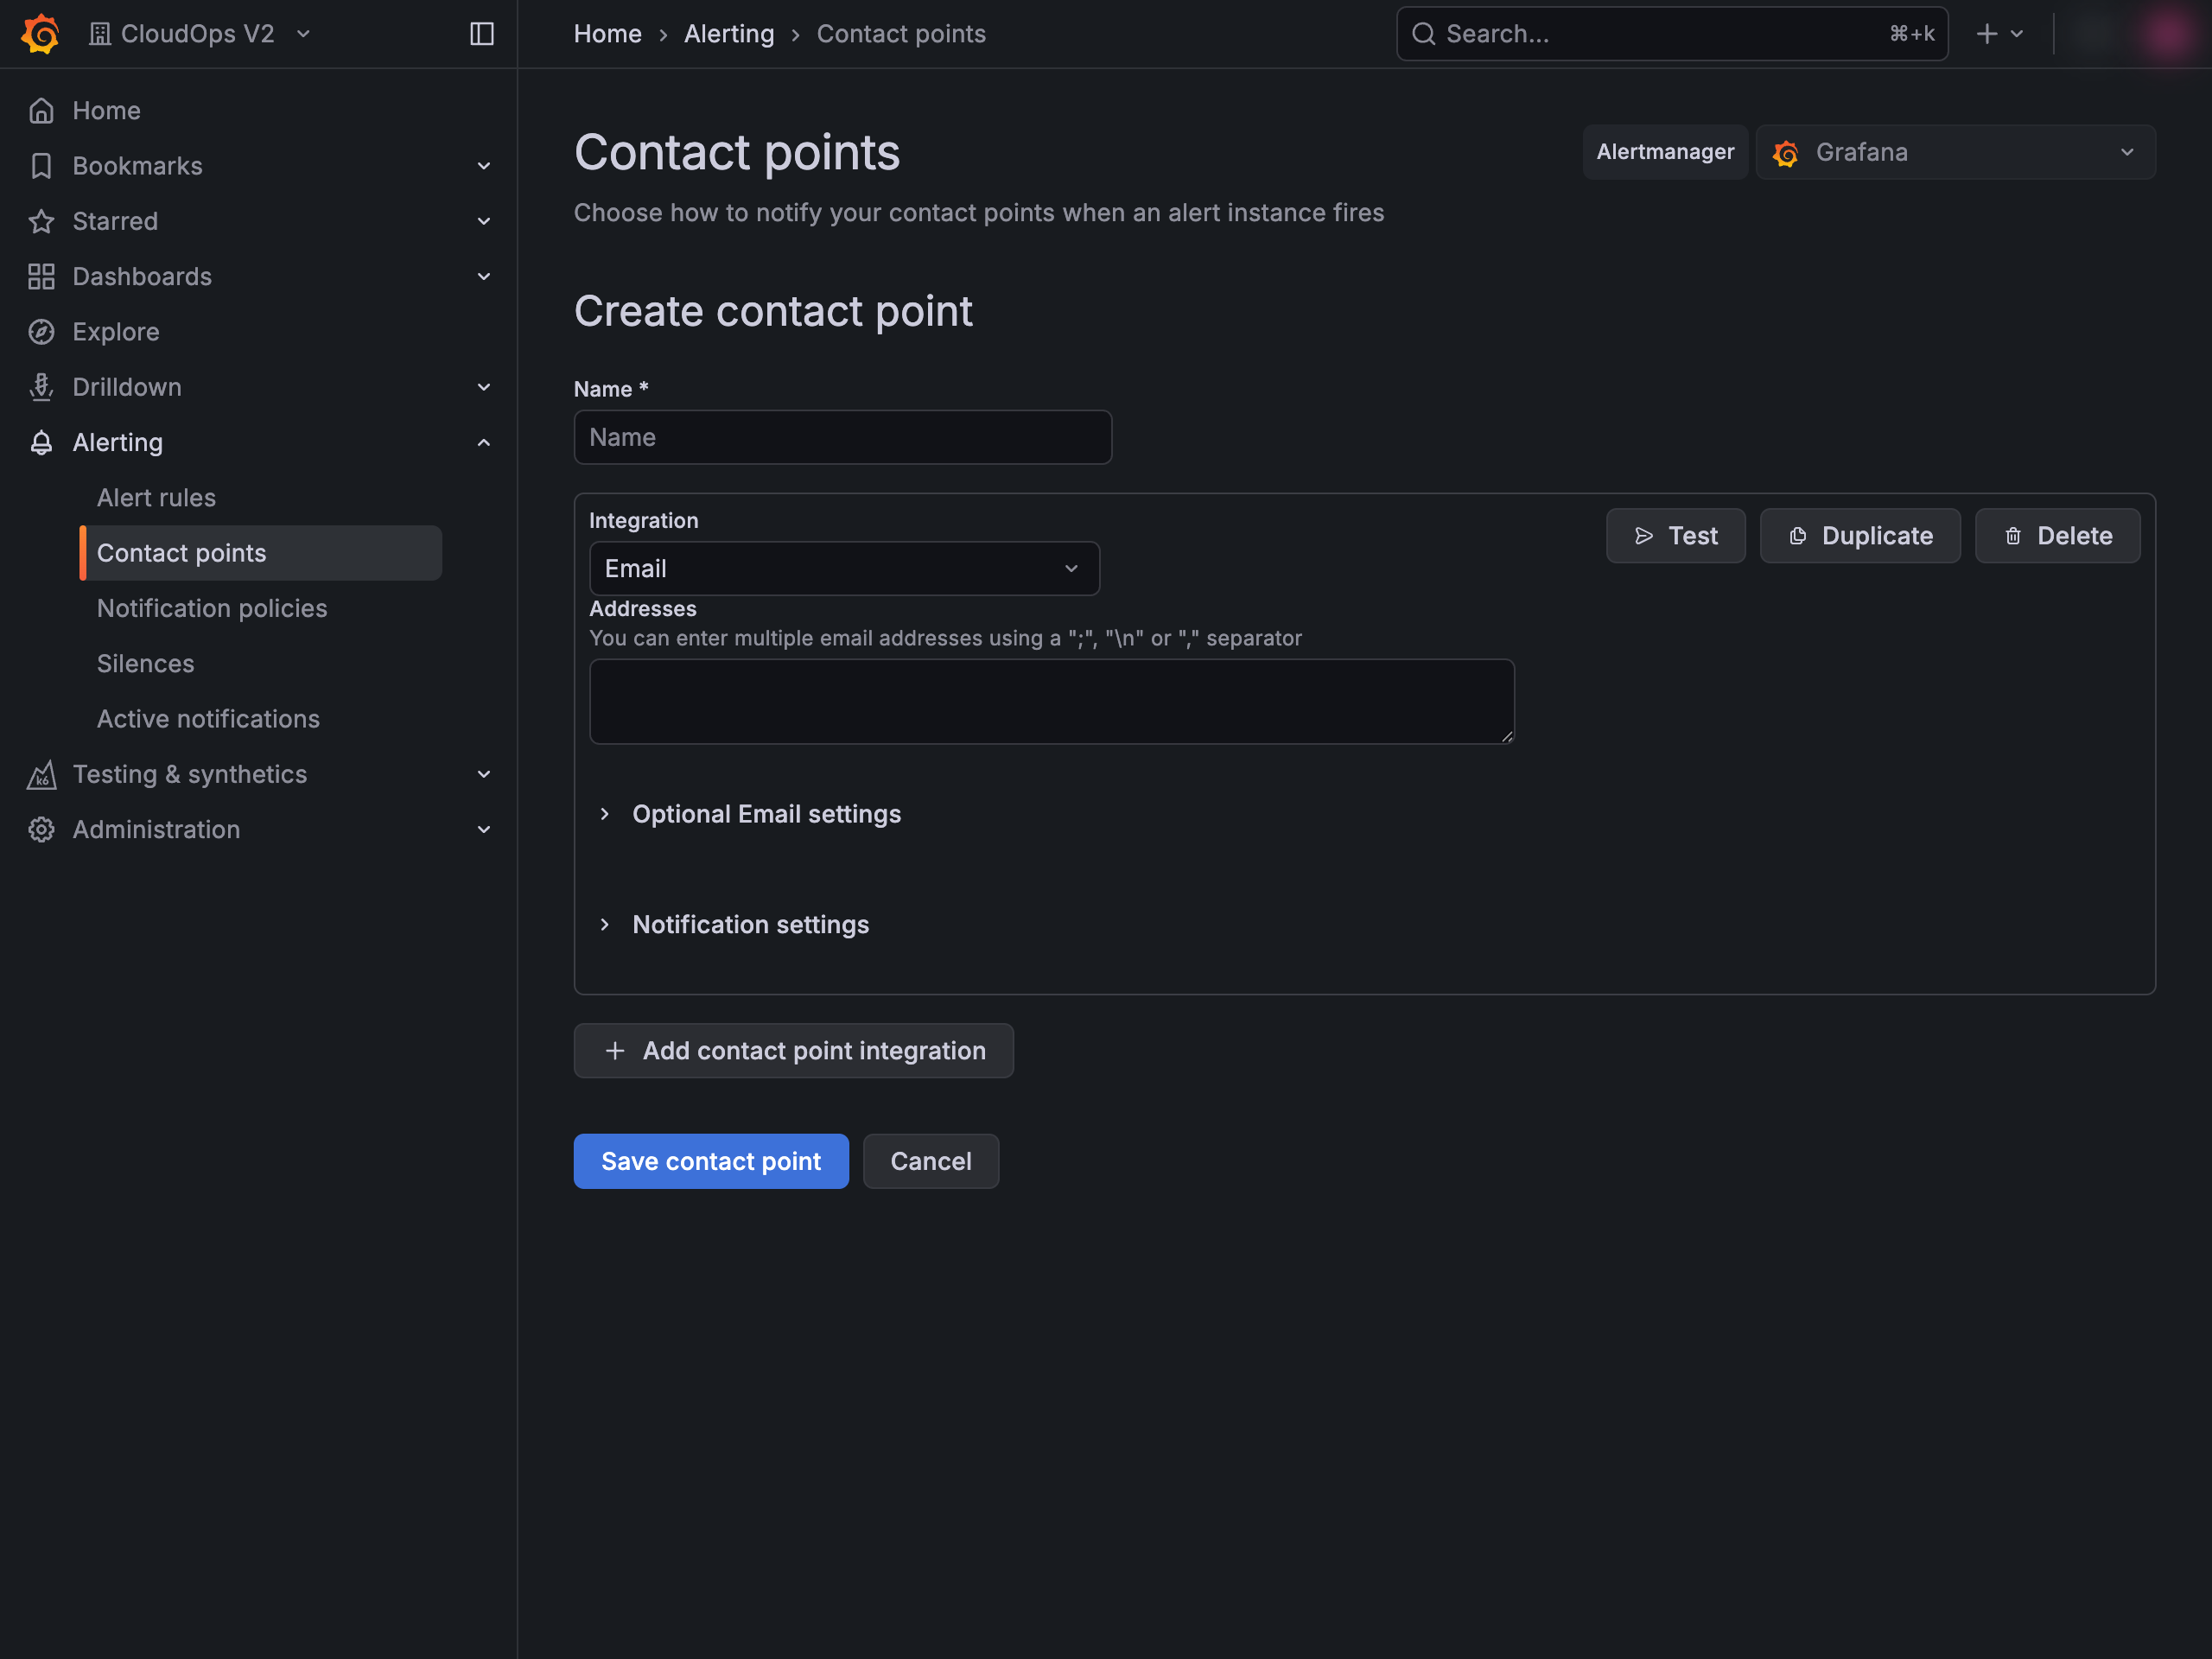
Click [+ Create contact point] in the top right of the Contact points list. An empty Contact Point form opens.
Configure the Webhook integration
(1) Enter a Name for the contact point (for example, cloudops-webhook).
(2) Set Integration to Webhook (the form defaults to Email; switch it from the dropdown).
(3) Paste the CloudOps webhook URL into the URL field.
(4) Leave HTTP method as POST.
Body template unless you have a tested CloudOps payload customization.Save the Contact Point
Click [Save contact point] at the bottom of the page. The new contact point appears in the list.
2. Route alerts to the Contact Point
A Notification Policy decides which alerts go to a contact point. Without a matching policy, the contact point you just created will never be hit.
You can either point the default policy at the new contact point (simplest), or create a specific policy that matches a subset of alerts by labels.
Open Notification Policies
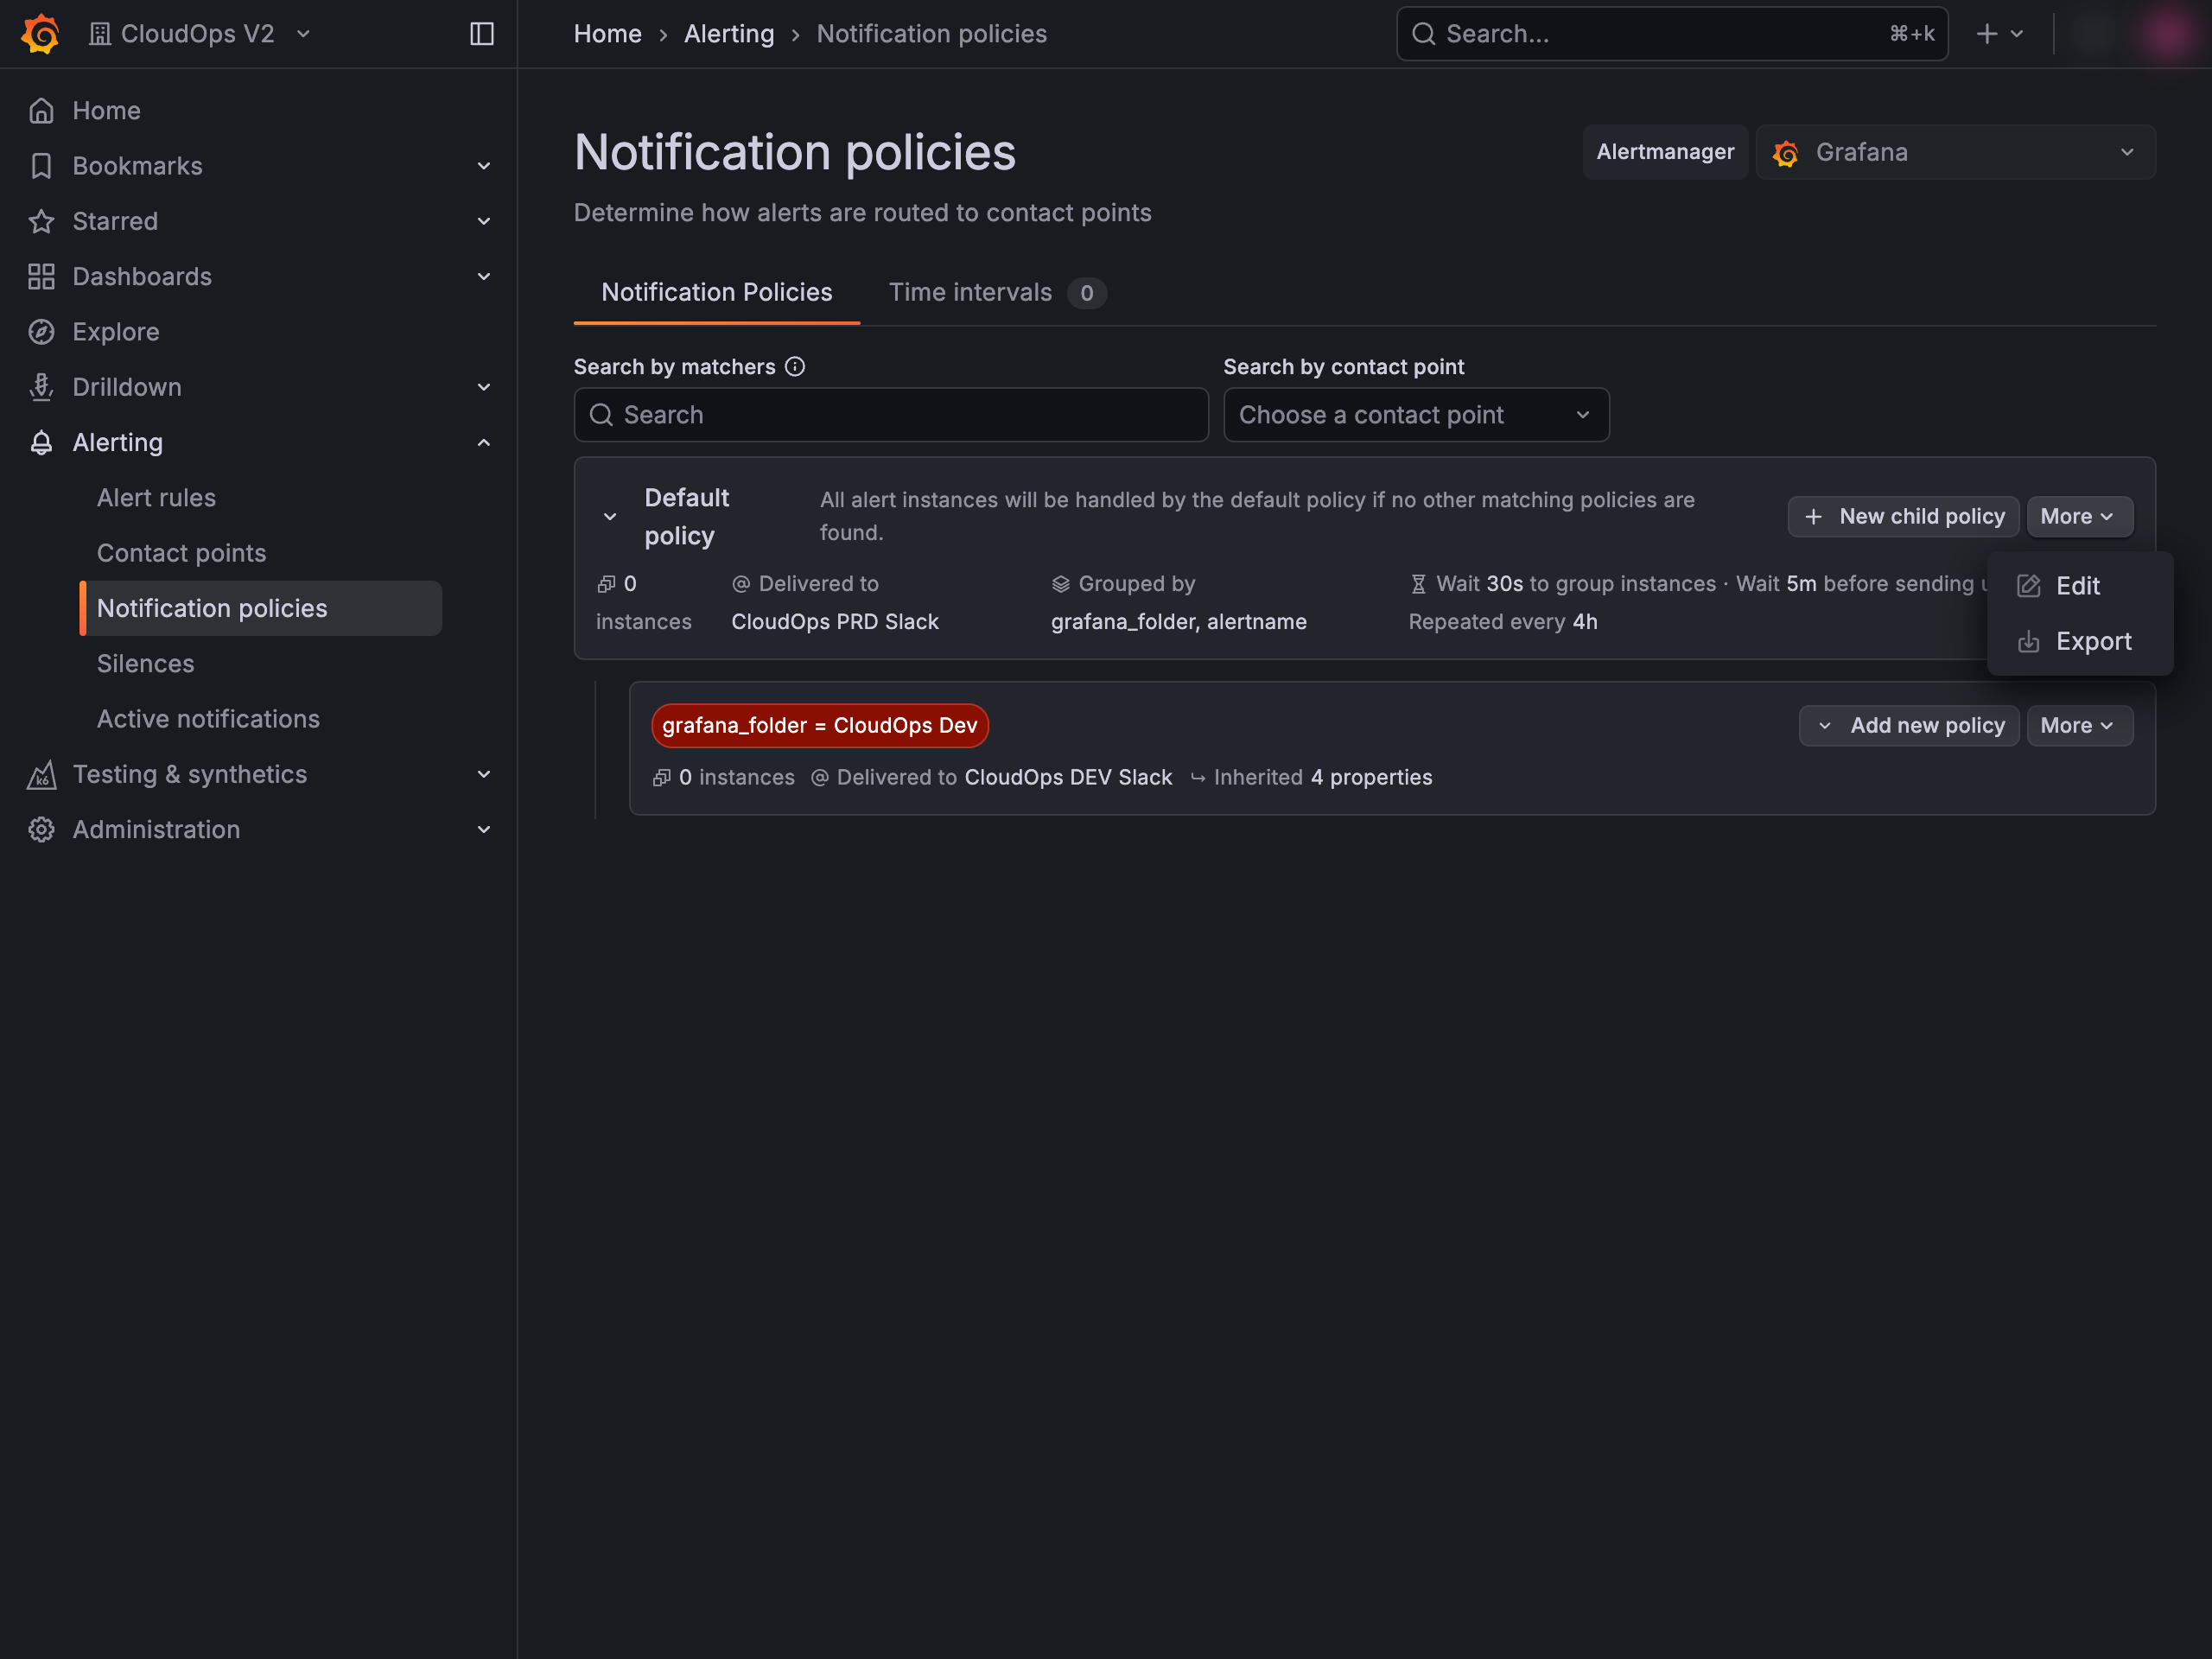
In the side navigation, go to [Alerting > Notification policies]. The Default policy card appears at the top of the page.
Choose a routing approach
- Option A — Update the default policy — open the [More] menu on the Default policy card and choose [Edit]. In the form, change Default contact point to the contact point you just created, then Save. All alerts not matched by a more specific policy will go to CloudOps.
- Option B — Add a child / nested policy — click the [+ New child policy] button on the Default policy card (in some Grafana versions this is [Add nested policy] inside the [More] menu). In the form, define Matching labels that select the alerts you want to forward, set Contact point to the new contact point, then Save. Use this when only a subset of alerts should reach CloudOps.
severity =~ critical|warning, team = platform, etc.). Verify your alert rule emits the labels you match here, otherwise alerts will fall back to the default policy.3. Test the integration
Verify that Grafana → CloudOps wiring works before you let real alert rules depend on it.
Send a test notification
Go back to [Alerting > Contact points], open the [⋯] menu on the row of the contact point you created, then click [Test]. Confirm with [Send test notification] in the dialog that appears.
Verify on CloudOps
Open the CloudOps console and check that the test event arrived under the alert source you registered for this webhook. If it does not arrive:
- Confirm the URL in the contact point matches the value issued by CloudOps exactly.
- Confirm a Notification policy routes to the contact point (step 2 above).
- Check Grafana’s [Alerting > History] view for delivery errors on the contact point.
(Optional) Create an alert rule
If you do not yet have any alert rule firing into Grafana’s alerting engine, create one:
- Go to [Alerting > Alert rules] and click [+ New alert rule].
- Pick a data source and define the query/threshold that should trigger the alert.
- Under Labels and notifications, set labels that your notification policy in step 2 matches.
- Save the rule.
For the full alert-rule authoring flow, see the Grafana documentation .