Integrate Grafana to CloudOps
This guide explains how to register a Grafana Alerting webhook source in CloudOps so that alerts forwarded from Grafana are ingested as CloudOps events.
Prerequisites
Before integrating, make sure you have:
- A Grafana instance you administer (Editor or Admin role on the target organization).
- Access to the CloudOps console with permission to register webhooks under your tenant.
You will configure the Grafana side after this registration, using the webhook URL CloudOps issues here. See Alert Webhook setup on Grafana.
Register the Grafana webhook source
Open Webhook Management
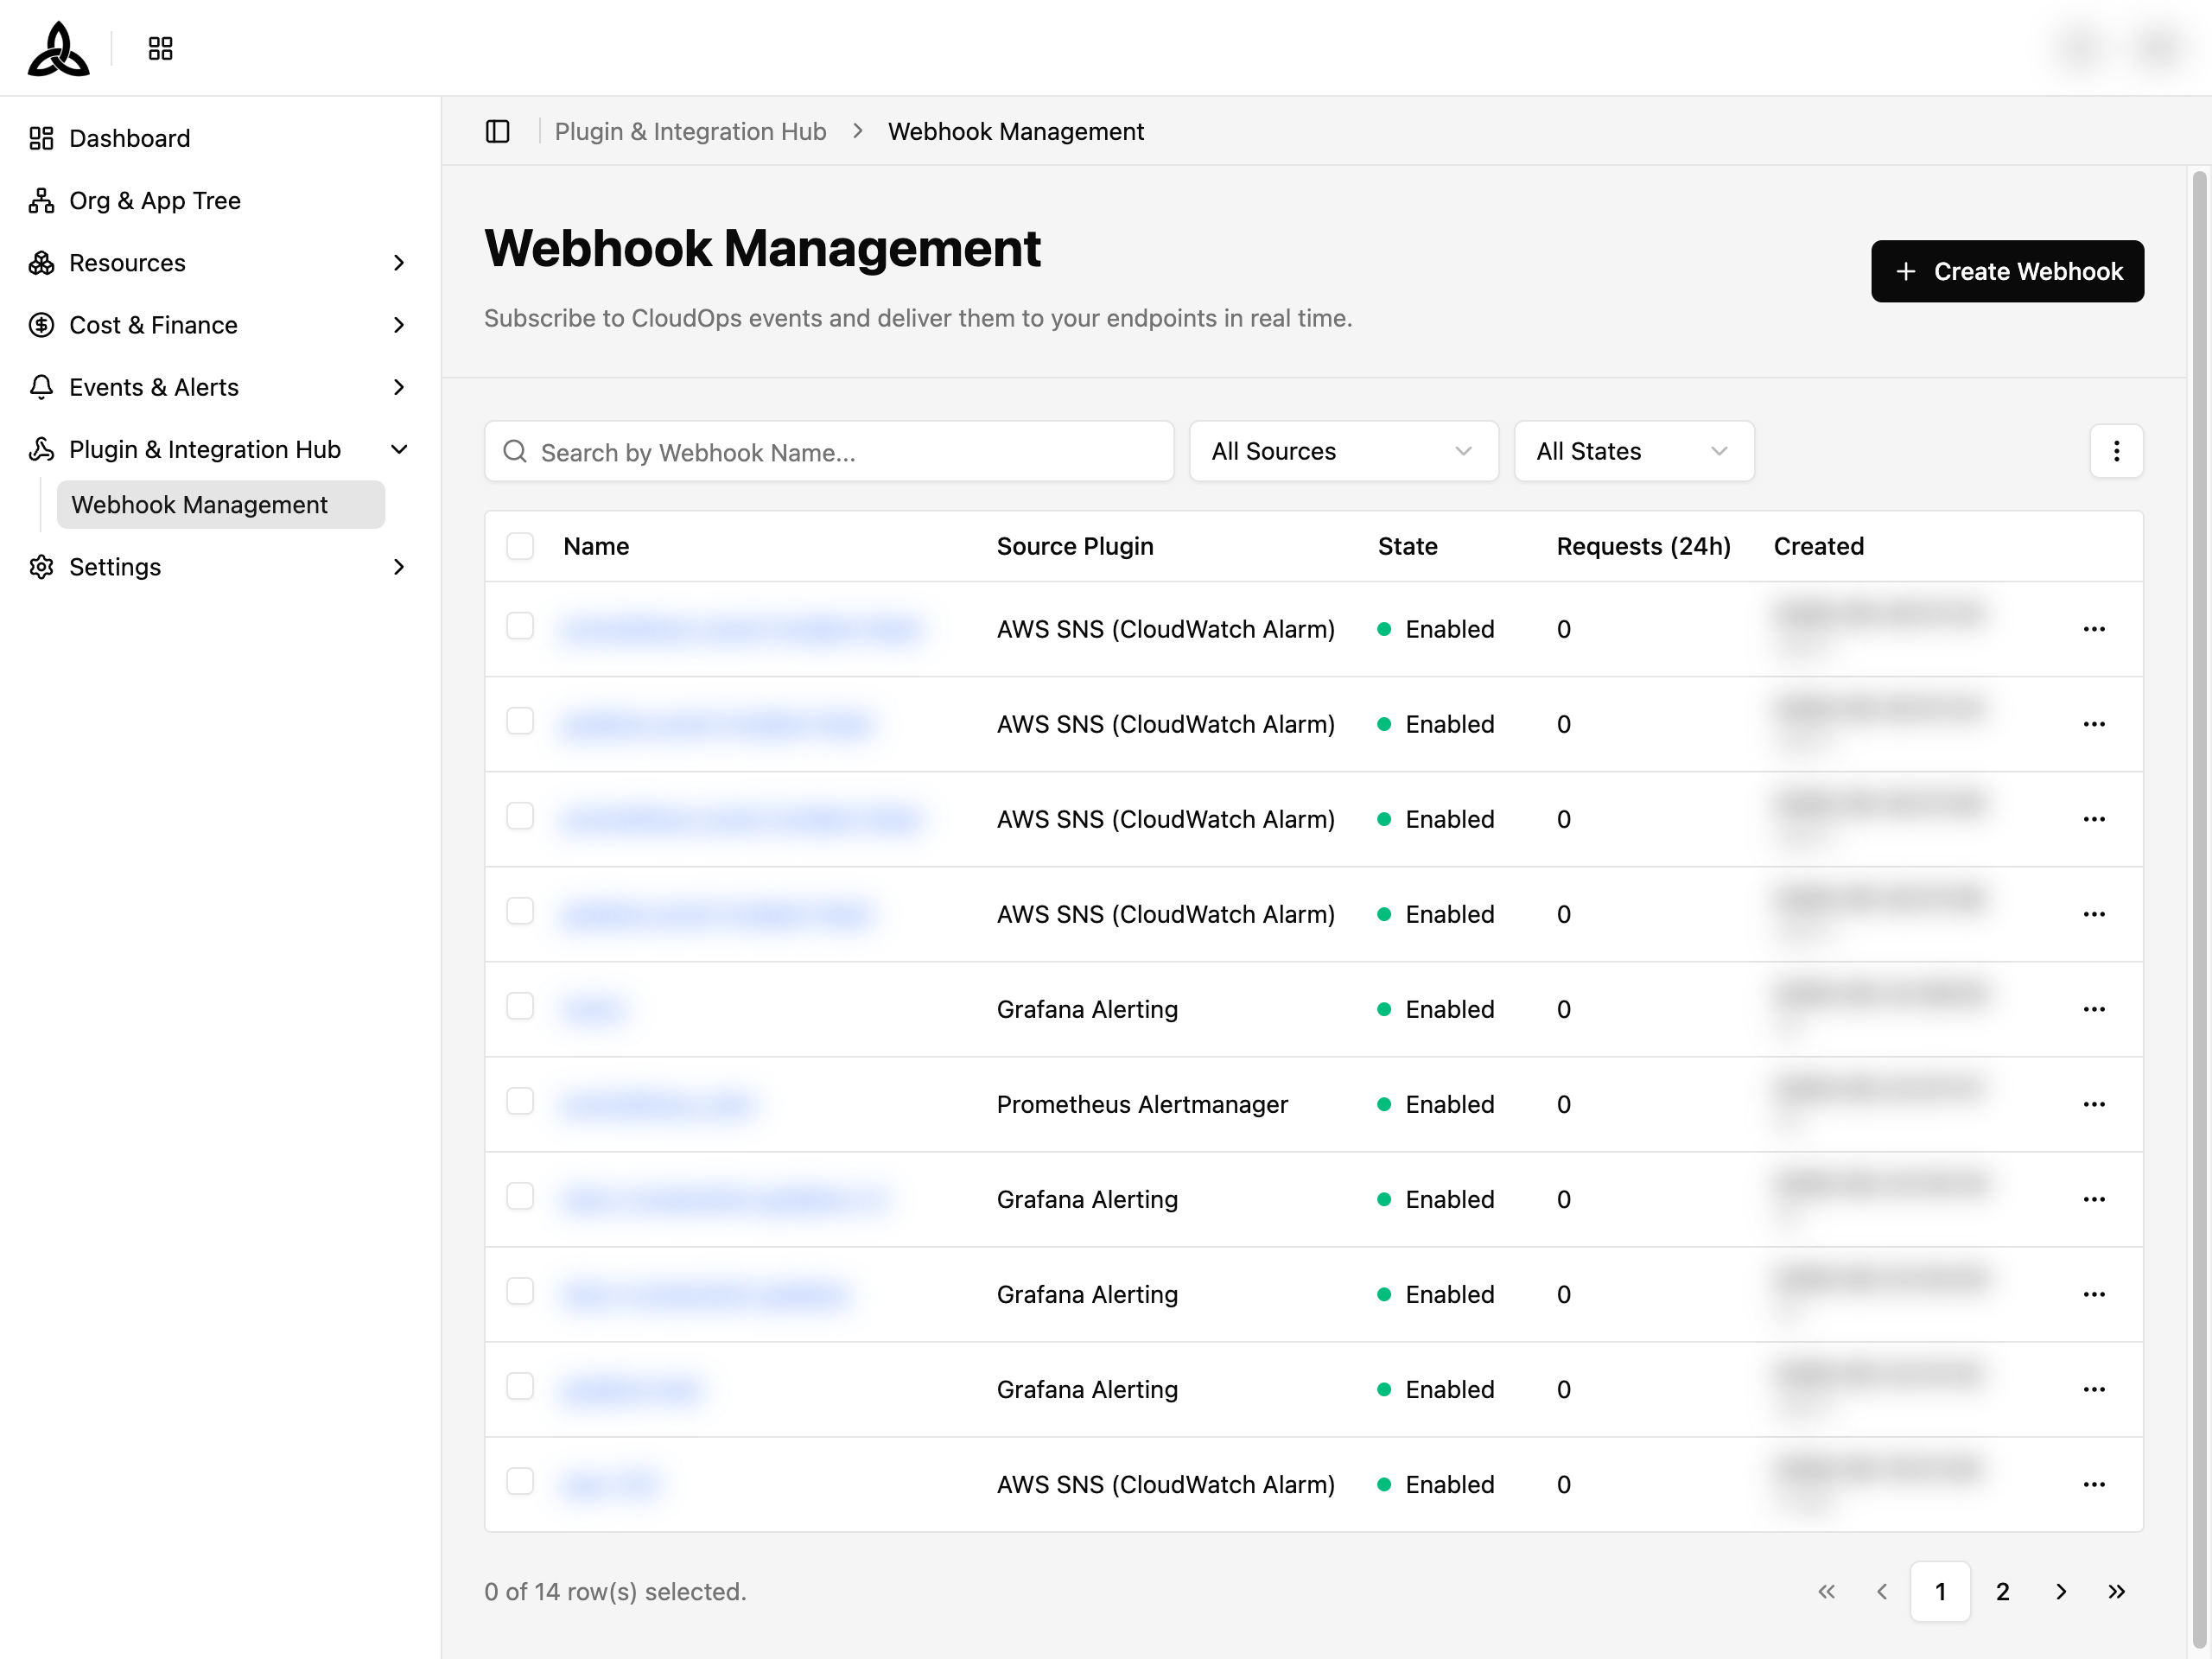
In the CloudOps console, go to [Plugin & Integration Hub > Webhook Management] and click [+ Create Webhook] in the top right.
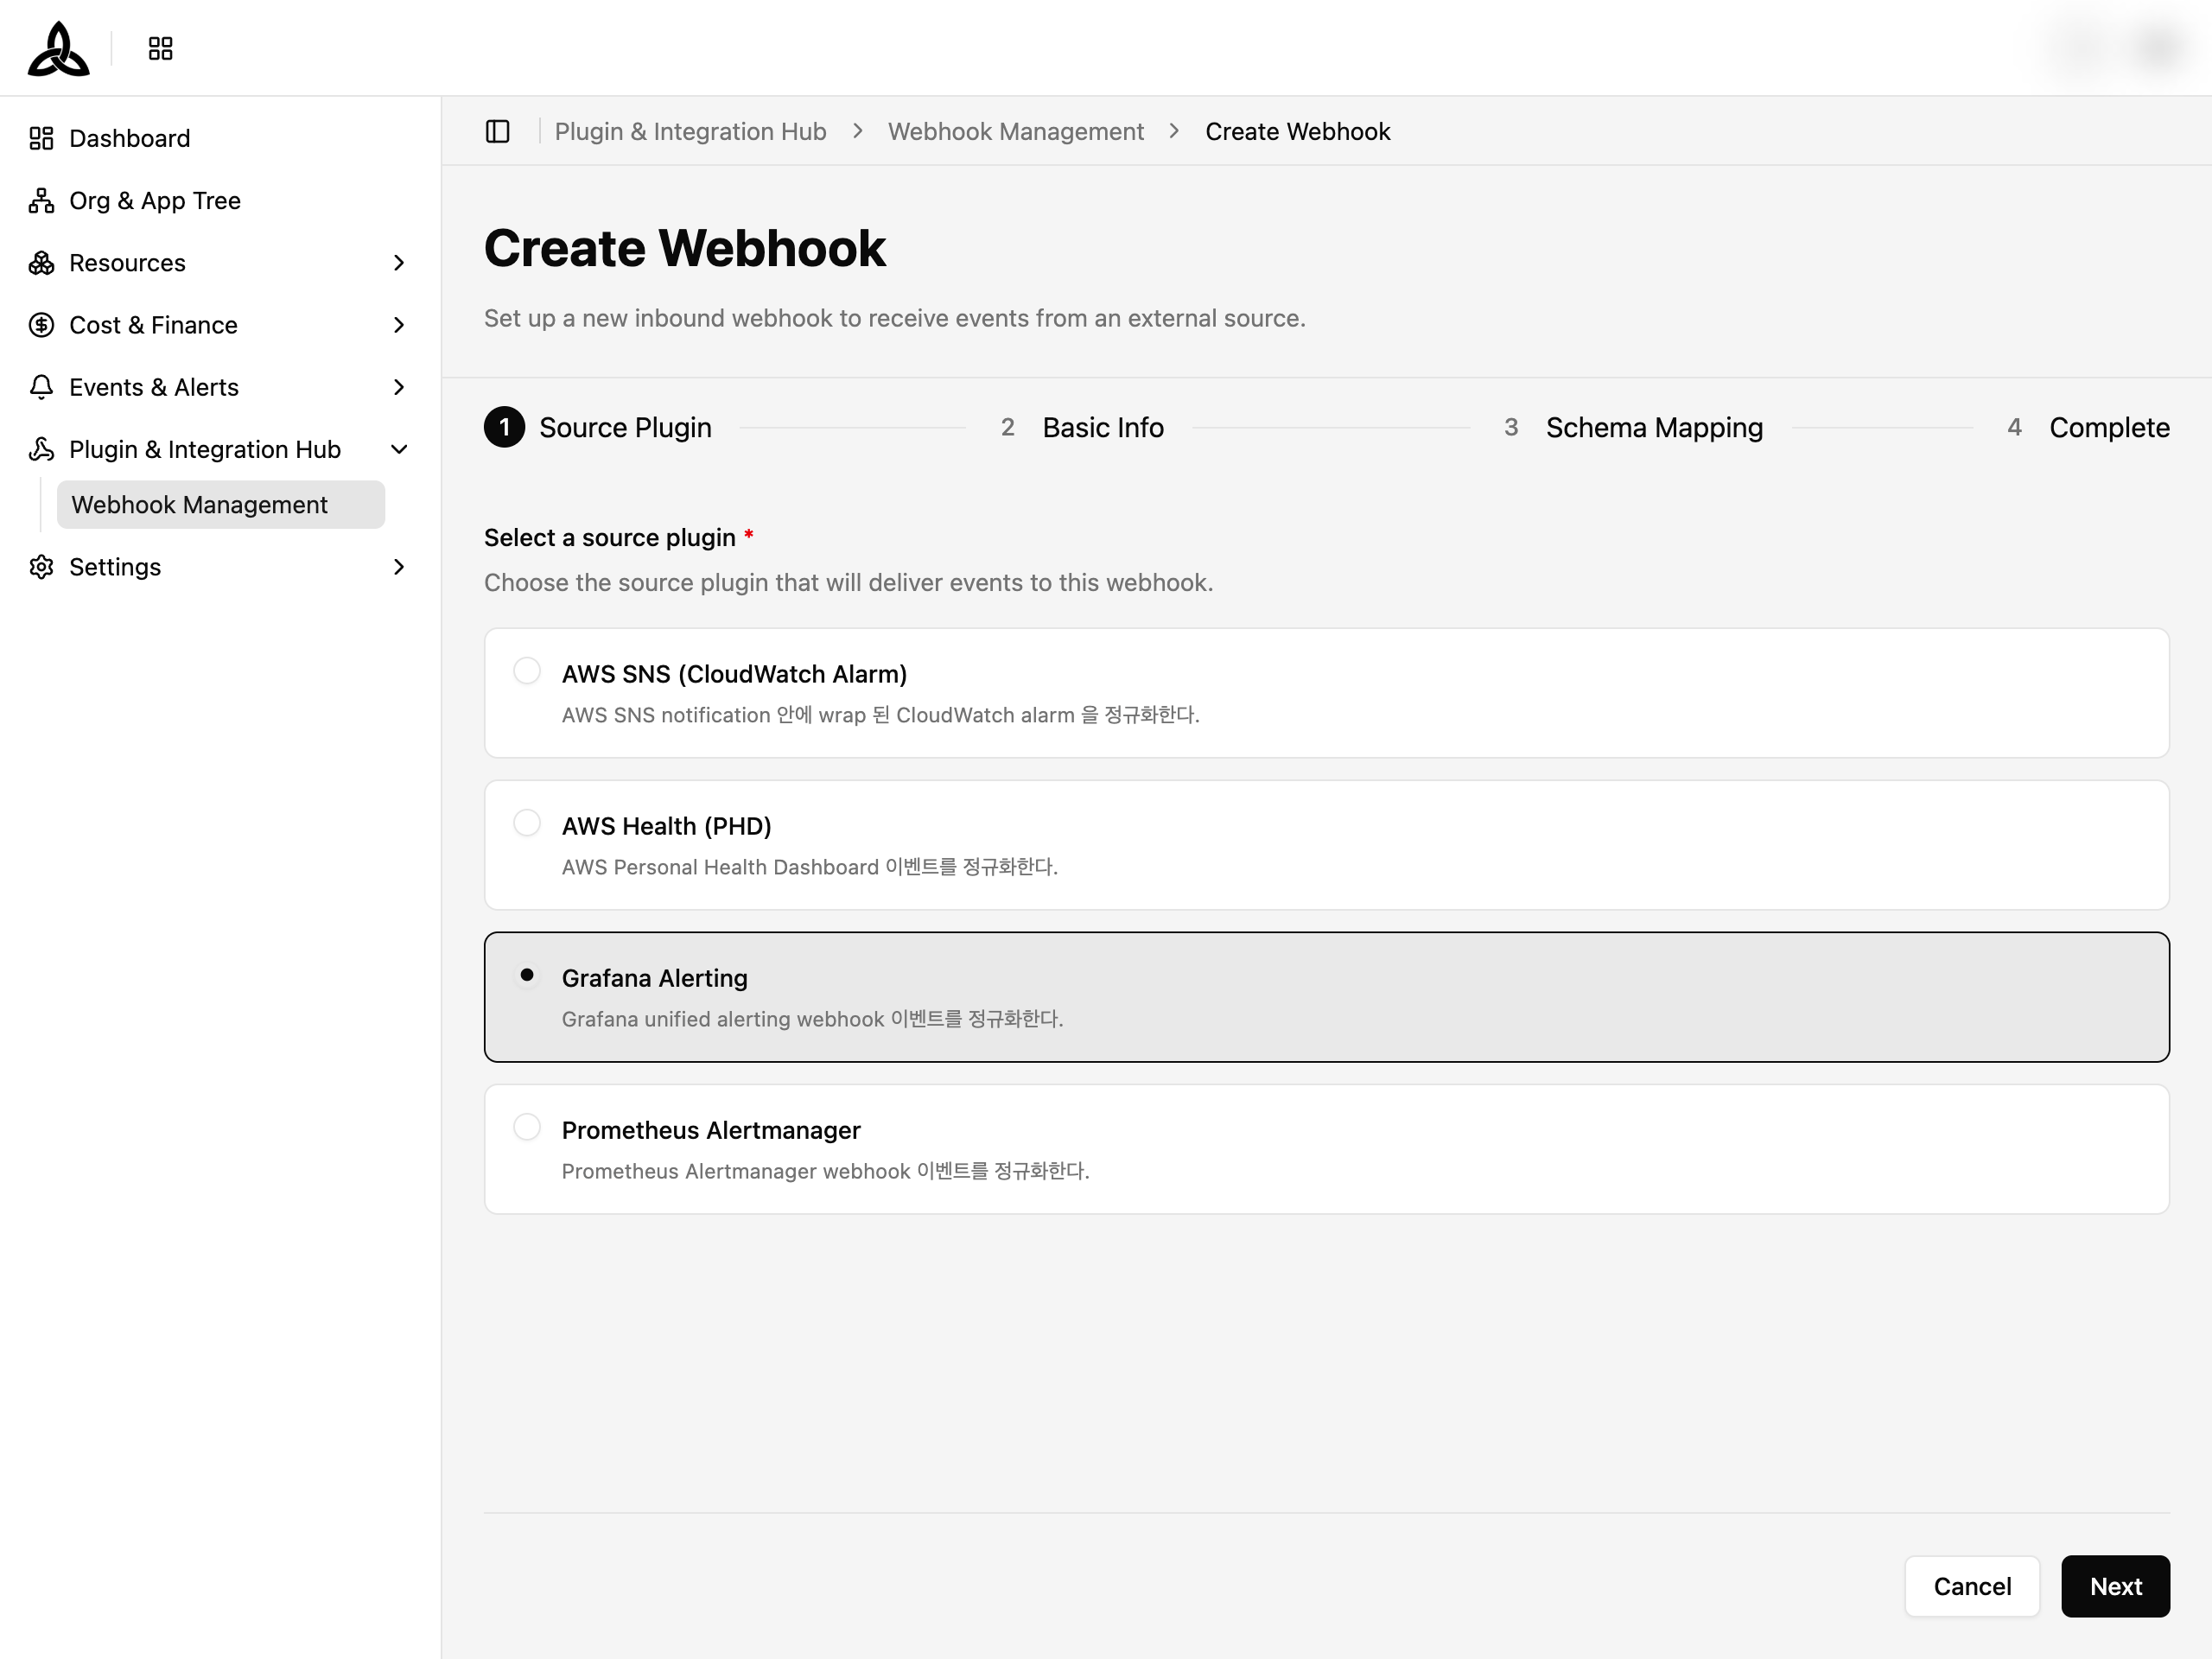
Step 1 — Select the source plugin
The Create Webhook wizard opens at Step 1: Source Plugin. Select Grafana Alerting as the source plugin, then click [Next].
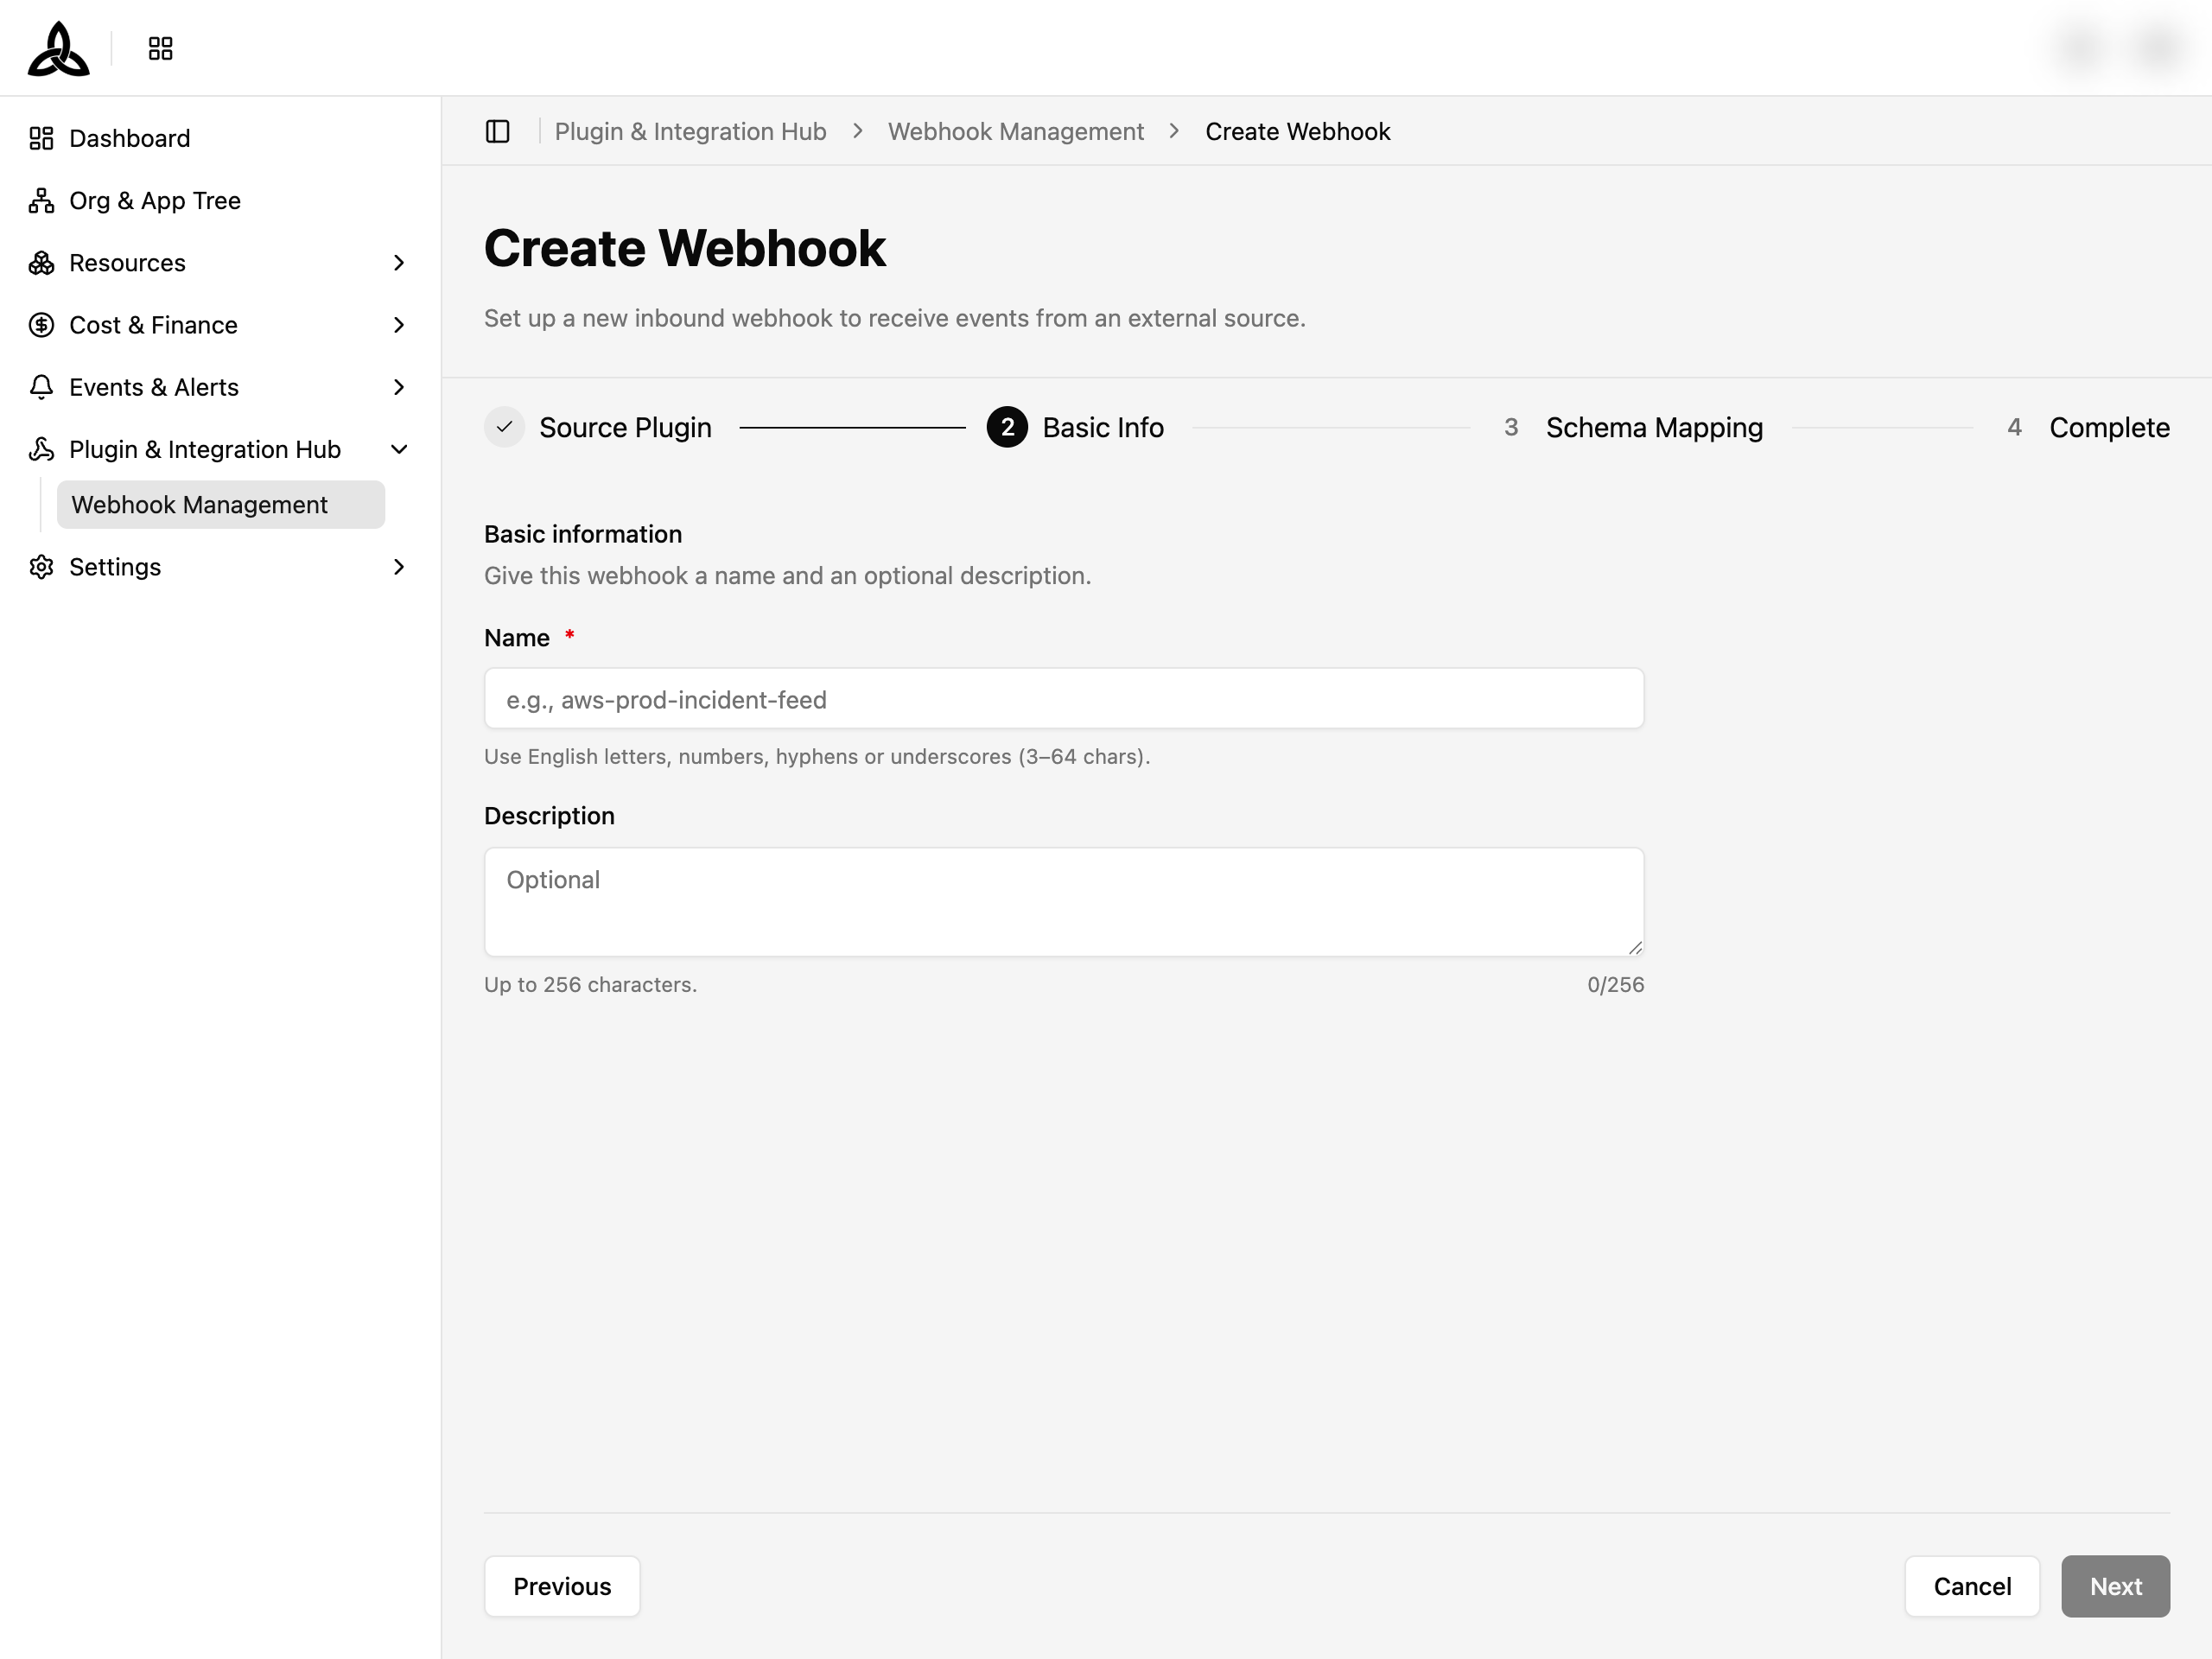
Step 2 — Enter basic information
- Name — give this webhook a name (English letters, numbers, hyphens or underscores, 3–64 characters). For example,
grafana-prod-incident-feed. - Description — optional, up to 256 characters.
Click [Next] to proceed.
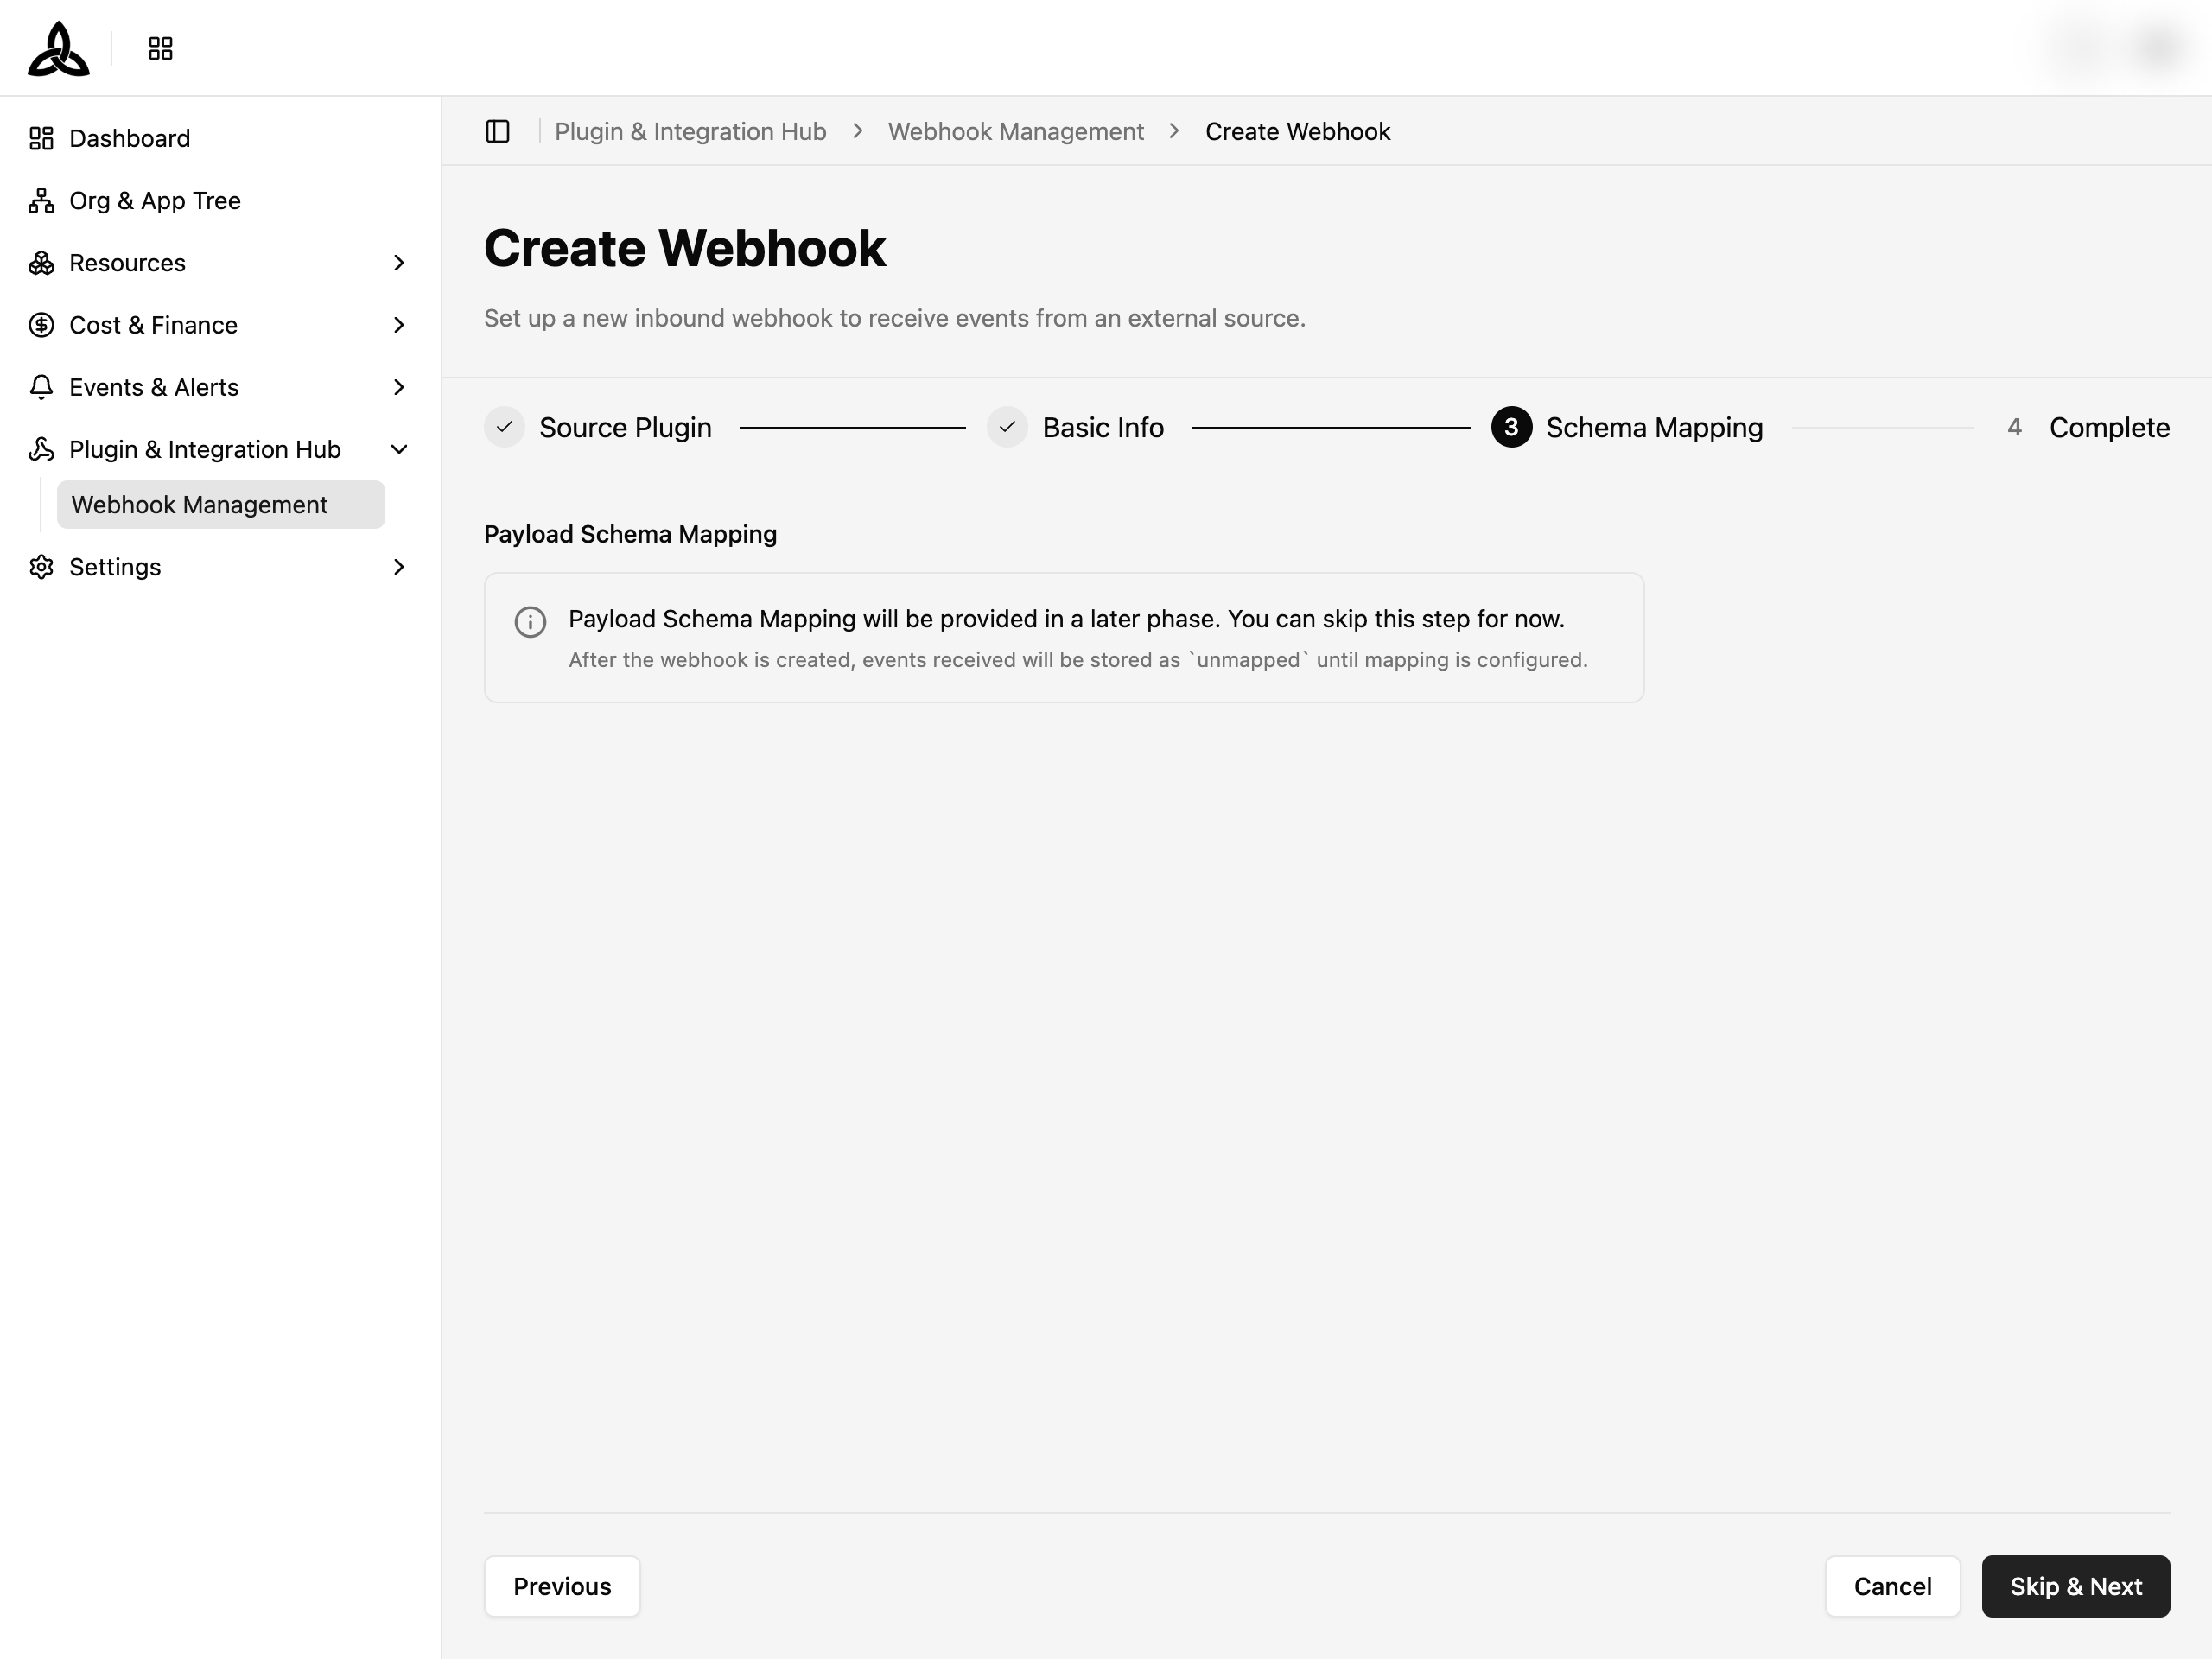
Step 3 — Schema Mapping
Payload Schema Mapping will be provided in a later phase. Click [Skip & Next] to continue.
unmapped and become available for routing once payload schema mapping is enabled.Step 4 — Copy the Webhook URL
On the Complete step, CloudOps shows the Webhook URL issued for this source. Click [Copy] next to the URL — this is the value you will paste into the Grafana Contact Point URL field in the Alert Webhook setup guide.
The webhook is created in the Active state and starts accepting events immediately.
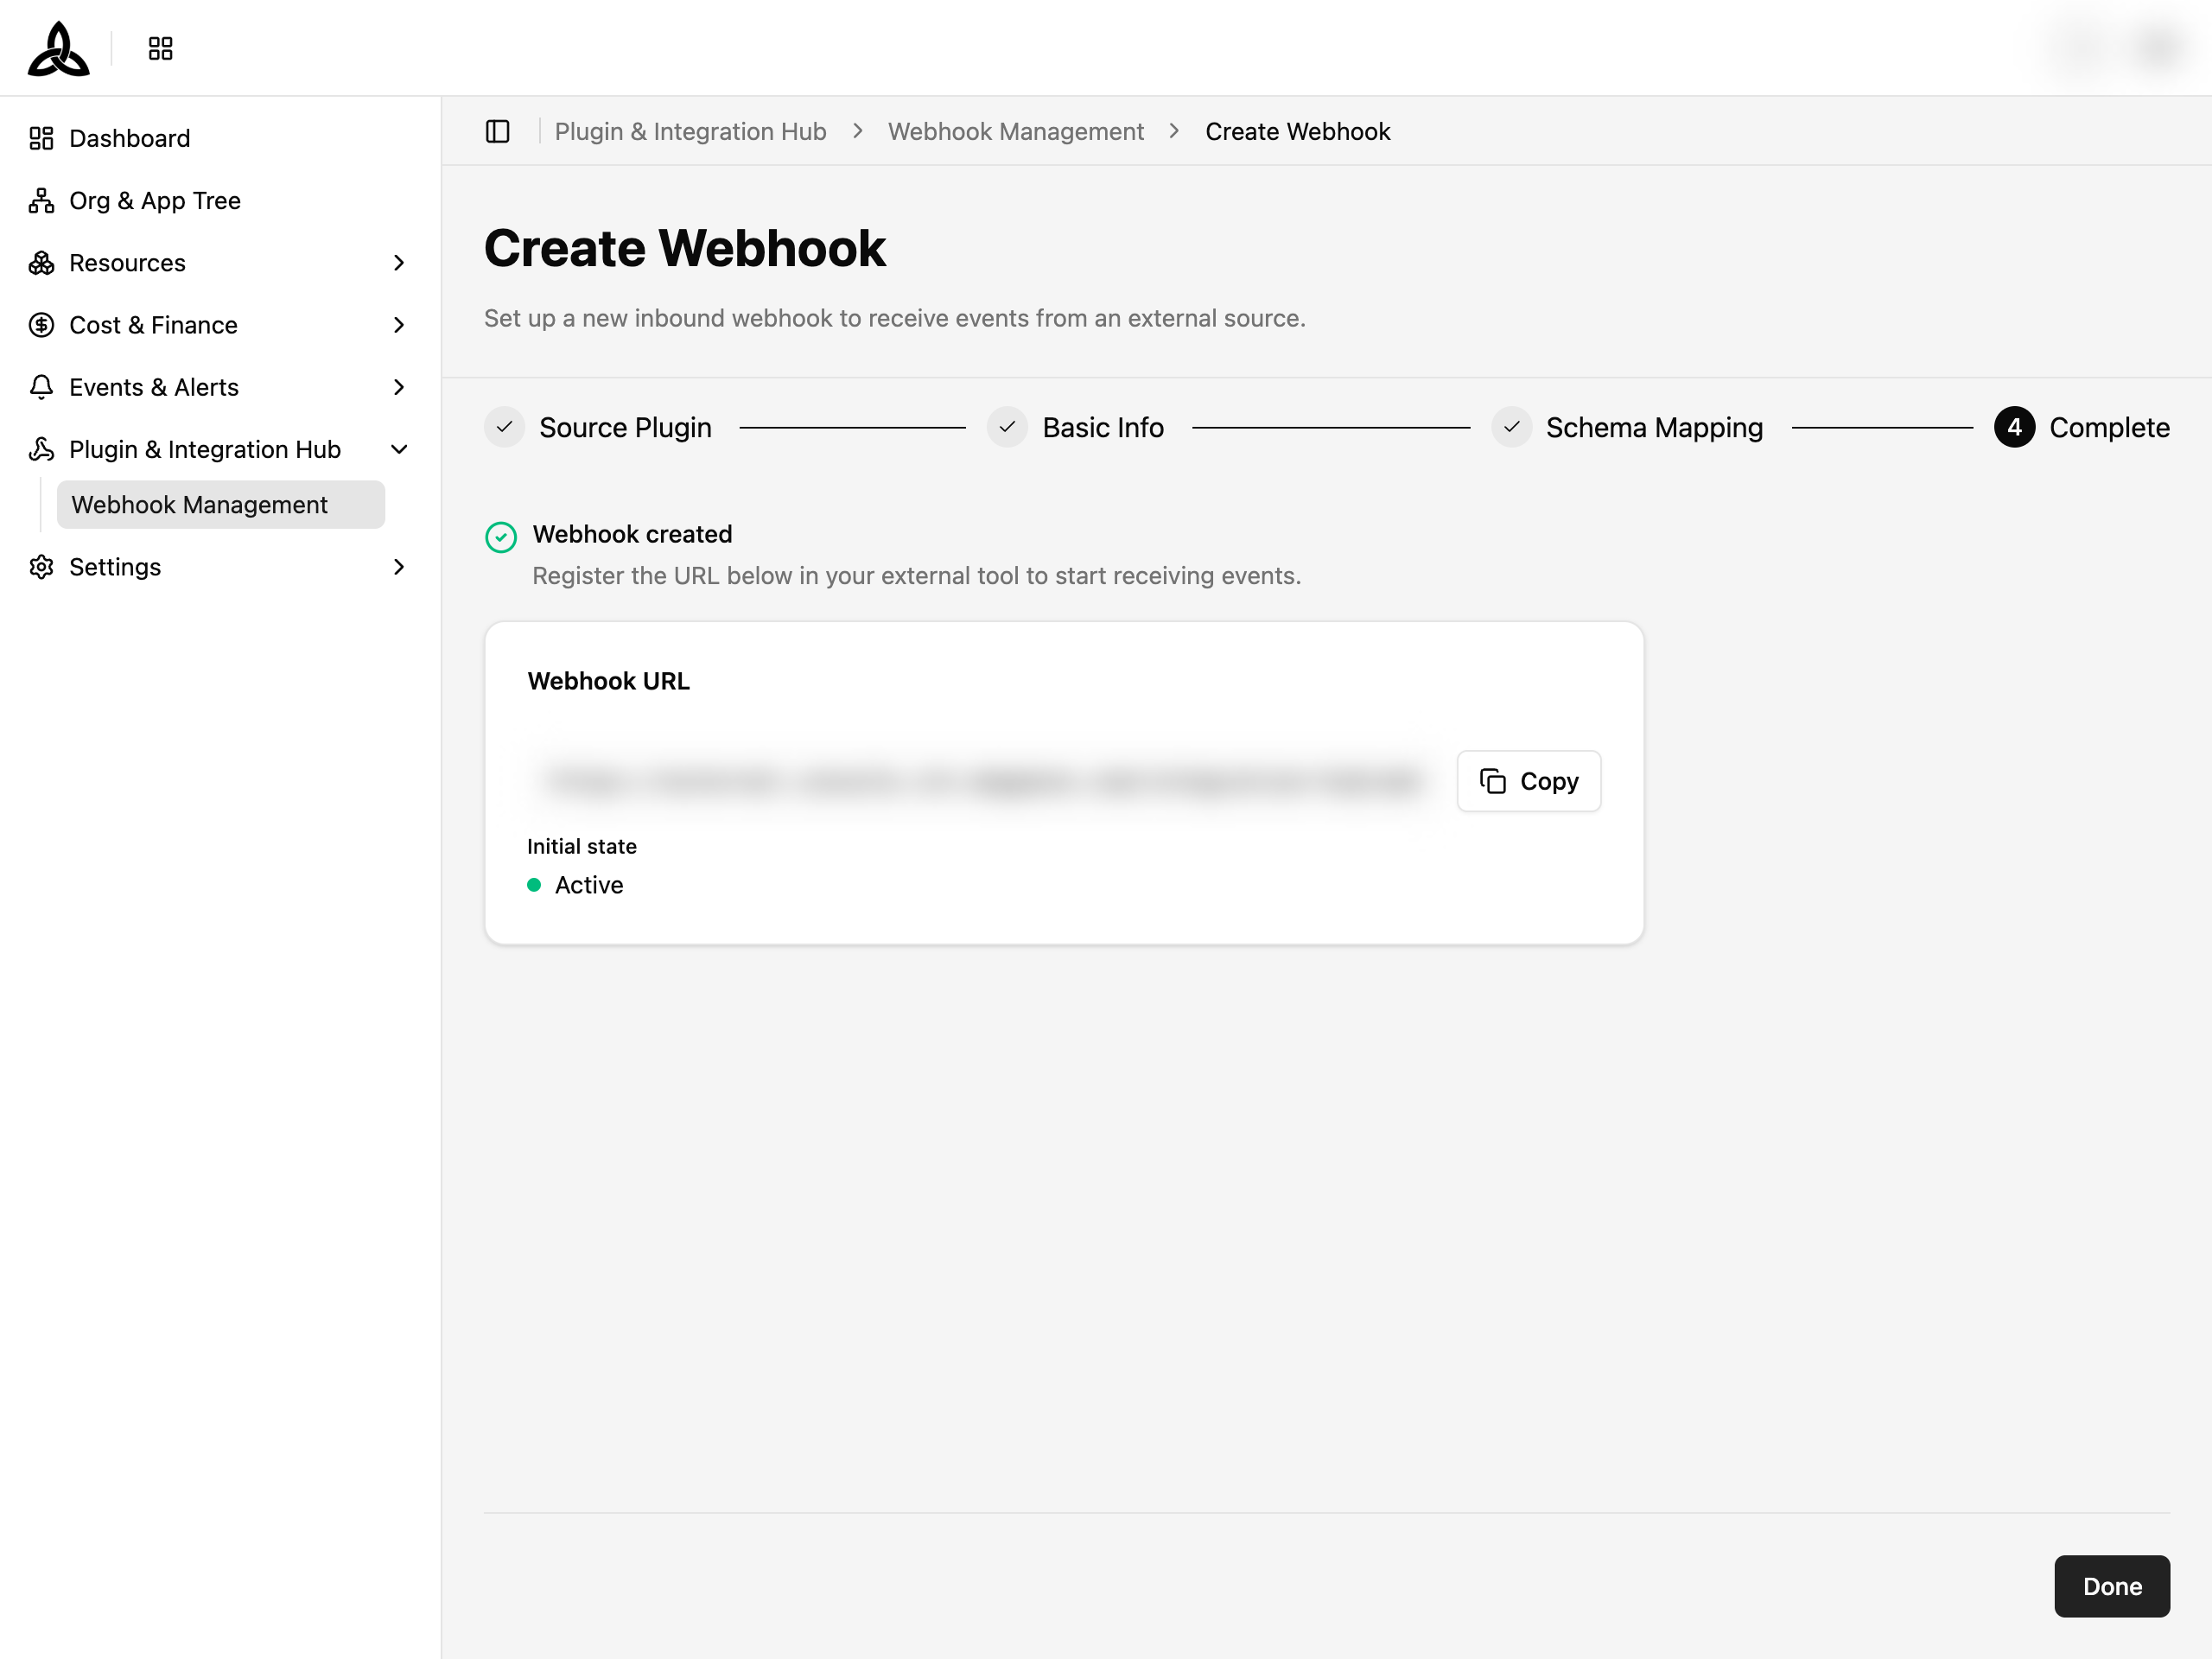
Click [Done] to finish the wizard.
Where received events appear
Once the sending side is wired up, incoming events land on the
Ticket Board with Source set to
Alert. Track and resolve them there.
To confirm delivery before real traffic arrives, open the webhook from
Webhook Management and use
[Send Test Event]. Its Quick Stat panel also shows the last 24 hours of Requests, OK,
Unmapped, Failed, and Rejected counts.
Next step
Continue with the Grafana-side setup so that alerts actually fire into the webhook URL you just obtained: