Resource Monitoring
On the [Resources > Resource Monitoring] page, you manage the resources CloudOps watches for unusual usage, and the anomaly-detection rules that decide when that usage counts as unusual. Where Resource Inventory answers what do I have, this page answers what is behaving oddly.
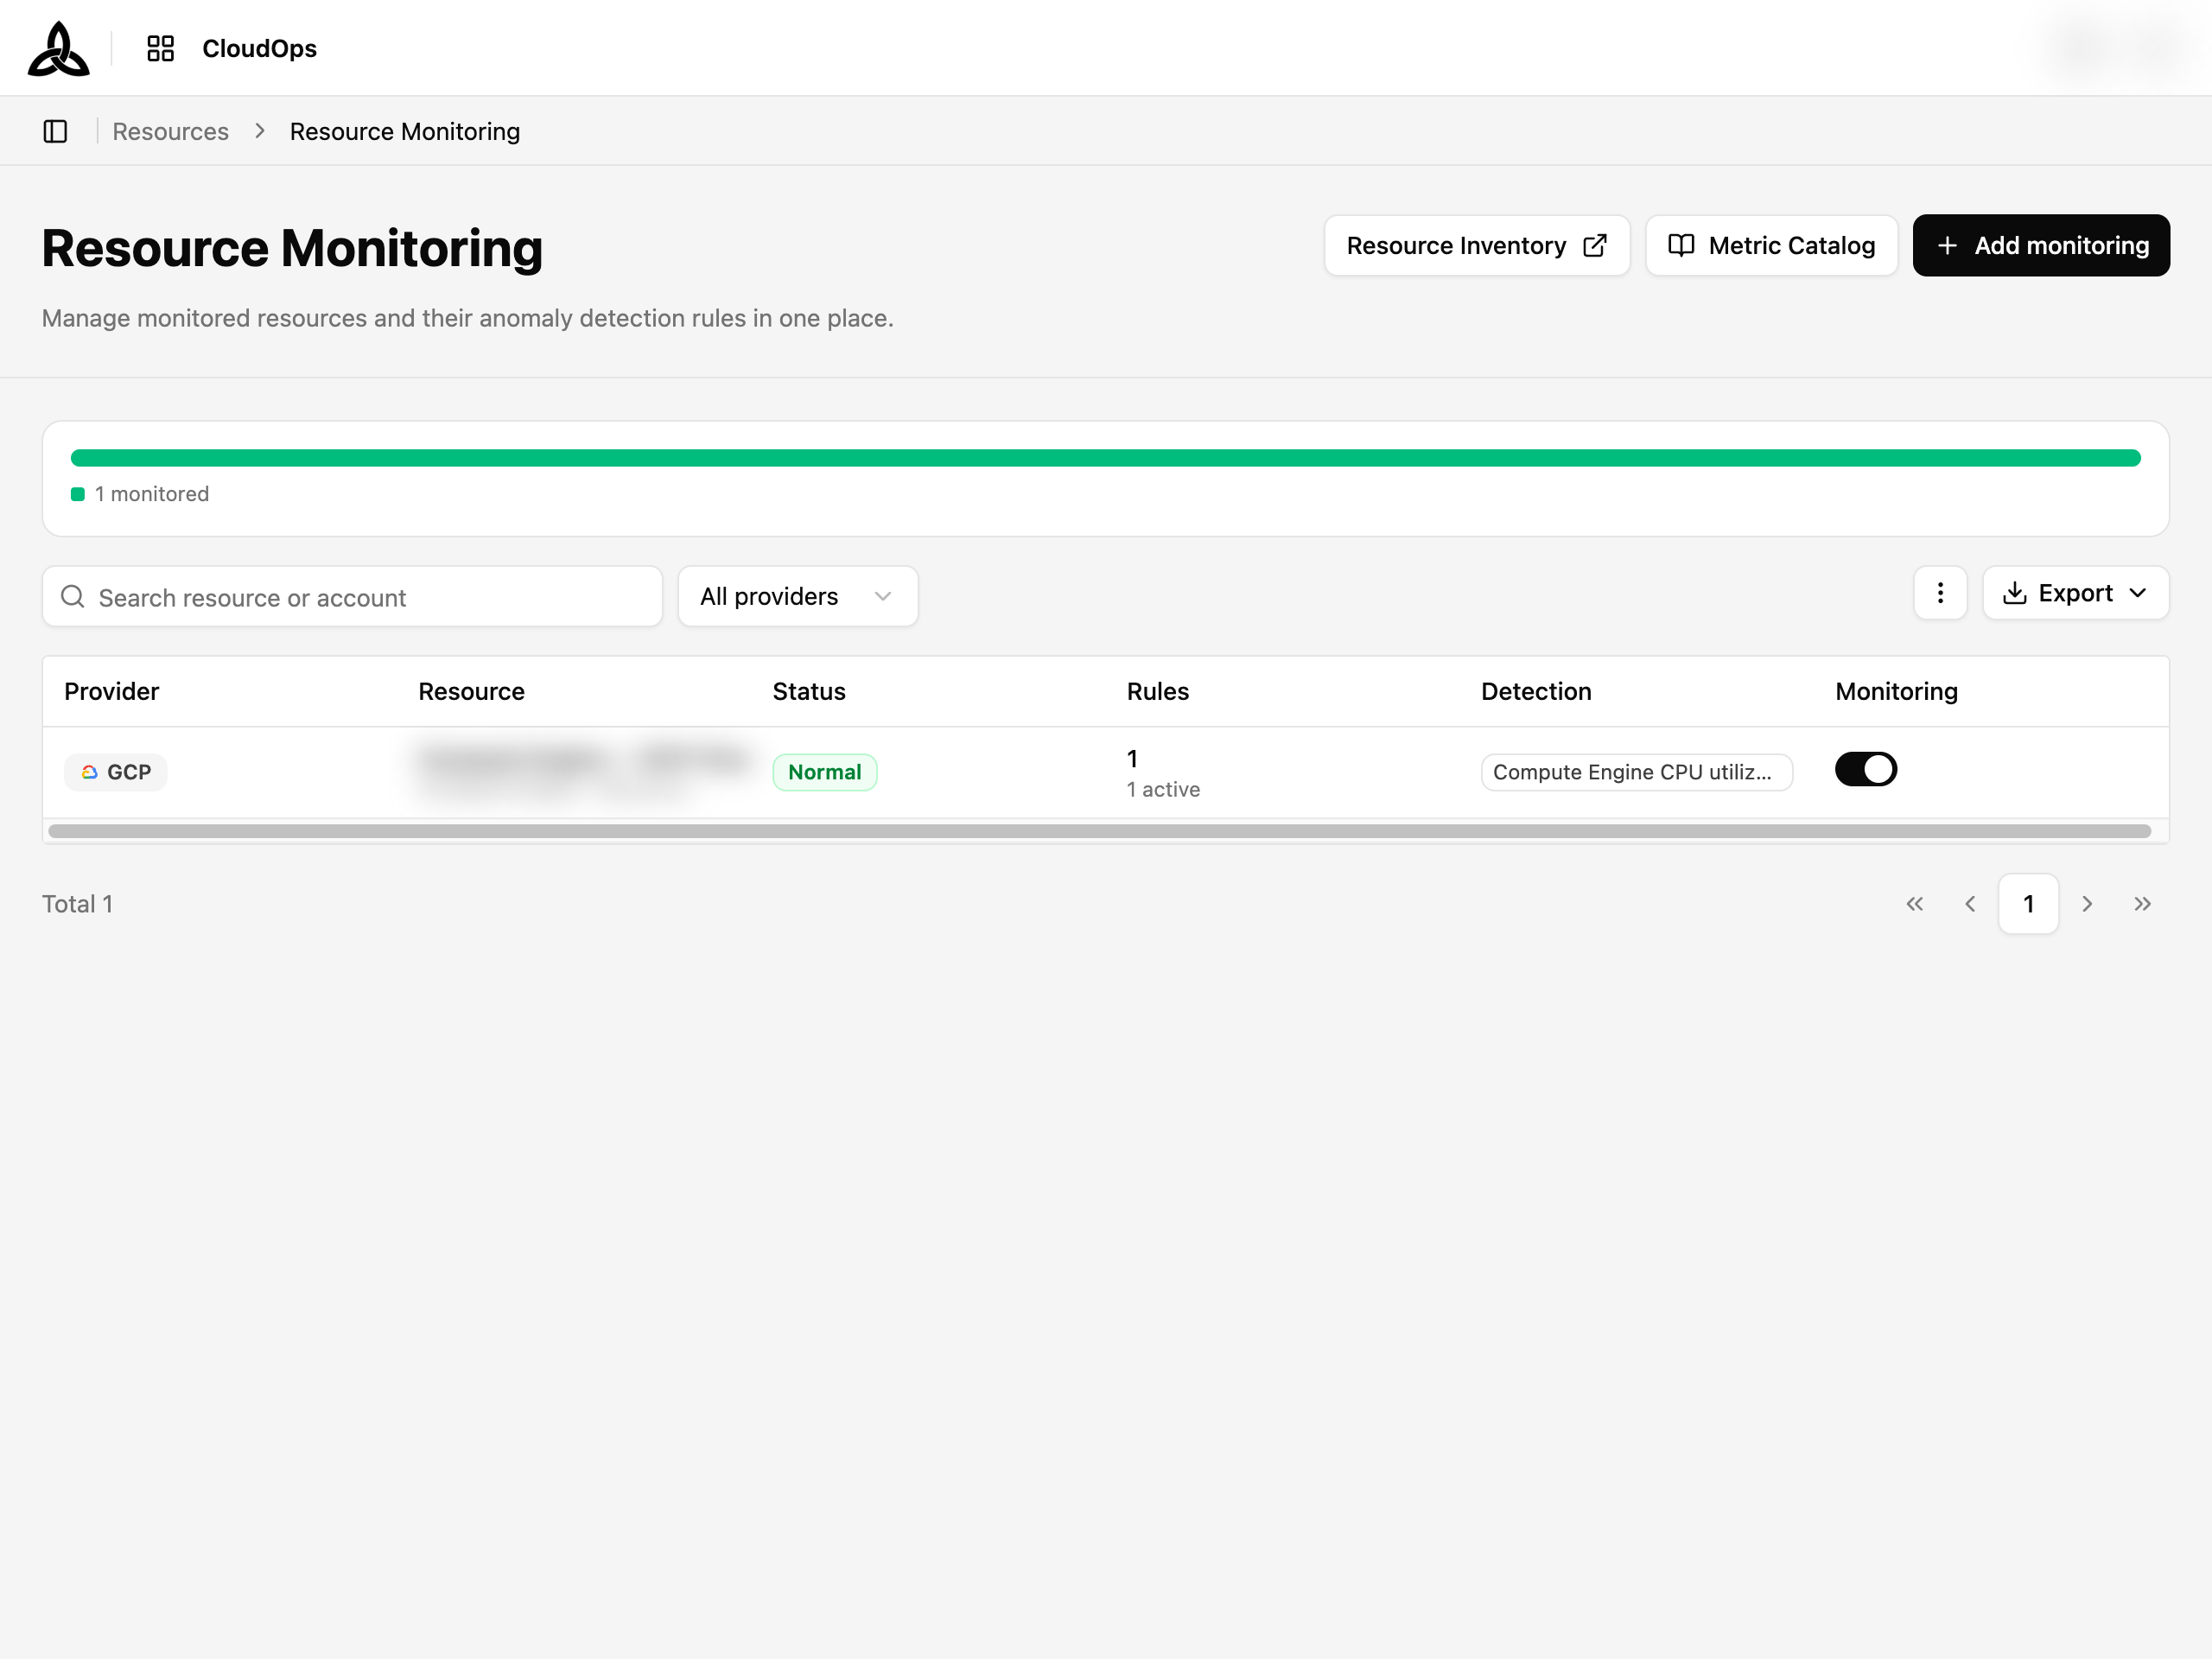
The Monitored List
The bar at the top shows how many targets are being monitored. Search by resource or account, and narrow by provider.
| Column | Description |
|---|---|
| Provider | The cloud provider the target belongs to |
| Resource | The monitored target, with its service and monitoring scope underneath |
| Status | The current detection state — Normal while nothing is firing |
| Rules | How many detection rules exist, and how many are active |
| Detection | The metric being watched and its sensitivity |
| Monitoring | A switch to turn monitoring off for this target without deleting it |
The leading columns stay pinned to the left while you scroll the table sideways, so a row’s identity never scrolls out of view.
The header also links out to [Resource Inventory], and opens the [Metric Catalog].
Exporting the List
[Export] on the toolbar turns what you are currently looking at into a file.
Selecting it offers the two formats; choosing one starts the export.
| Format | Row limit |
|---|---|
| Excel | 30,000 rows |
| CSV | 50,000 rows |
The file is built from the filters you have applied and the columns visible on screen — narrowing the list narrows the file, and a column turned off in display settings does not appear in it. At least one column has to be on.
When the list is too big
Going over the row limit stops the export rather than silently truncating it, and you are told by how much. Narrow the filters — or turn off columns — and run it again.
The file downloads on its own once it is ready.
Metric Catalog
[Metric Catalog] lists the usage metrics that are available to monitor.
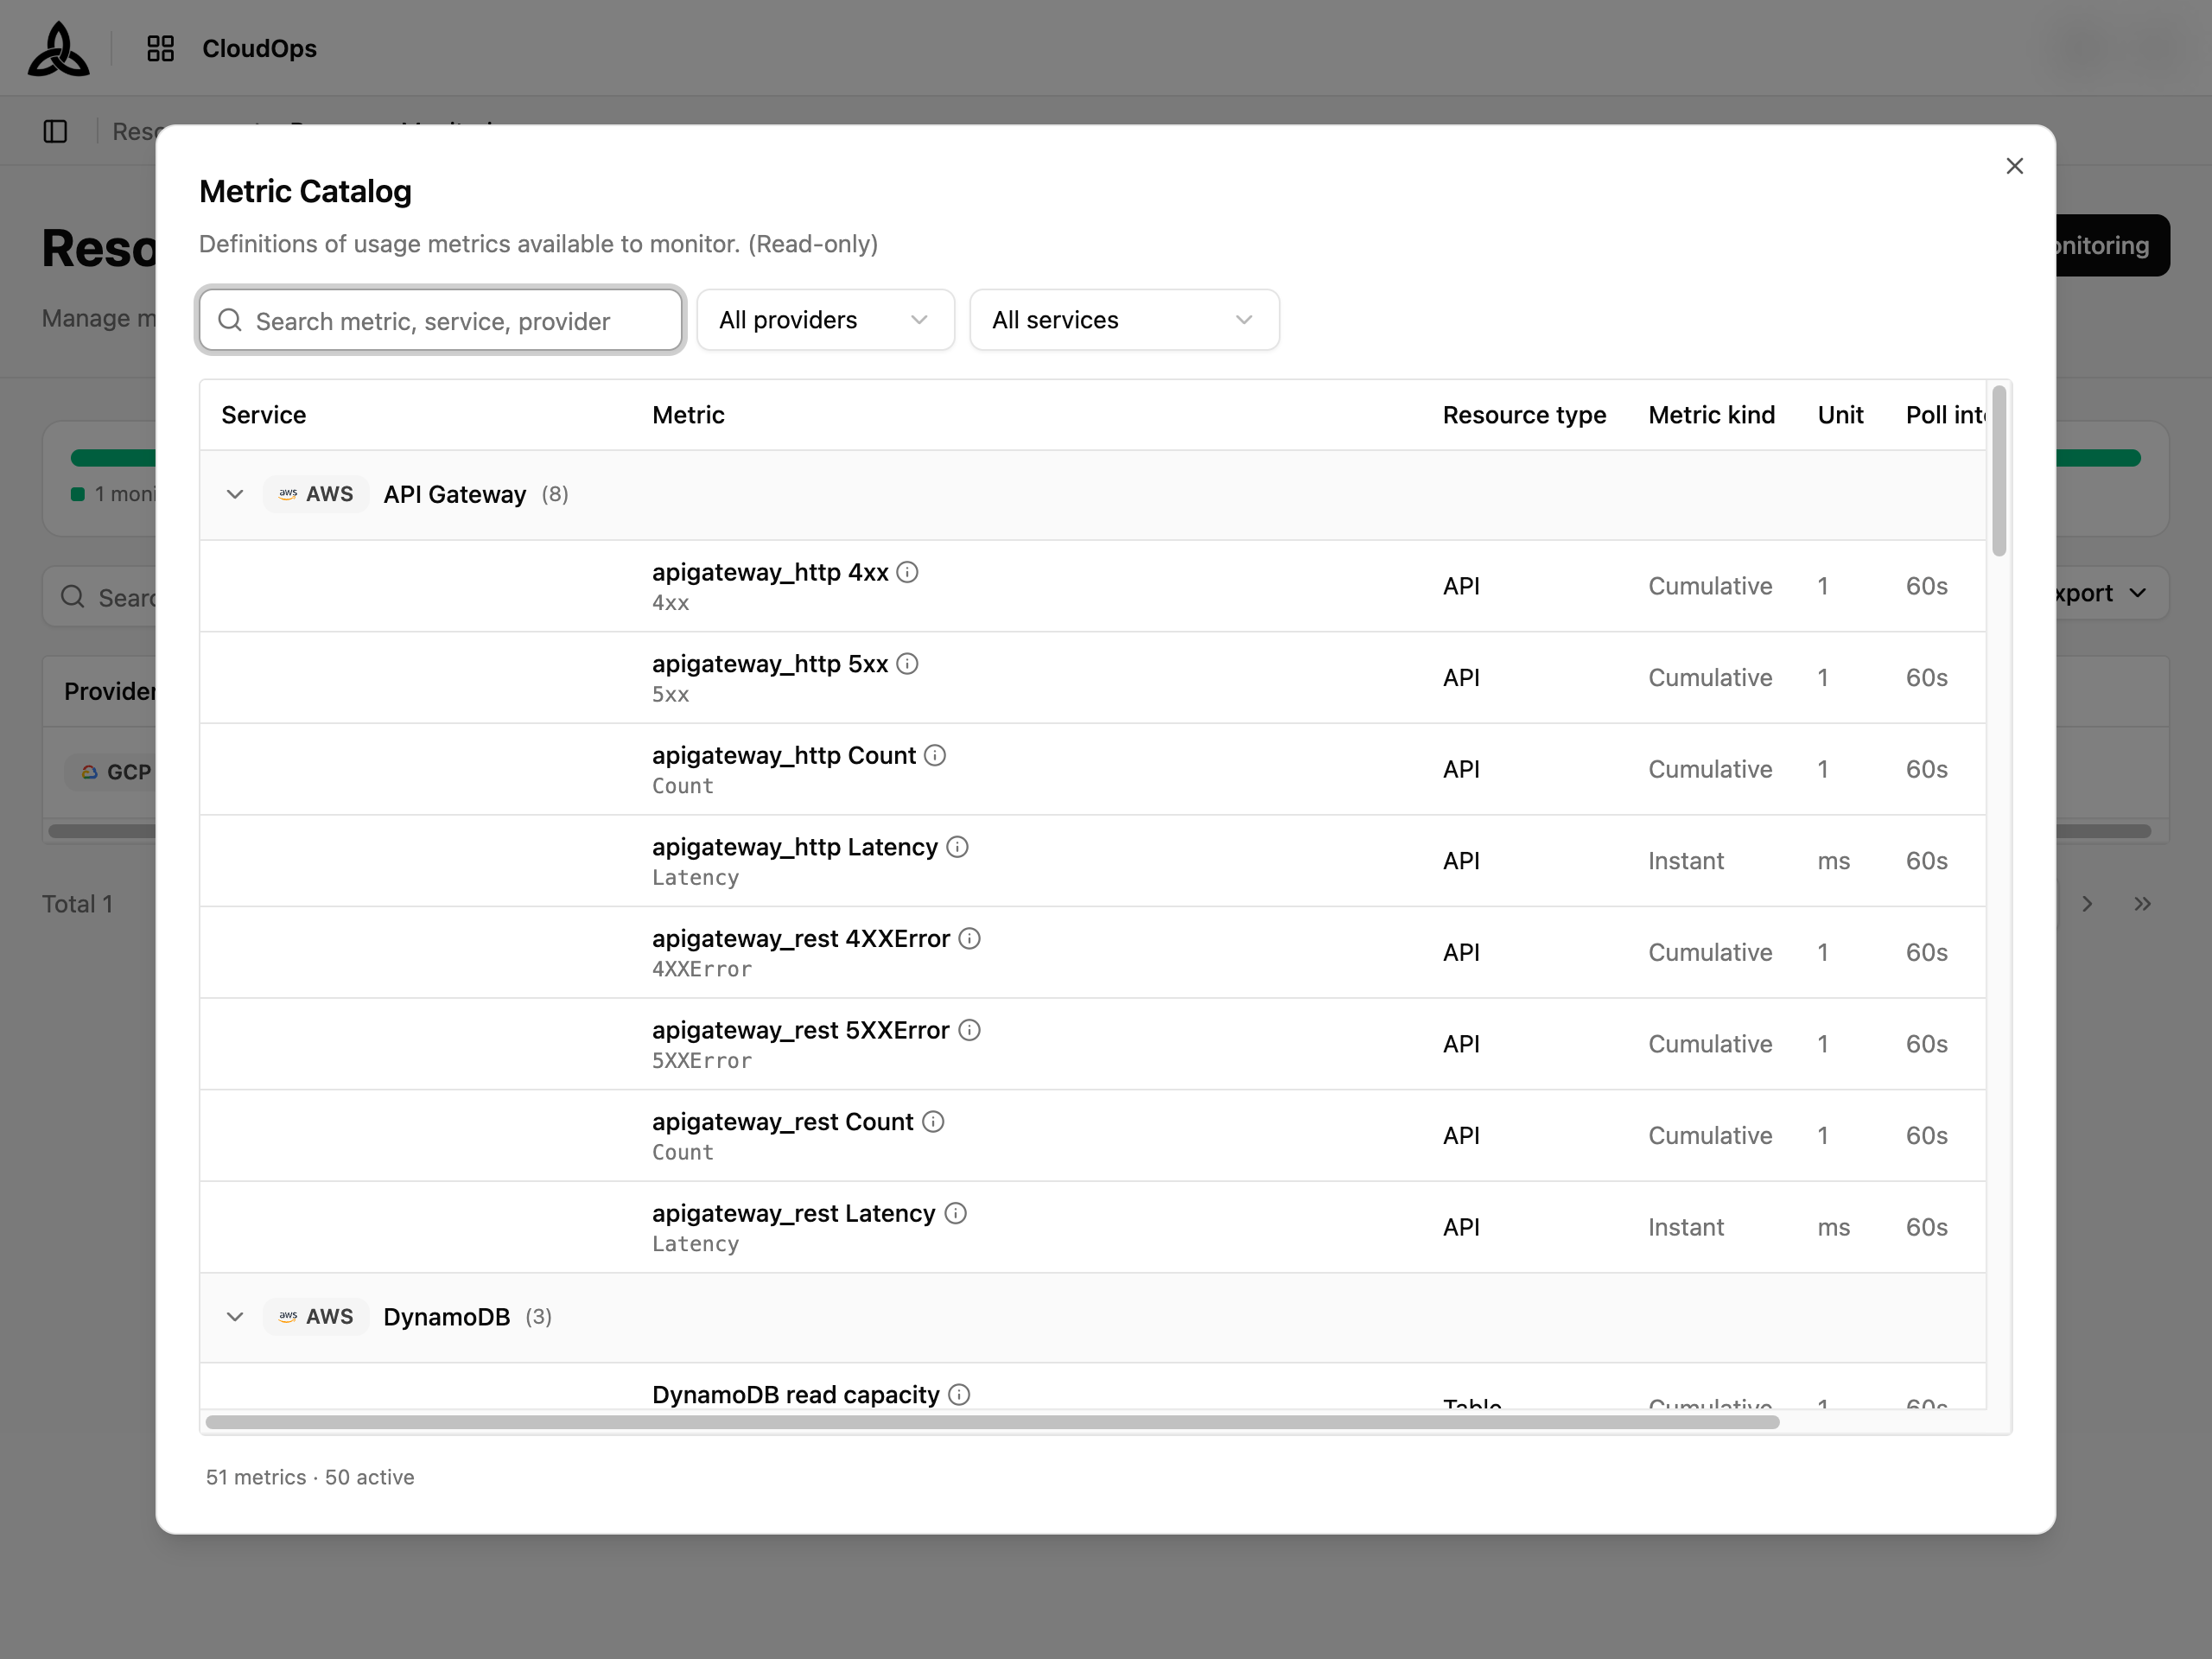
Metrics are grouped by service, each group headed by its provider badge and a count. Search covers metric, service, and provider at once, and All providers / All services narrow the list. The footer counts both what exists and what is live — 51 metrics · 50 active.
| Column | Description |
|---|---|
| Service | The service the metrics belong to — the group heading, with the provider badge |
| Metric | The metric name, with the provider’s own metric identifier beneath |
| Resource type | The resource type the metric applies to |
| Metric kind | How the value accumulates — for example Cumulative |
| Unit | The unit the value is measured in |
| Poll interval | How often CloudOps reads the metric |
| Status | Whether the metric is available |
Turning On Monitoring
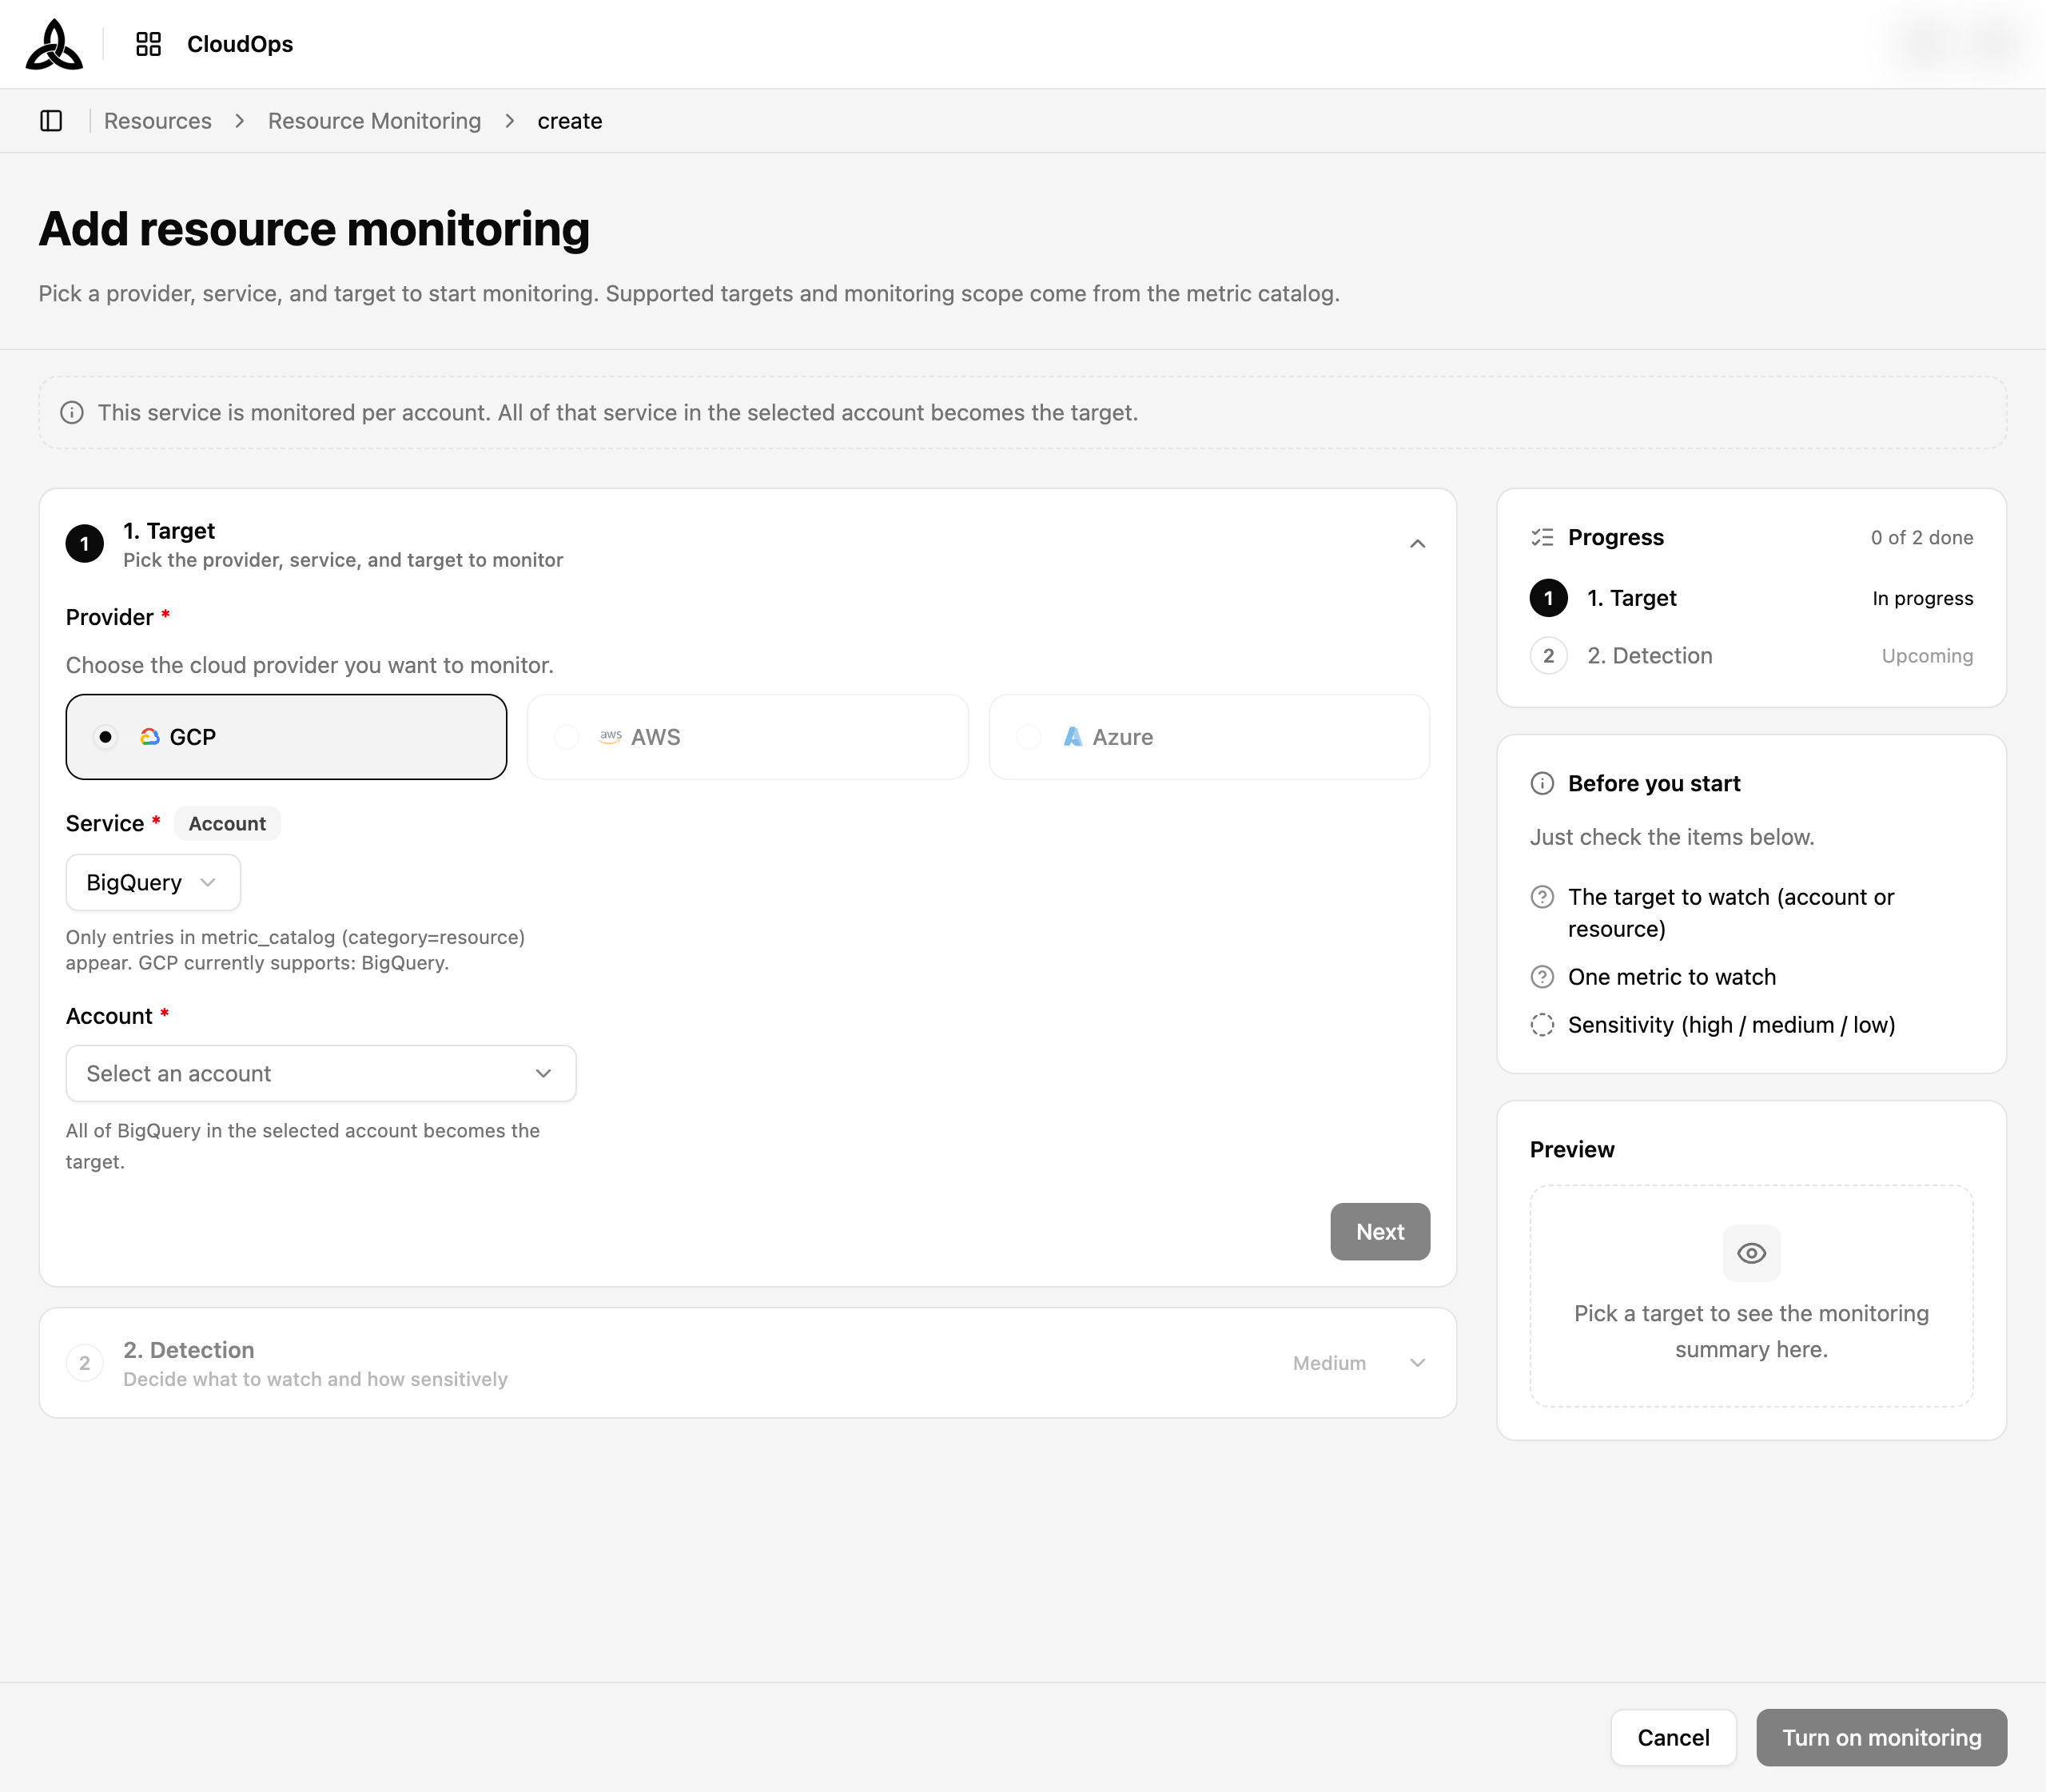
Select [Add monitoring] to open a two-step form. The panel on the right tracks progress, lists what you need to decide, and previews the result.
Choose the target
Pick the Provider, then the Service. The badge beside Service states the monitoring scope that service uses.
Depending on that scope you then pick either an Account or a specific resource. For an account-scoped service such as BigQuery, all of that service in the selected account becomes the target — you are not choosing one dataset.
Set the detection
Choose the metric to watch and how sensitively — high, medium, or low.
A metric is required. Monitoring cannot be turned on without one, so this step is not skippable — there is no “watch everything” default.
The list offers only the metrics this particular resource can actually emit, matched from the catalog against the target you picked, and only those anomaly detection can work with. A metric that exists in the catalog but cannot be evaluated for anomalies is not offered here.
Turn it on
Select [Turn on monitoring]. The new target appears in the list and detection starts.
Scope is a property of the service, not a choice you make. Some services are monitored per account and some per individual resource; the metric catalog decides which. The form tells you which one applies before you pick a target, and a resource-scoped target states the scope it covers on its own row rather than leaving you to infer it.
Where a service groups several resource types under one name, the catalog resolves them within that provider — RDS instances and Aurora databases, for example, are distinct targets rather than one lumped entry.
Target Detail
Selecting a row opens the target’s detail page. The header repeats the provider and the monitoring scope, and carries the switch that turns monitoring off.
Summary
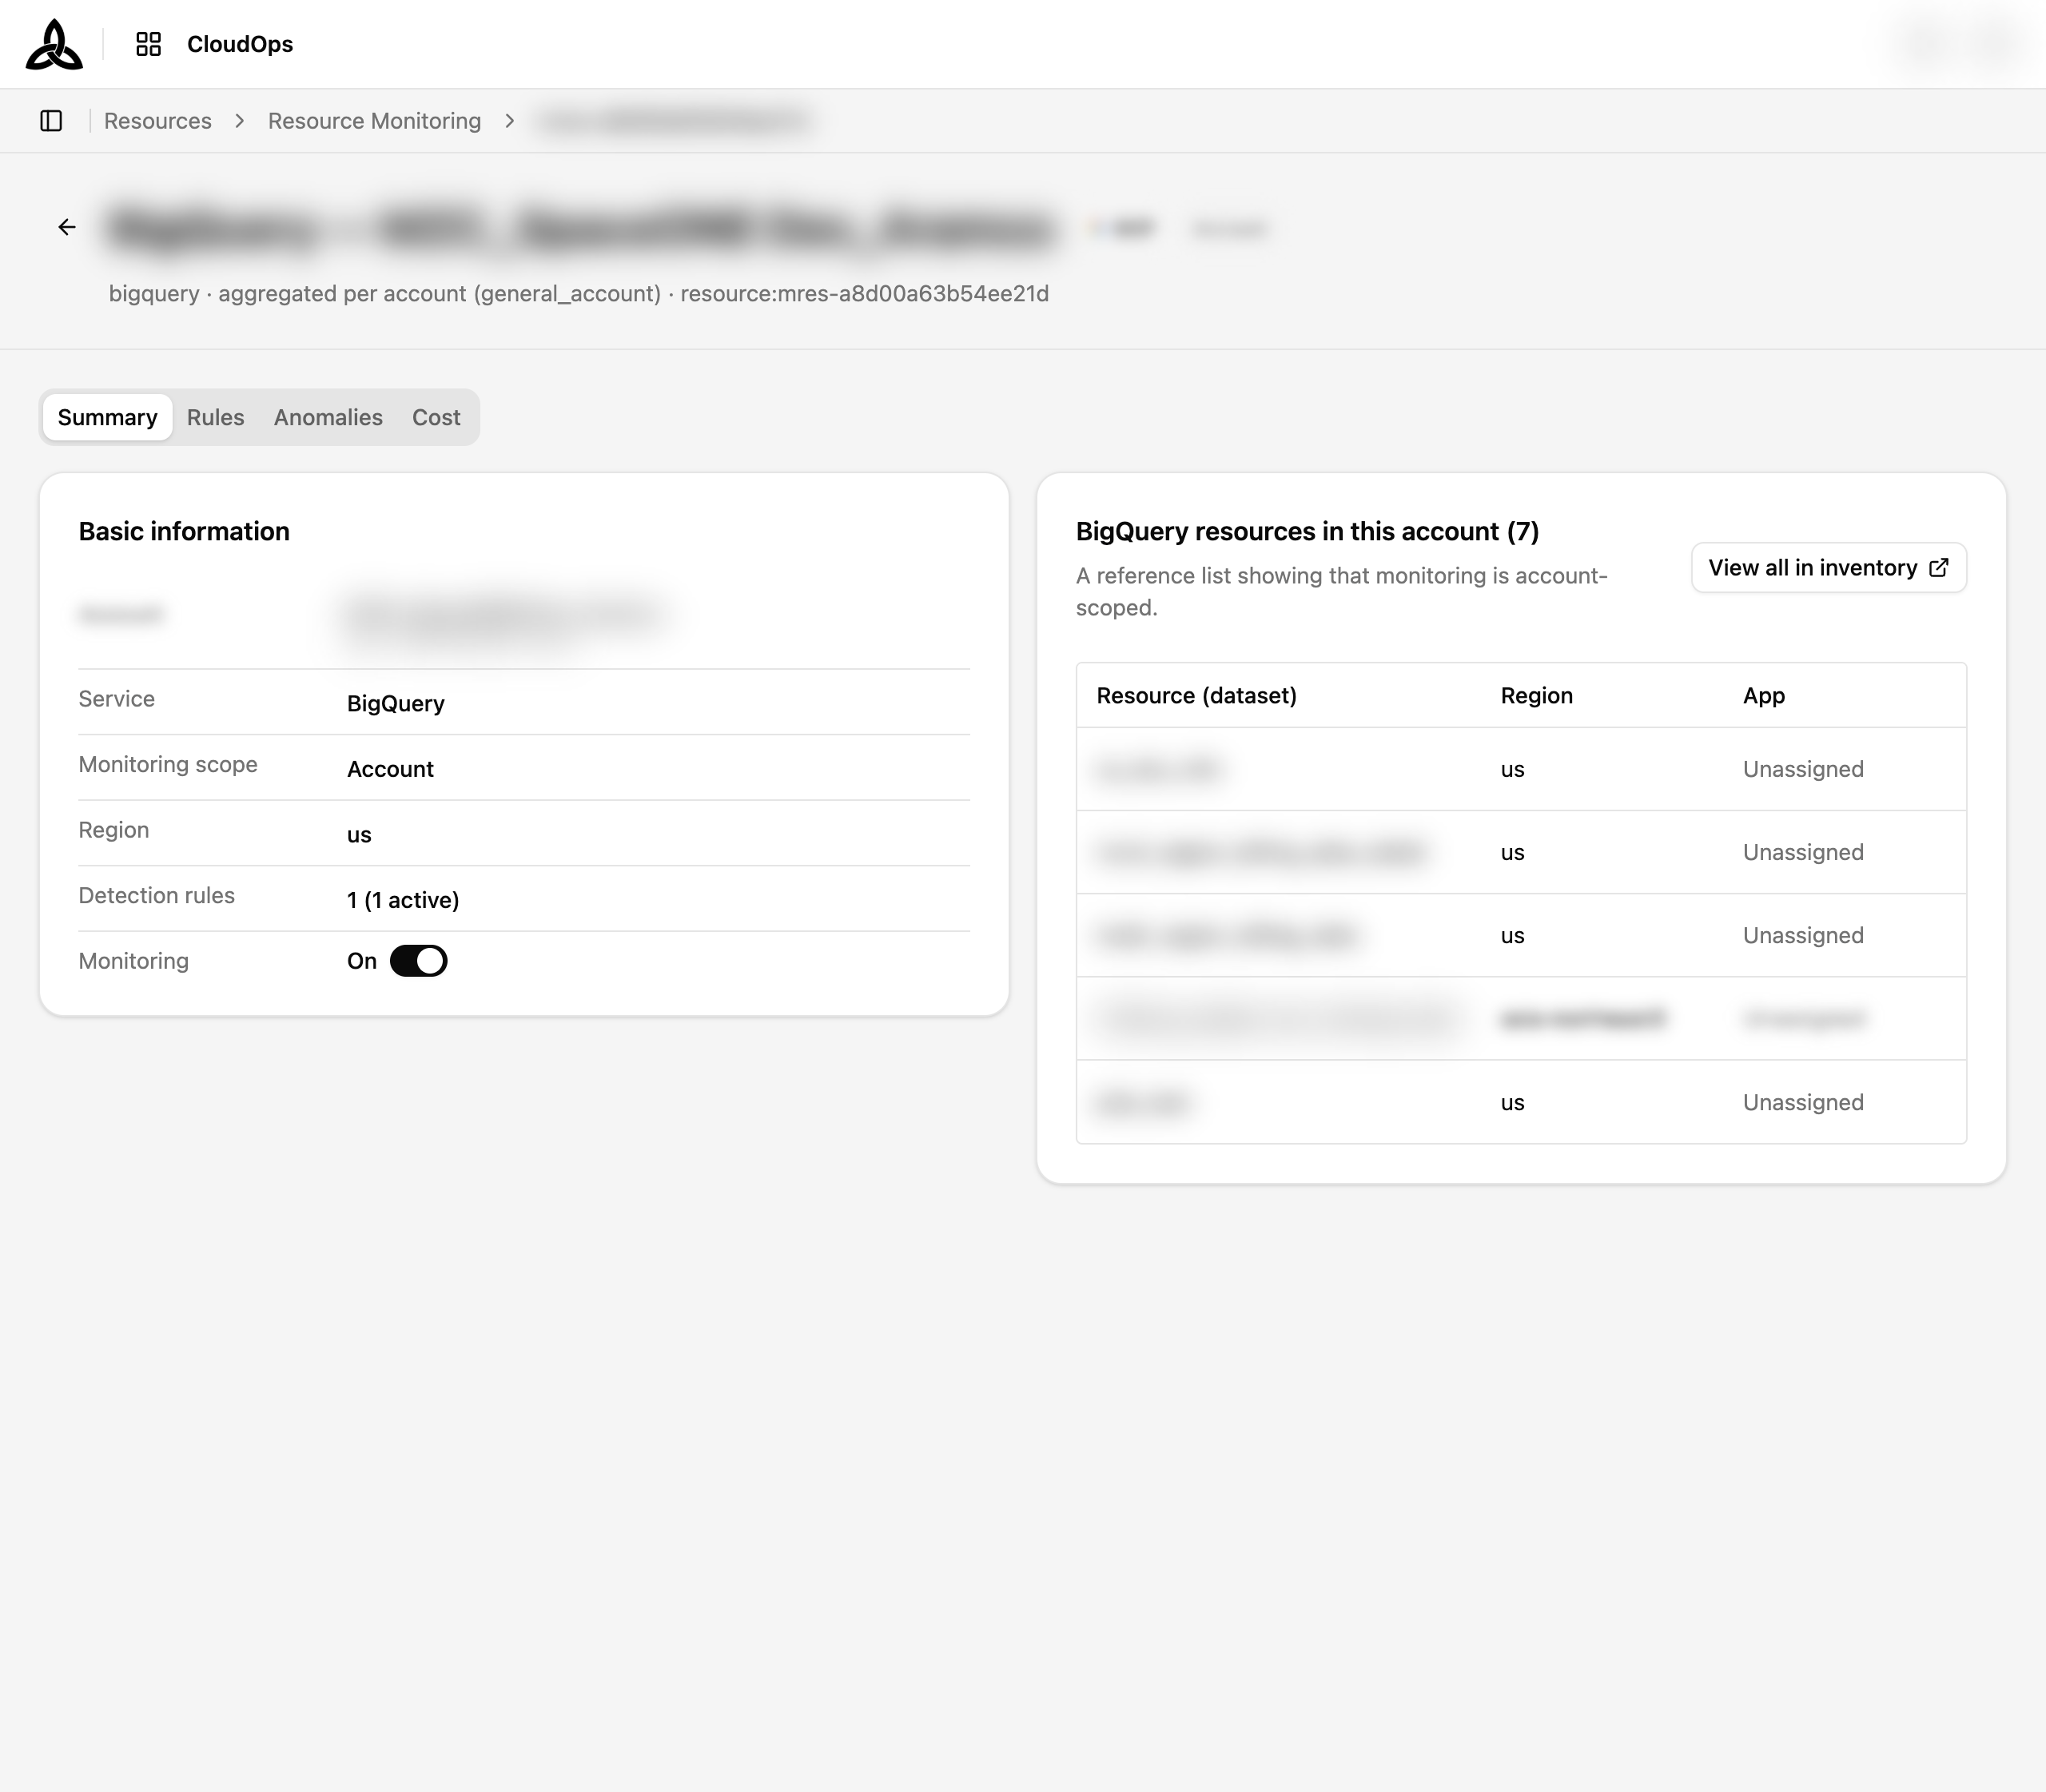
Basic information states the account, service, monitoring scope, region, how many detection rules exist, and whether monitoring is on.
The card beside it lists the resources of that service in the account. It is a reference list, there to make the scope concrete — with account-scoped monitoring, every one of those resources is covered. [View all in inventory] opens the same set in Resource Inventory.
Rules
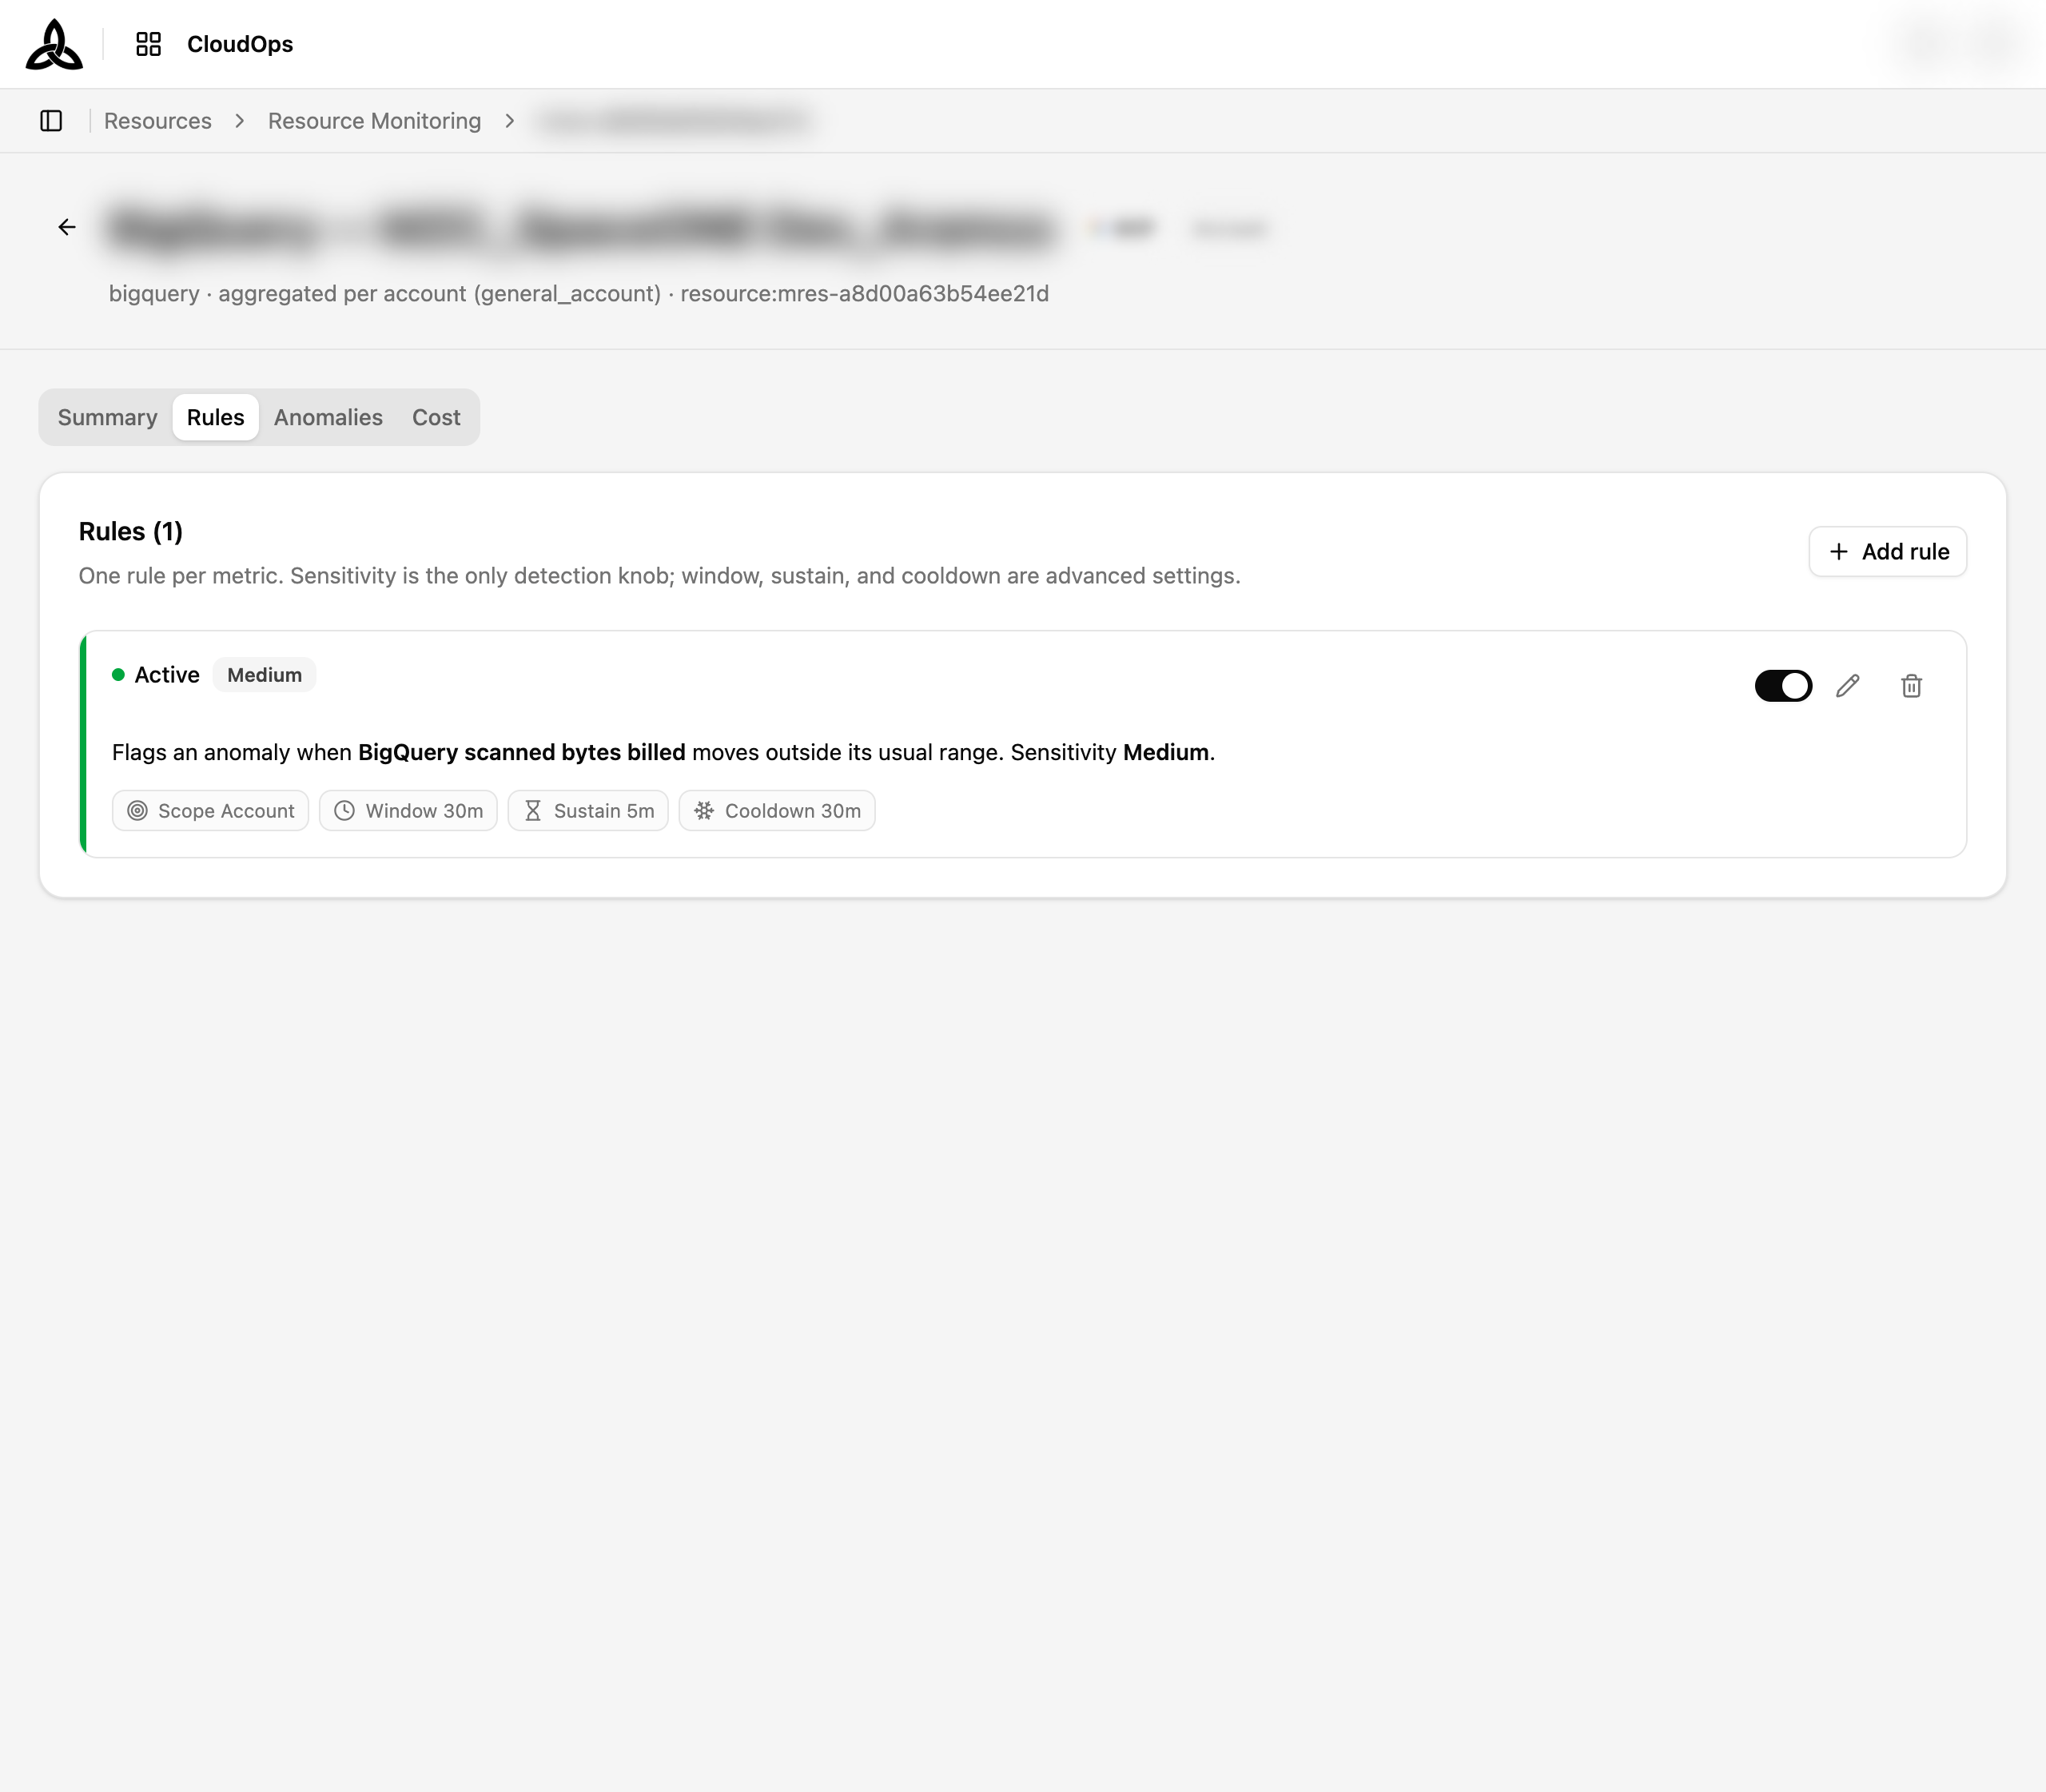
Each rule watches one metric, and each rule states in a sentence what it flags. Sensitivity is the only setting you normally touch.
| Setting | Meaning |
|---|---|
| Sensitivity | How far outside the usual range a value has to move — high, medium, or low |
| Window | The span of time the value is judged over |
| Sustain | How long the value has to stay out of range before it counts |
| Cooldown | How long to wait after firing before the rule can fire again |
Each rule can be switched off, edited, or deleted from its own row, and [+ Add rule] adds another metric to watch.
Anomalies
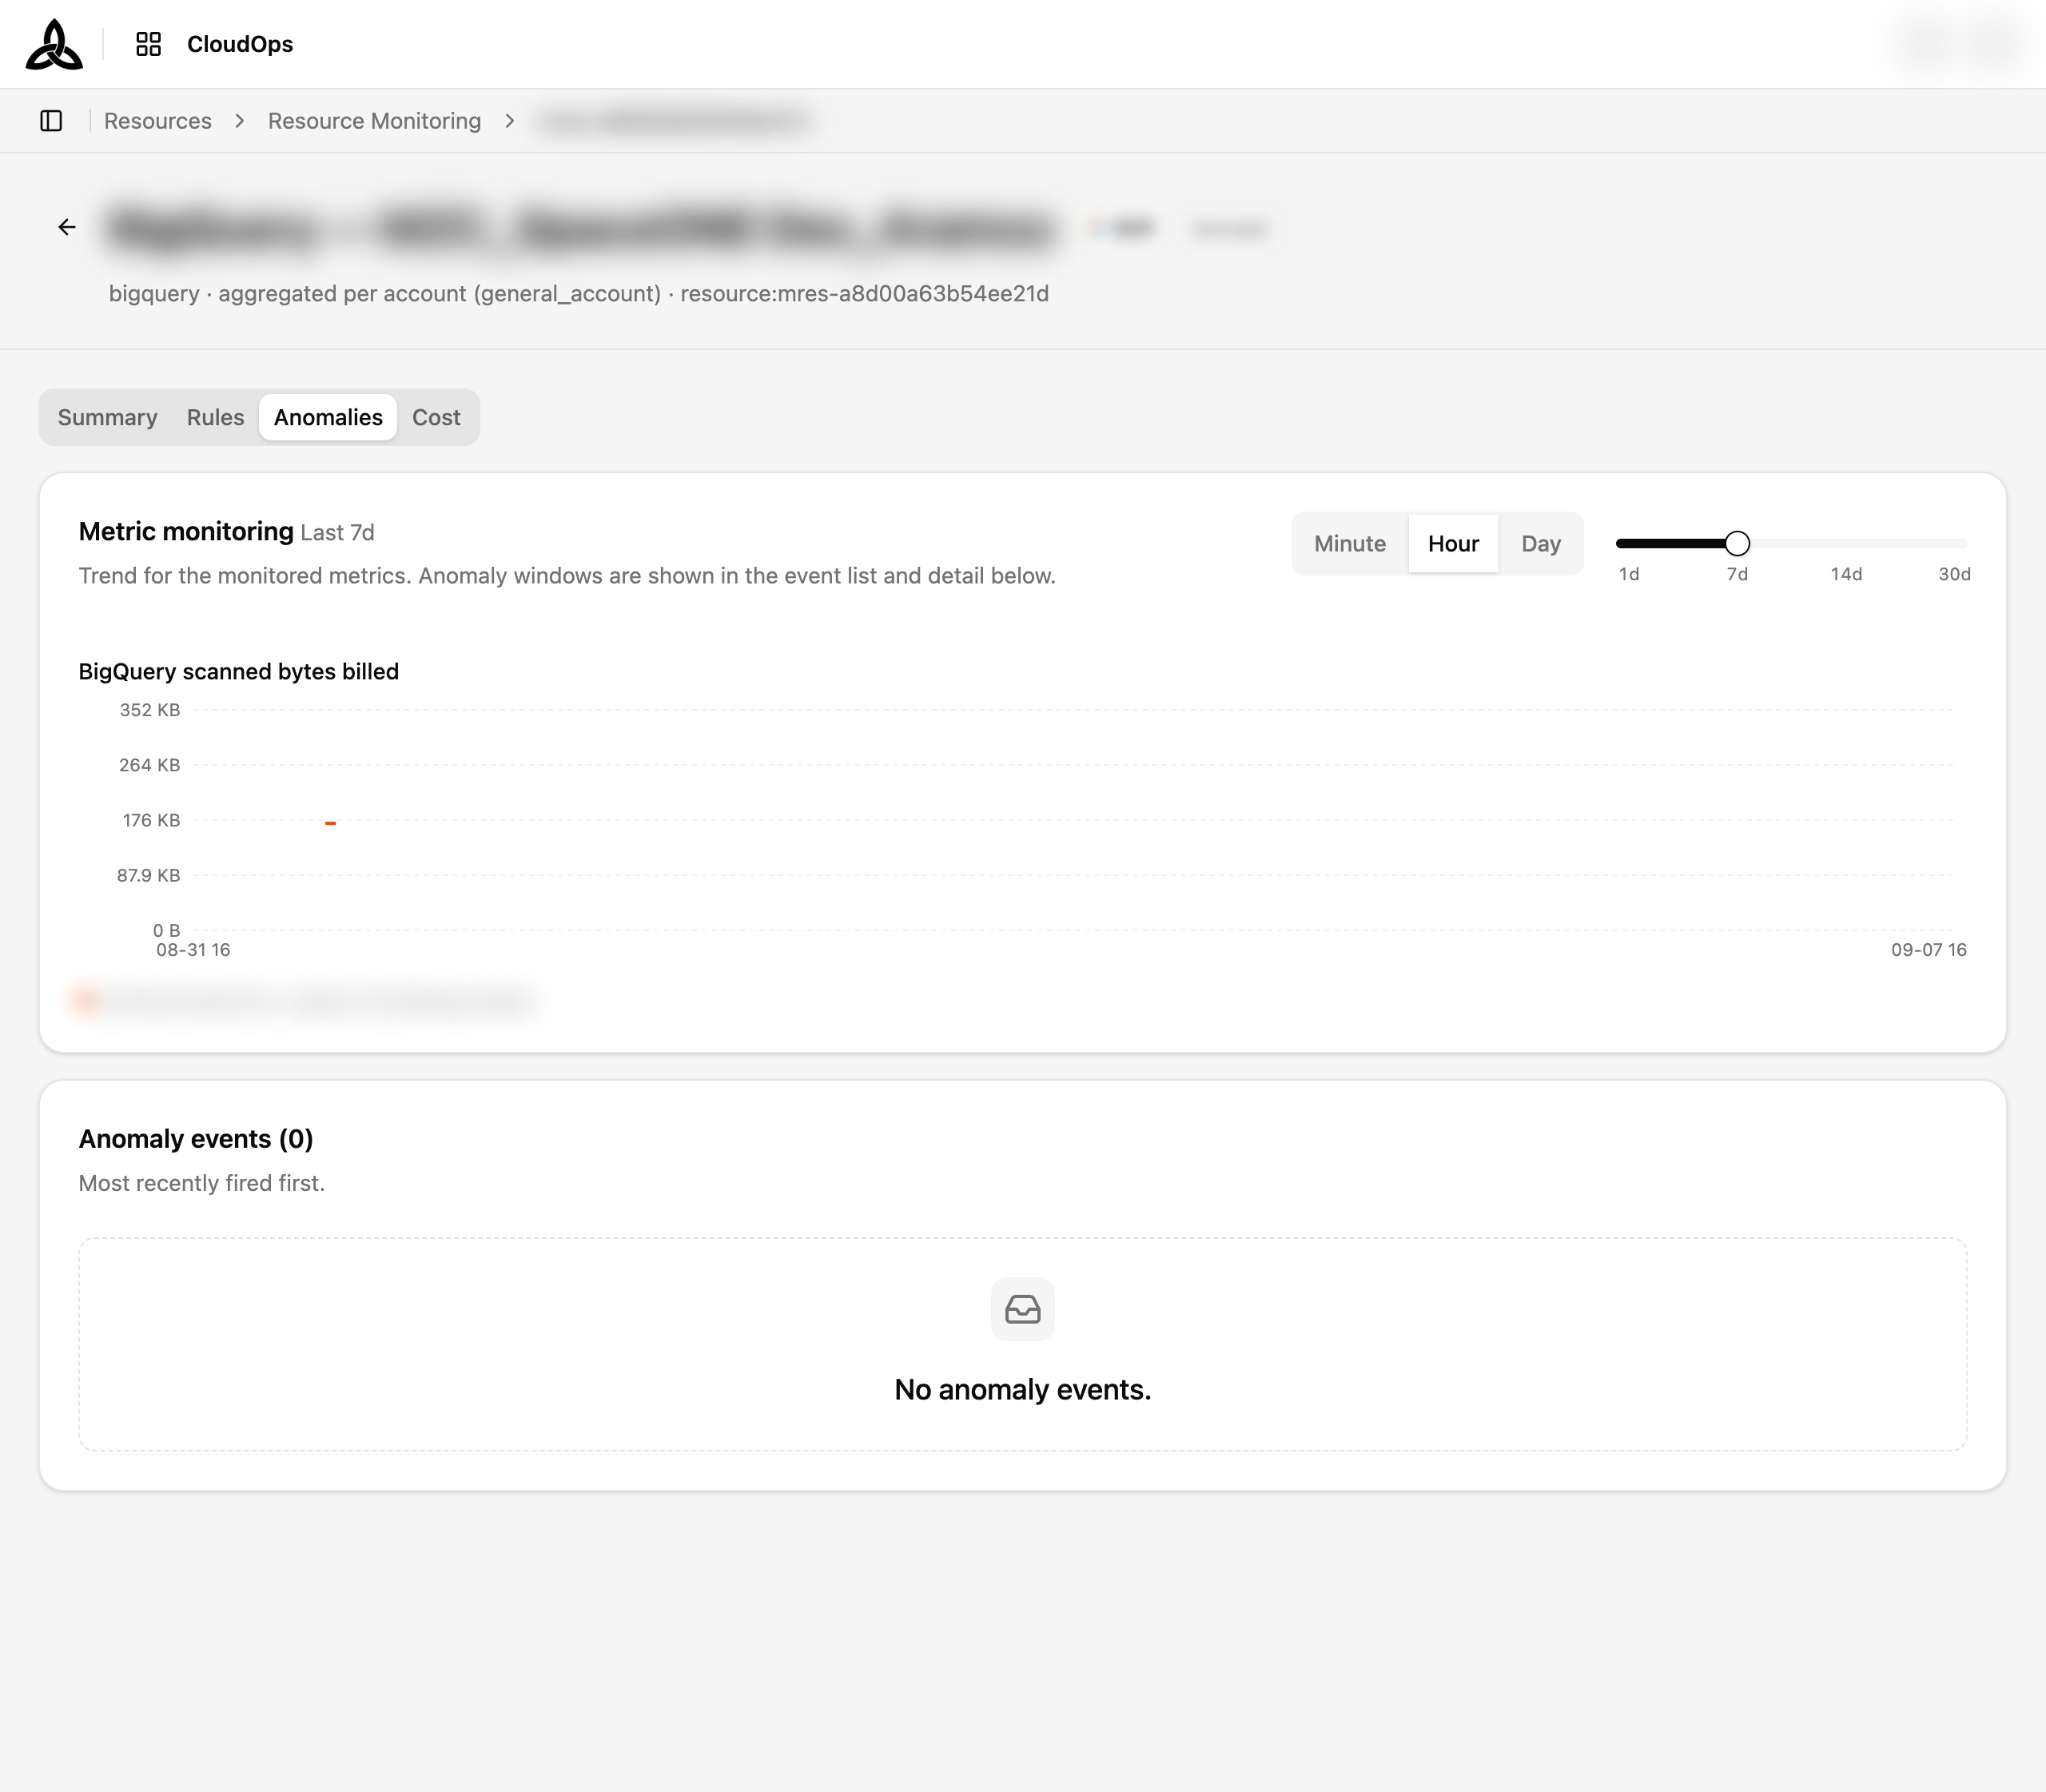
Metric monitoring charts the metrics being watched. Choose the bucket size — Minute, Hour, or Day — and drag the slider to change the range between 1d, 7d, 14d, and 30d. Each series is drawn separately and named by the provider labels it came from.
Anomaly events lists what actually fired, most recent first. Windows judged anomalous are marked on the chart above so you can see the event in its context rather than as a row on its own.
Cost
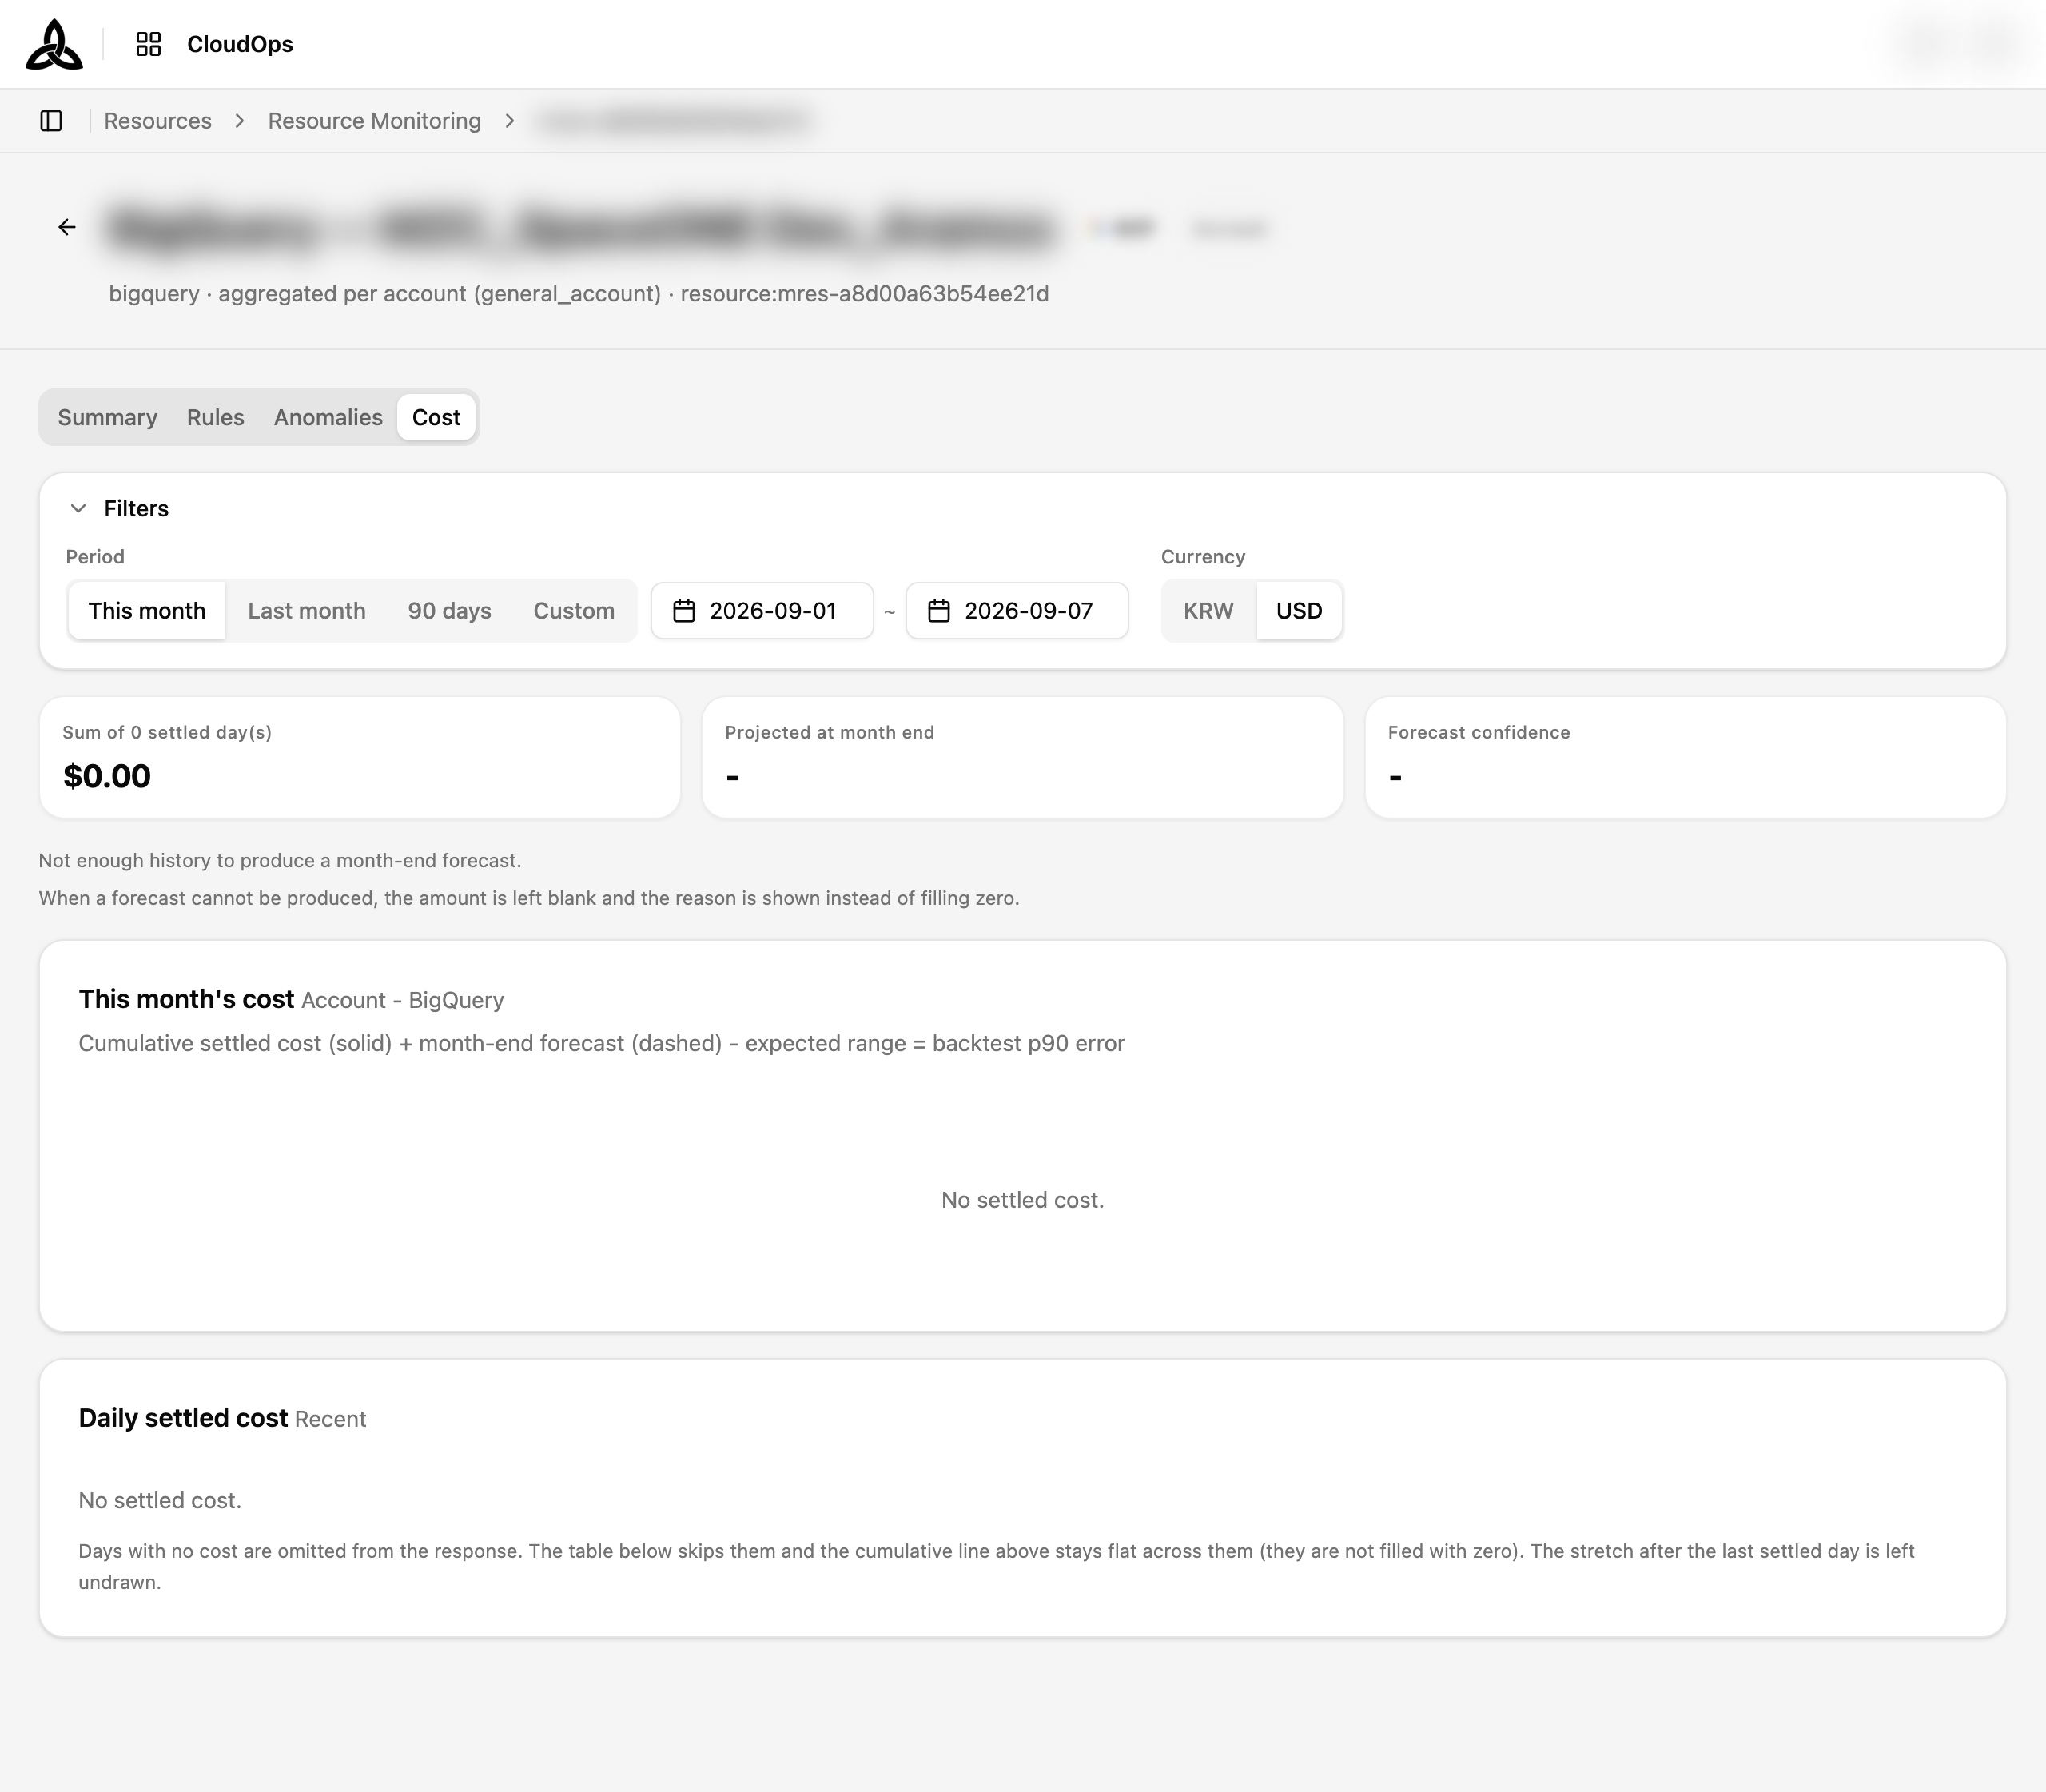
The Cost tab answers what the monitored target is spending.
| Filter | Description |
|---|---|
| Period | This month, Last month, 90 days, or Custom with your own start and end dates |
| Currency | Show the amounts in KRW or USD |
Three figures sit above the chart — the sum of the settled days so far, the projected month-end total, and a forecast confidence.
This month’s cost draws the cumulative settled cost as a solid line and continues it to month end as a dashed forecast, with an expected range around it. Daily settled cost lists the same days underneath.
Turning Monitoring Off
The switch in the Monitoring column, and the one in the detail header, stop detection for that target while keeping it in the list with its rules intact. Turn it back on and detection resumes.
Supported Targets
Monitoring covers the services registered in the metric catalog, and that set grows over time. As of this release it includes GCP BigQuery and, newly, AWS EC2 and AWS RDS.
The catalog is the authoritative list — open [Metric Catalog] from the page header to see what is currently available rather than relying on a list written here.
Related
The resources being watched are collected through Cloud Account and listed in Resource Inventory. Anomalies raised on AI assets are handled separately, under AI Monitoring.