Webhook Management
On the [Plugin & Integration Hub > Webhook Management] page, you can create inbound webhooks that receive events from external monitoring and security tools and turn them into CloudOps tickets.
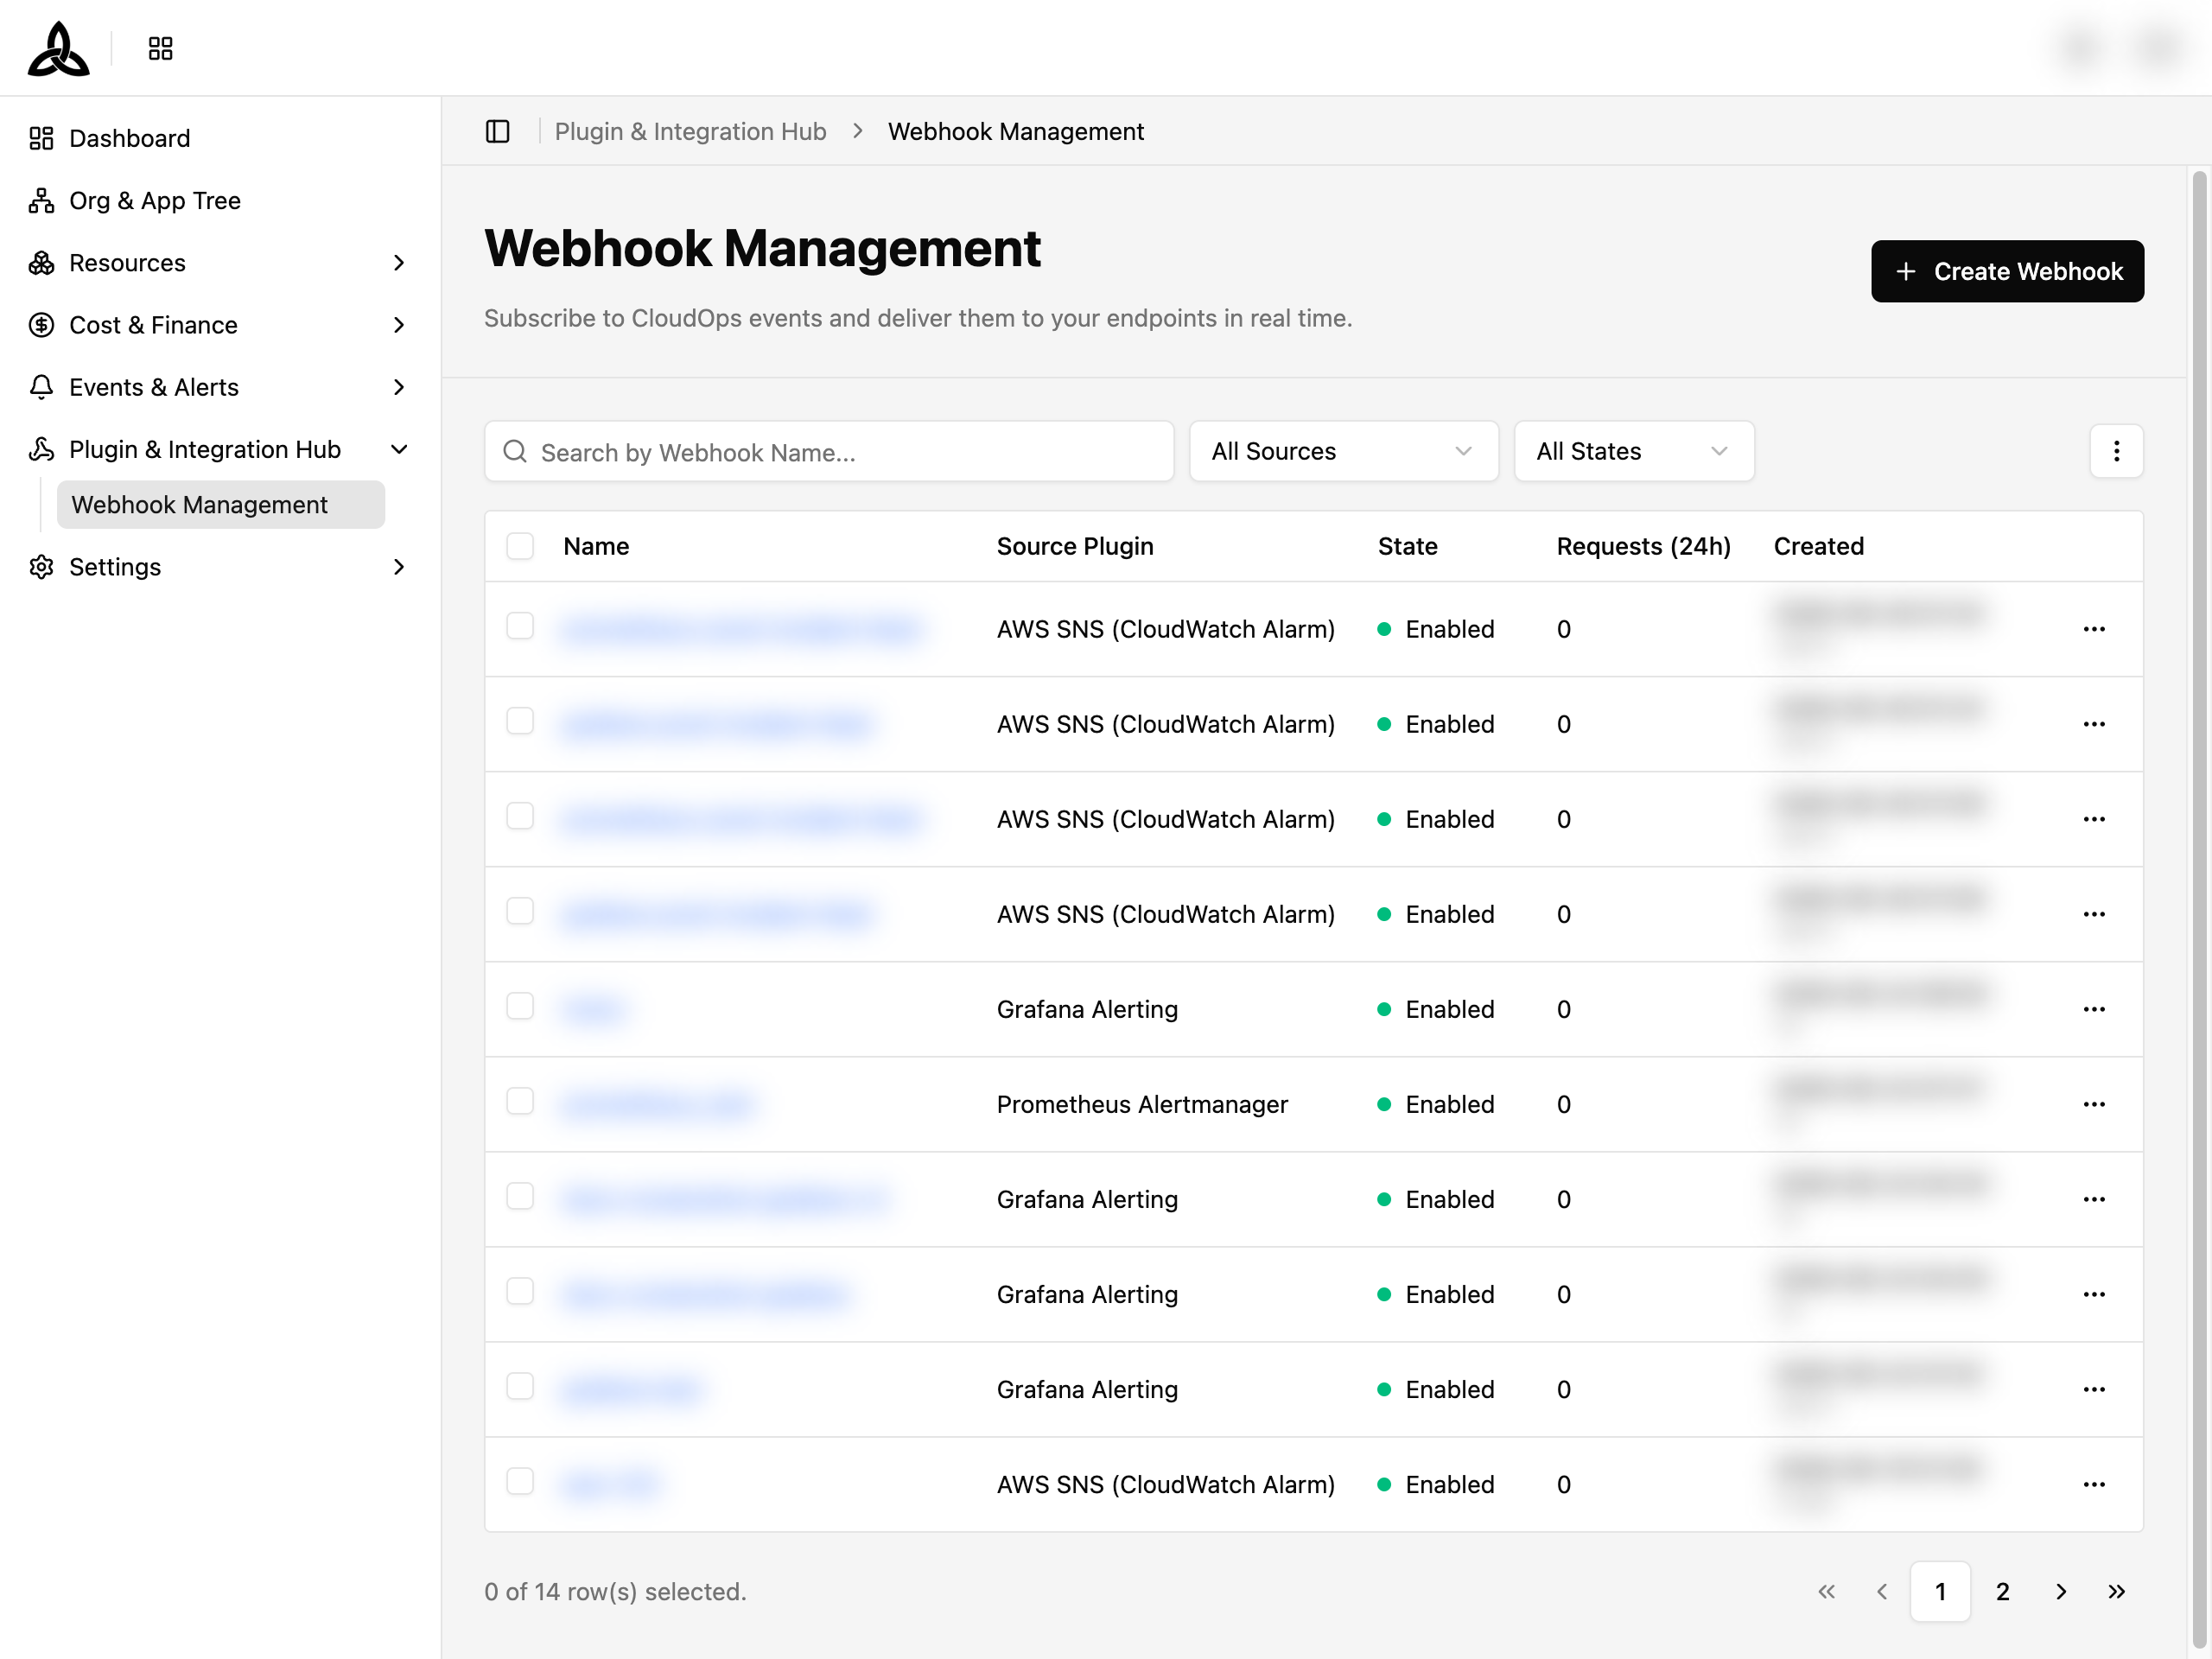
Supported sources
A webhook is always tied to one source plugin, which decides how the incoming payload is understood.
| Source plugin | Receives |
|---|---|
| CloudWatch Alarm (via SNS) | CloudWatch alarms delivered through an SNS topic subscription |
| AWS Health (via EventBridge) | AWS Health events delivered through EventBridge |
| Grafana Alerting | Grafana unified alerting webhook events |
| Prometheus Alertmanager | Prometheus Alertmanager webhook events |
| HALO Security Alert | OCSF-format security events detected by HALO security rules |
For the setup required on the sending side of the monitoring sources, see the Monitoring & Alerting Integrations guides.
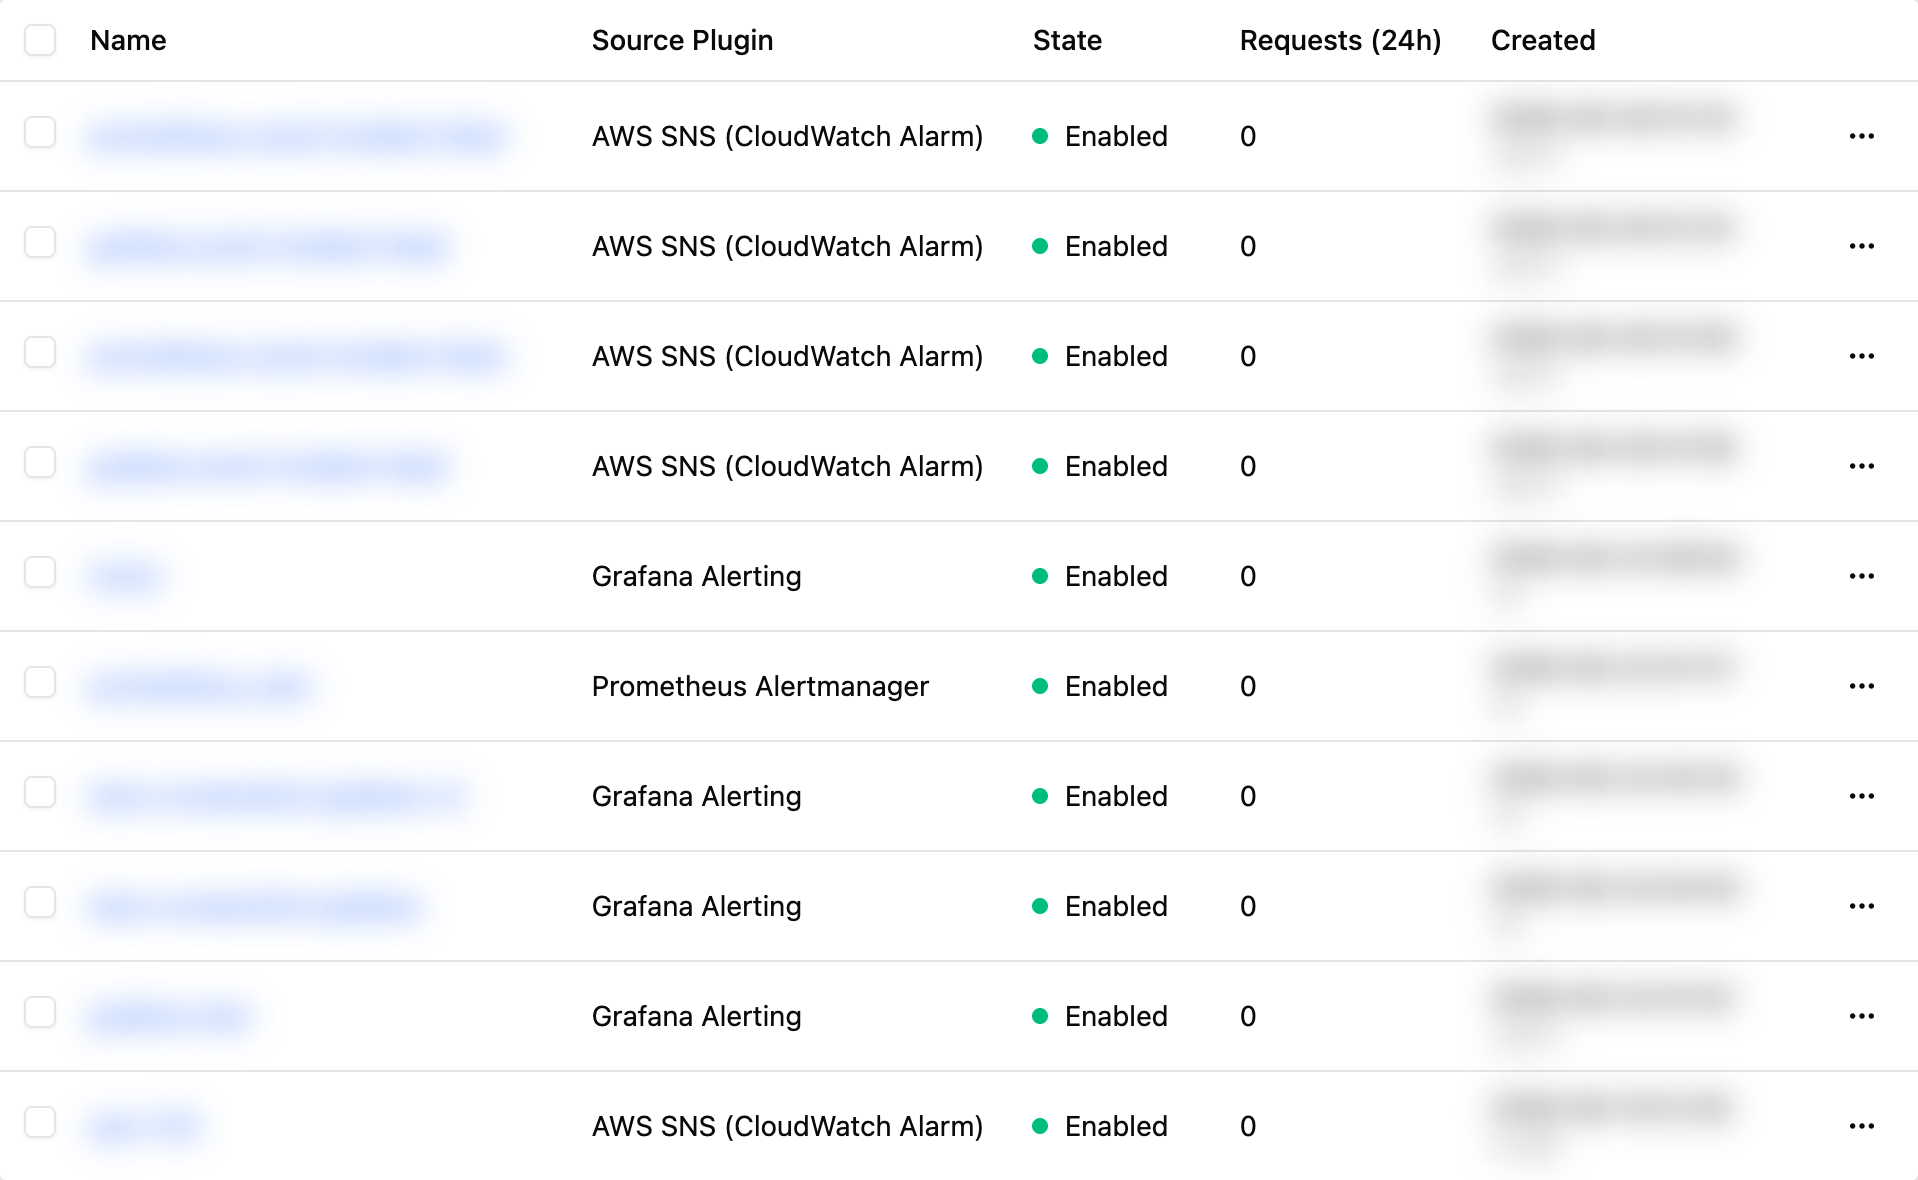
Webhook List
| Column | Description |
|---|---|
| Name | The webhook name. Click it to open the detail page. Pinned to the left by default, so it stays visible while you scroll horizontally |
| Source Plugin | Which plugin normalizes the incoming events |
| State | Enabled or Disabled |
| Requests (24h) | How many requests arrived in the last 24 hours |
| Created | When the webhook was created |
| ⋯ | Row actions for this webhook |
Toolbar

| UI element | Description |
|---|---|
| Search by Webhook Name… | Search webhooks by name |
| All Sources | Filter by source plugin |
| All States | Filter by Enabled / Disabled |
| ⋮ | Set Display (rows per page, column visibility, order, and pinning) and Refresh |
| Export | Download the current list as an Excel or CSV file |
Set Display
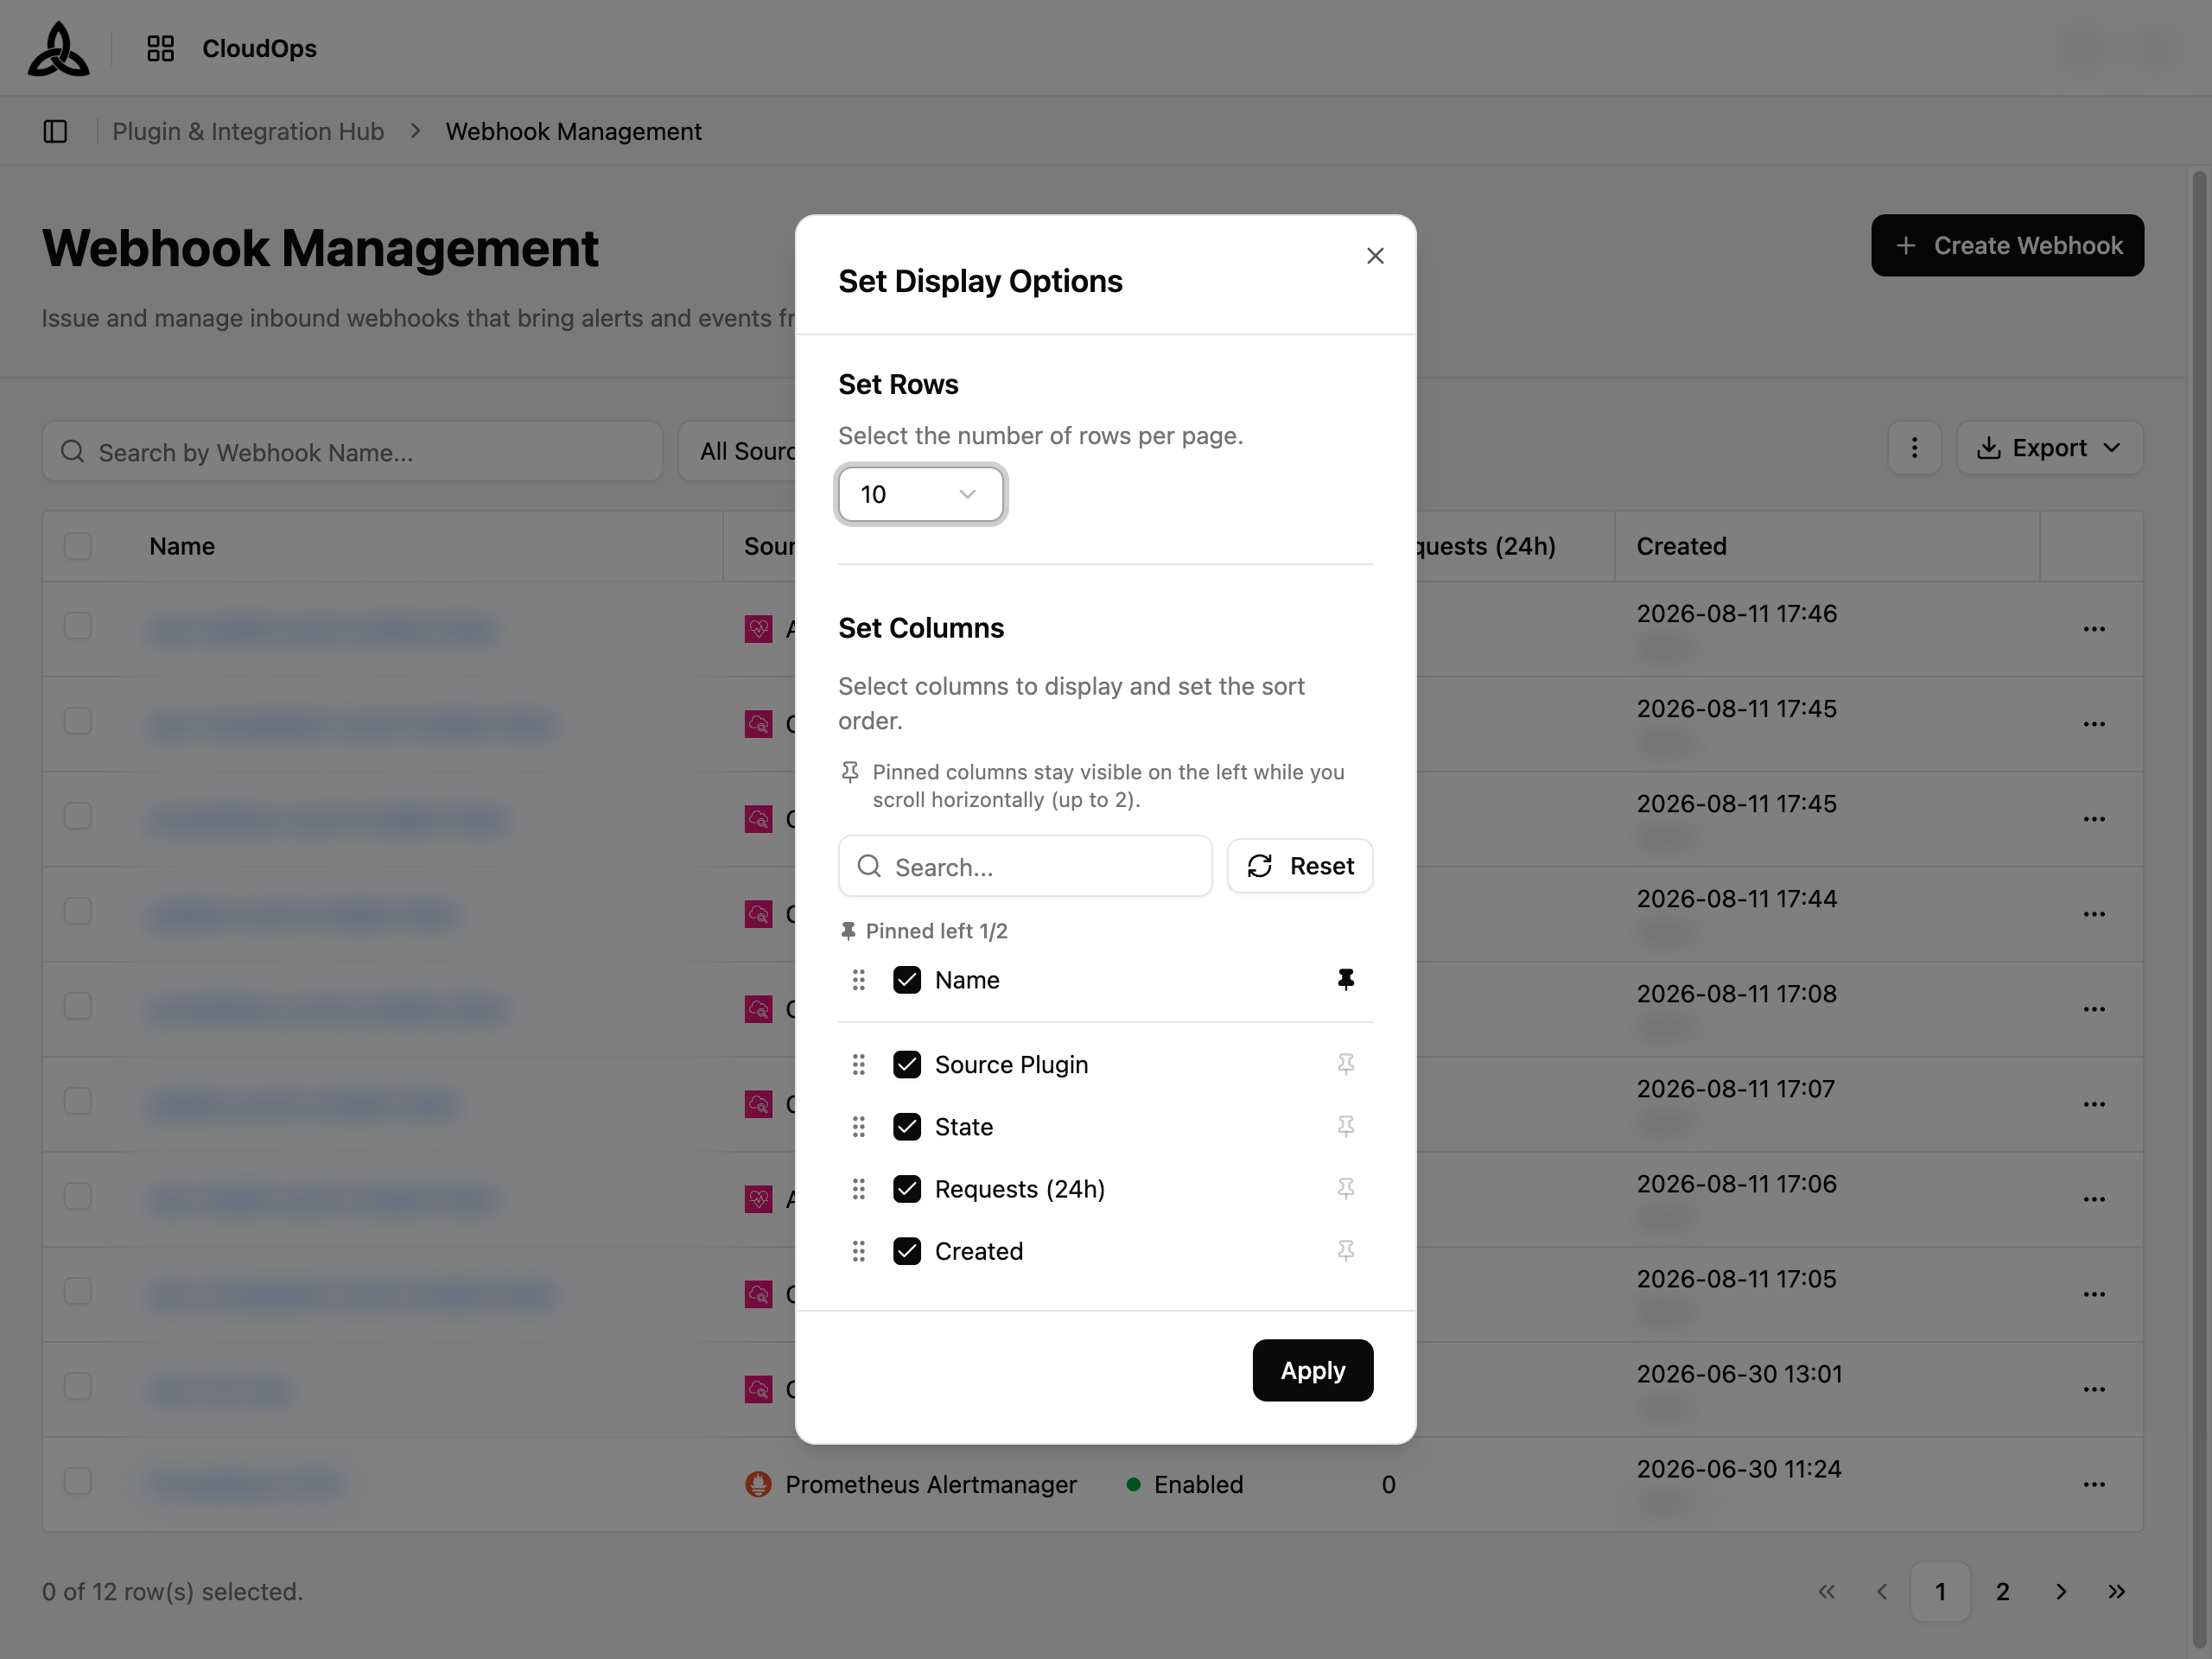
Open ⋮ > Set Display to change how the table is laid out. The settings are kept in your browser, so they survive a page reload.
| Section | What you can change |
|---|---|
| Set Rows | The number of rows per page |
| Set Columns | Tick a column to show or hide it, drag the handle to reorder, and use the pin icon to pin it to the left |
Pinned columns stay visible on the left while you scroll horizontally. Name is pinned by default; you can pin up to 2 columns, and a hidden column cannot be pinned. Reset restores the default layout.
Exporting the list
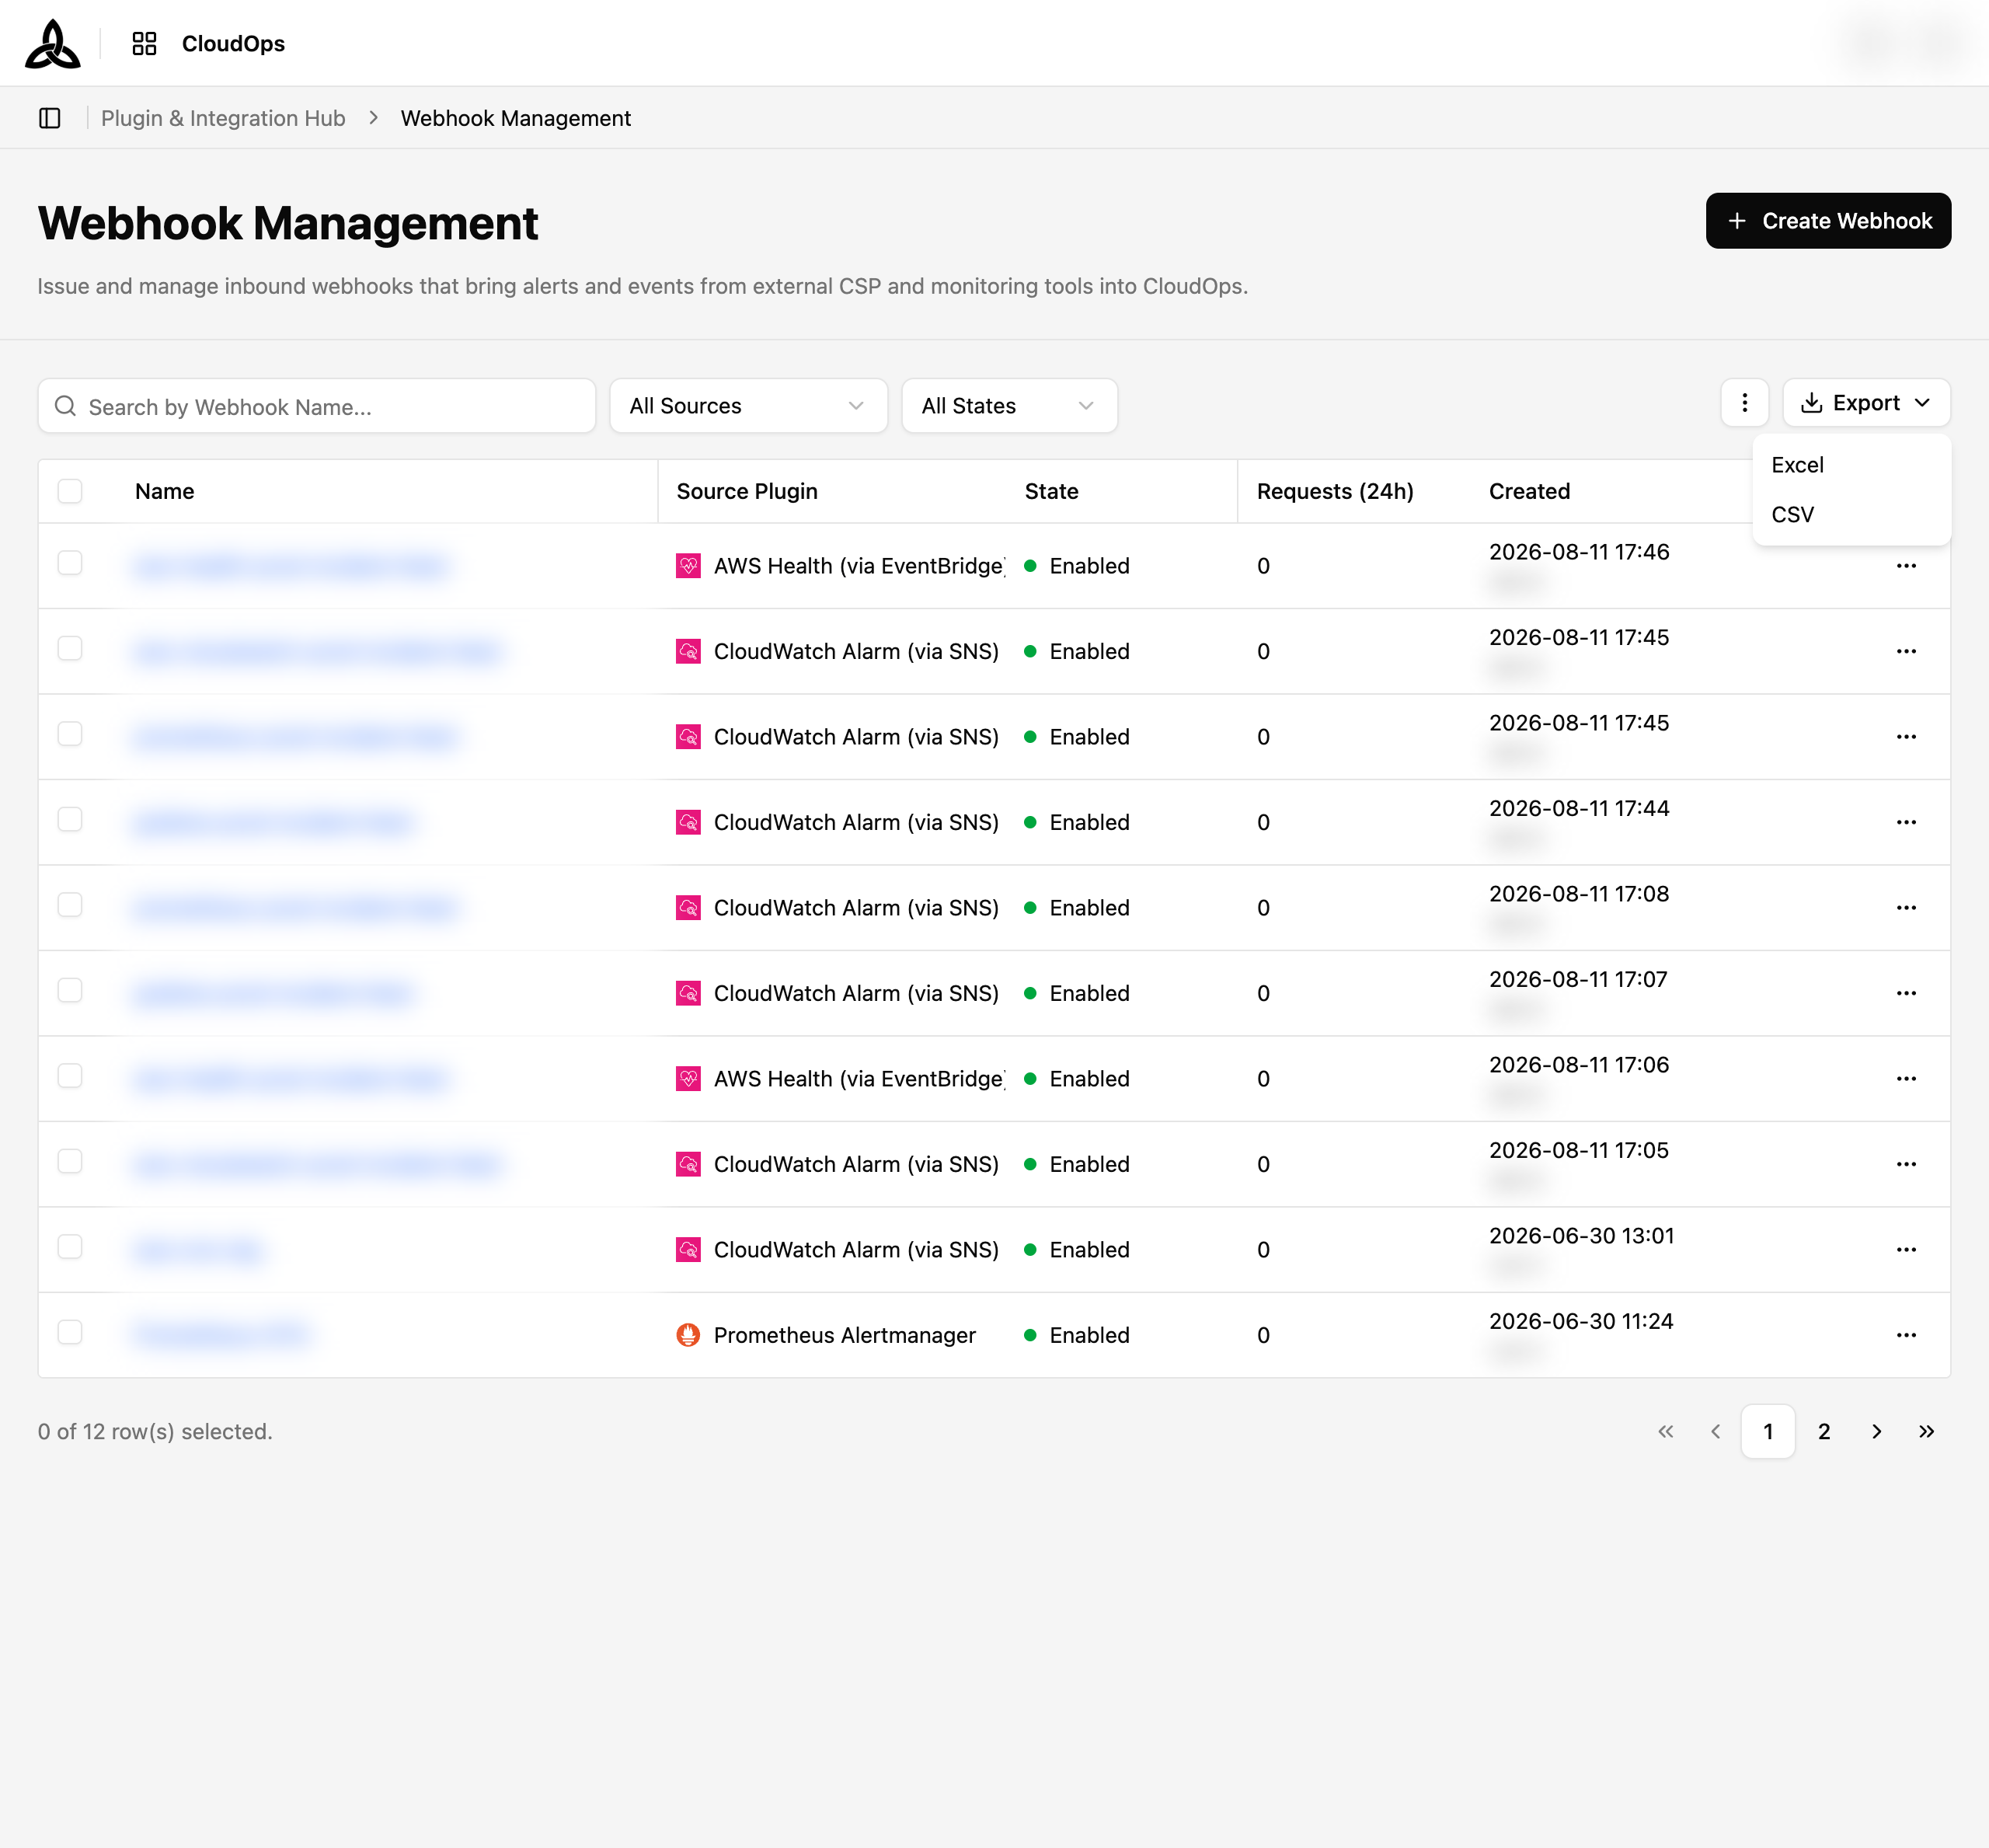
Click Export in the toolbar and choose Excel or CSV. The file is built from the list as you see it — the current search and the All Sources / All States filters are applied, and it contains the columns that are visible in Set Display, in the same order. The download starts automatically when the file is ready.
Row actions and bulk selection
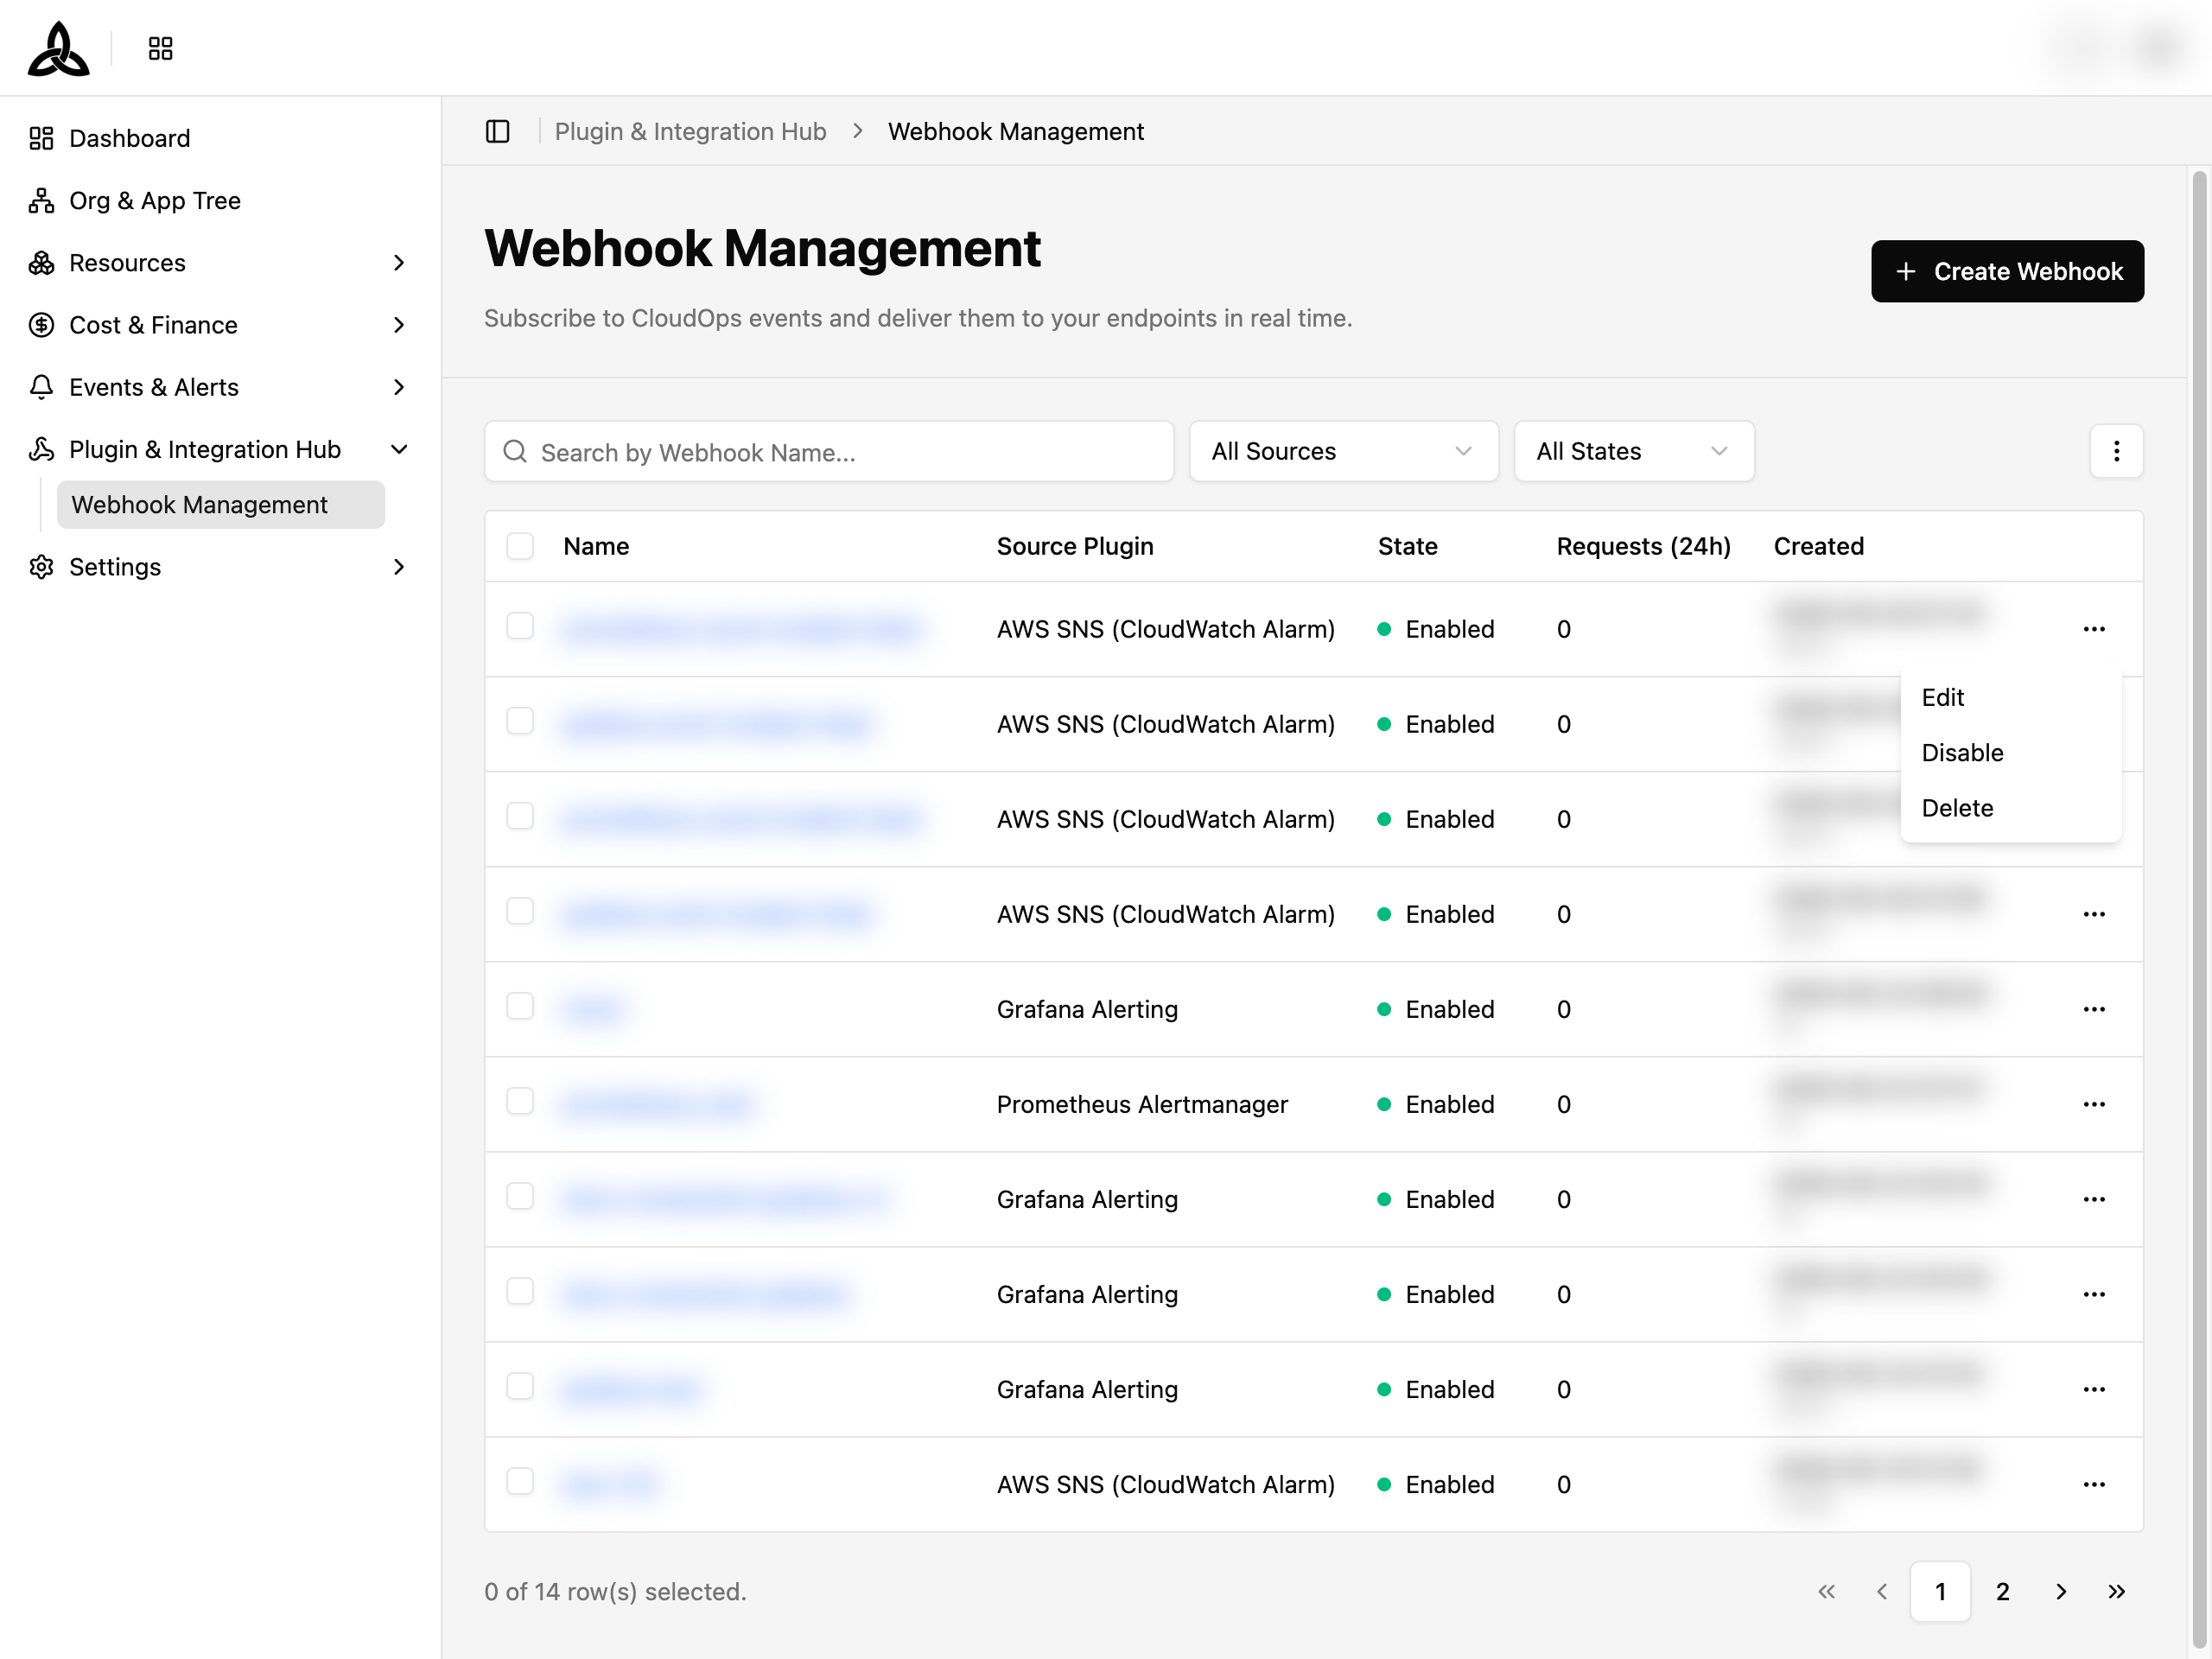
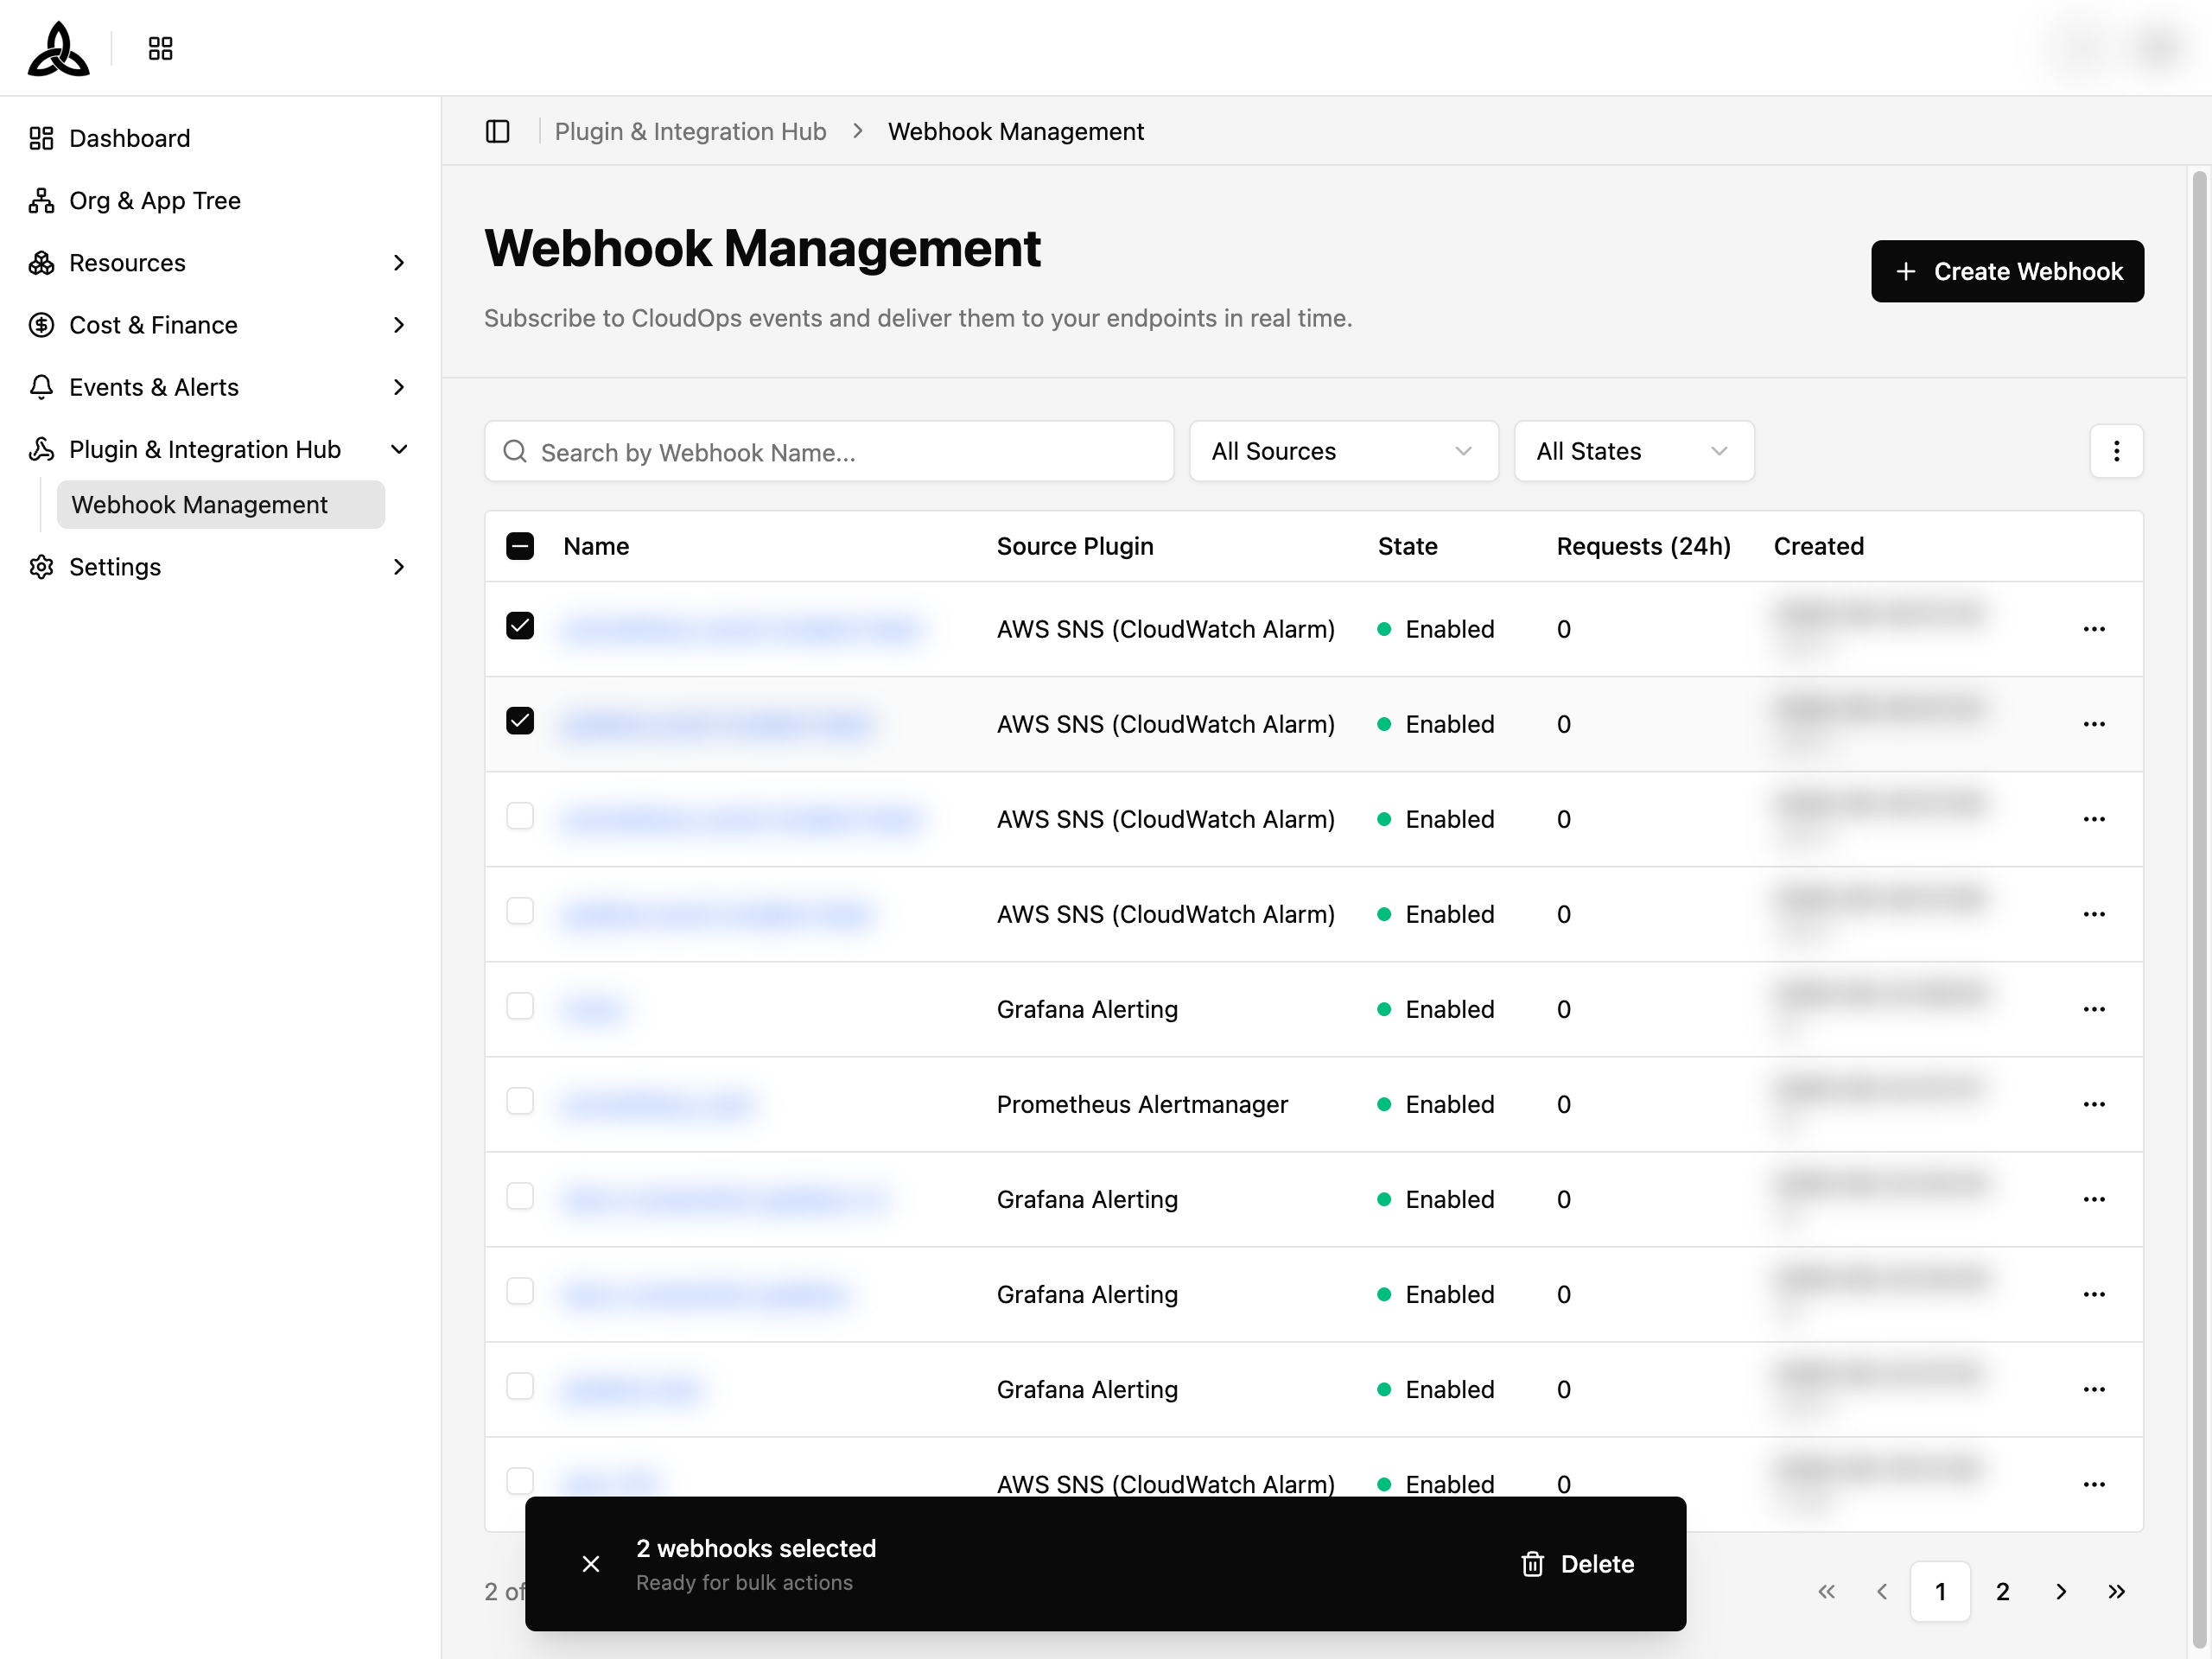
The ⋯ menu on each row holds Edit, Disable (or Enable), and Delete. Ticking the checkbox on one or more rows brings up a bulk bar for deleting several webhooks at once.
Creating a Webhook
Click [+ Create Webhook]
Step 1 — Source Plugin
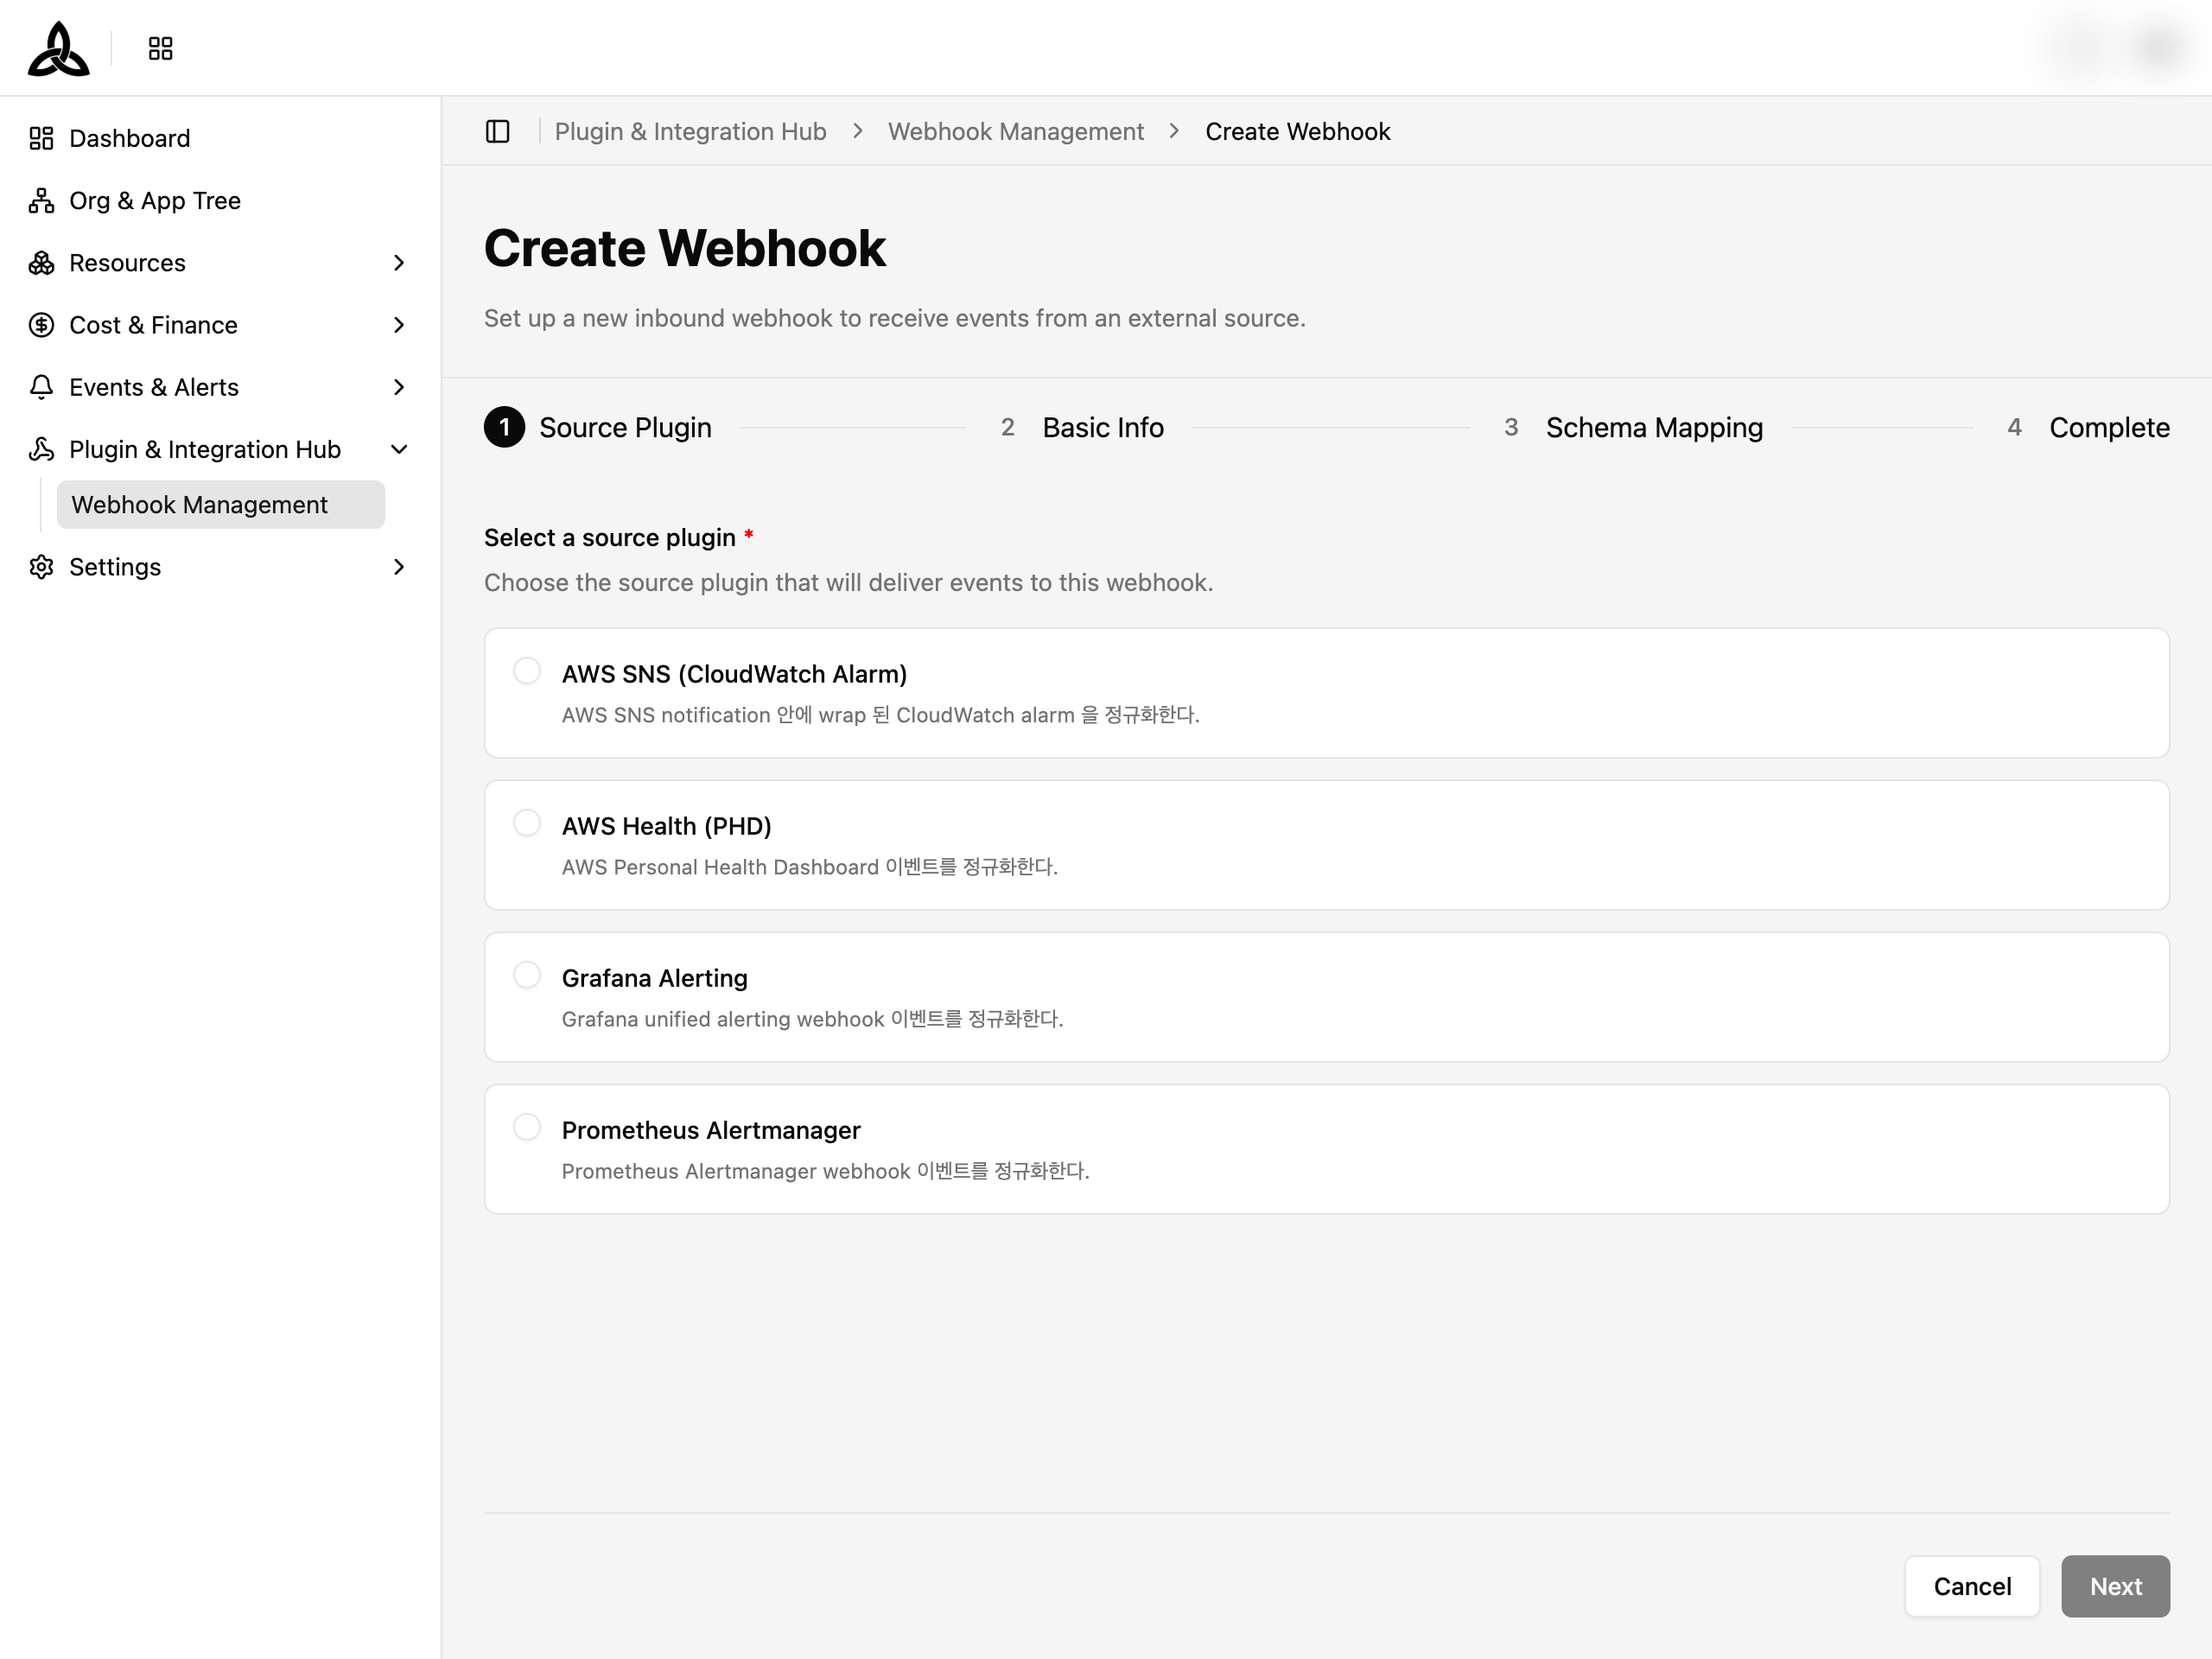
Choose which plugin will deliver events to this webhook. This choice determines how the payload is parsed, so it cannot be guessed later — pick the one that matches the tool you are wiring up.
Step 2 — Basic Info
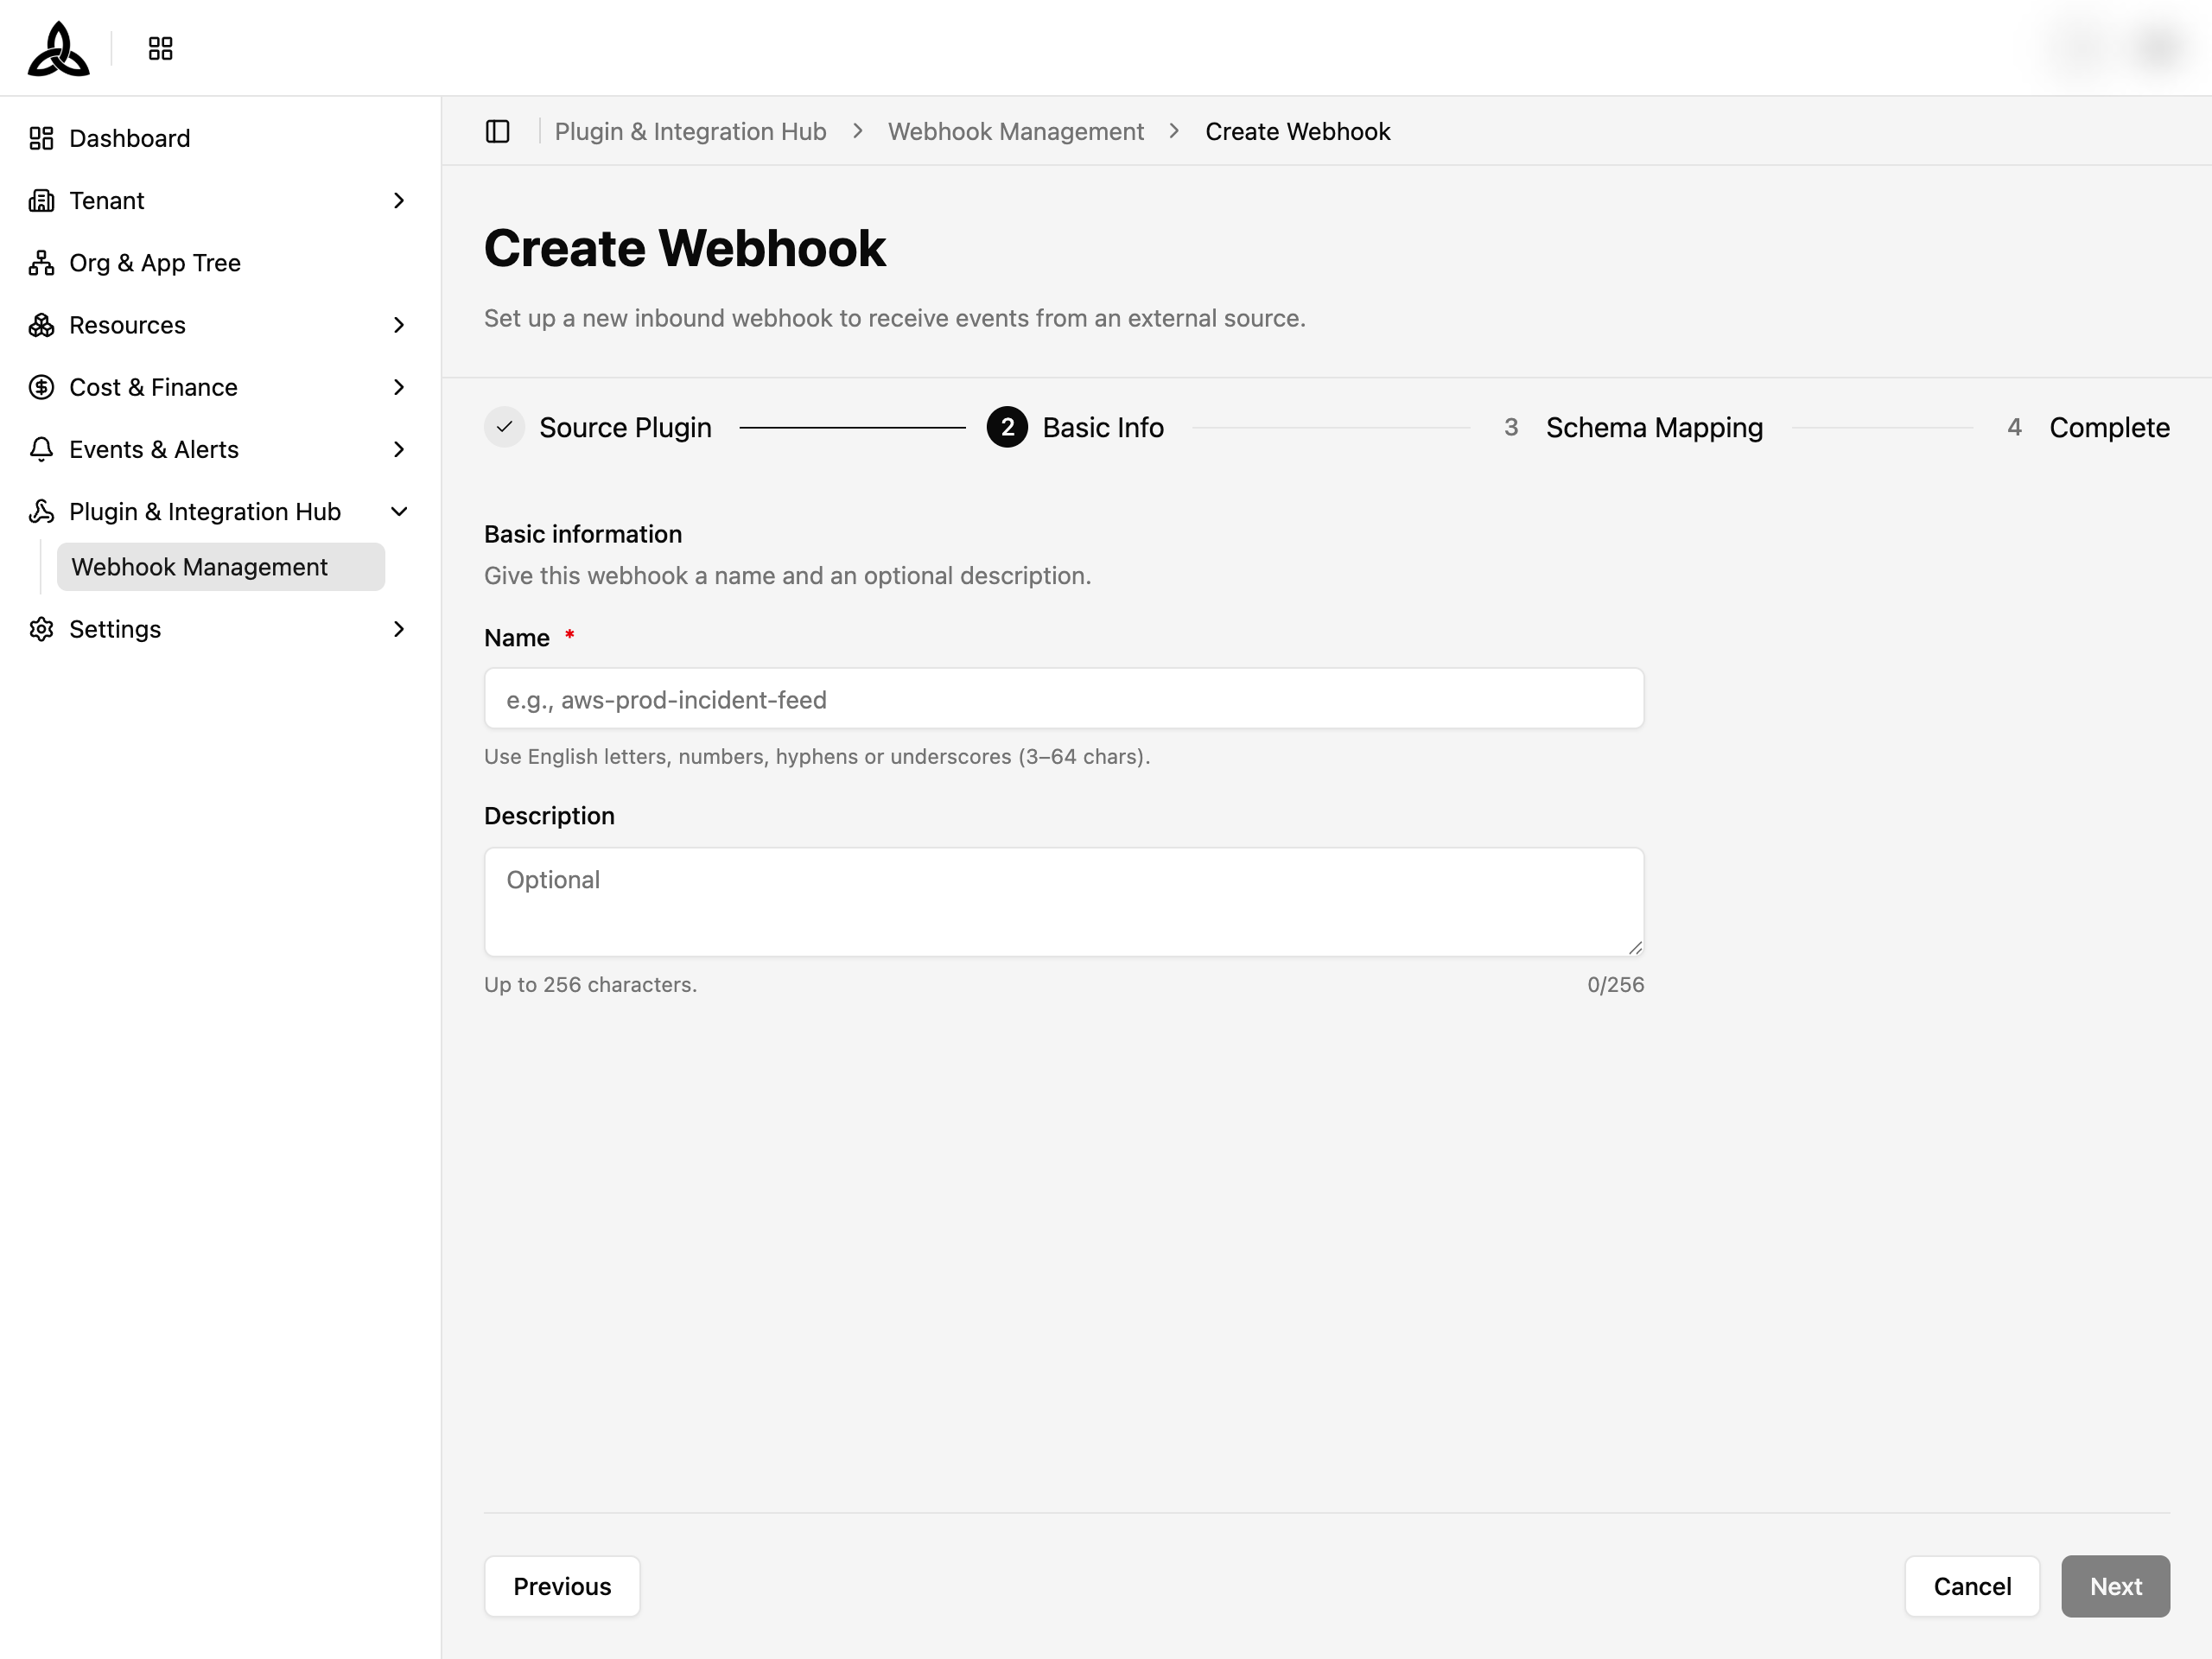
Give the webhook a Name (English letters, numbers, hyphens or underscores, 3–64 characters) and an optional Description of up to 256 characters.
Step 3 — Schema Mapping
Payload schema mapping is not available yet — click [Skip & Next] to continue. Until mapping is configured, events that arrive are stored as unmapped rather than being silently dropped, and become routable once mapping is enabled.
Step 4 — Complete
The generated webhook URL is shown here. Copy it into the sending tool’s webhook configuration.
Webhook Detail
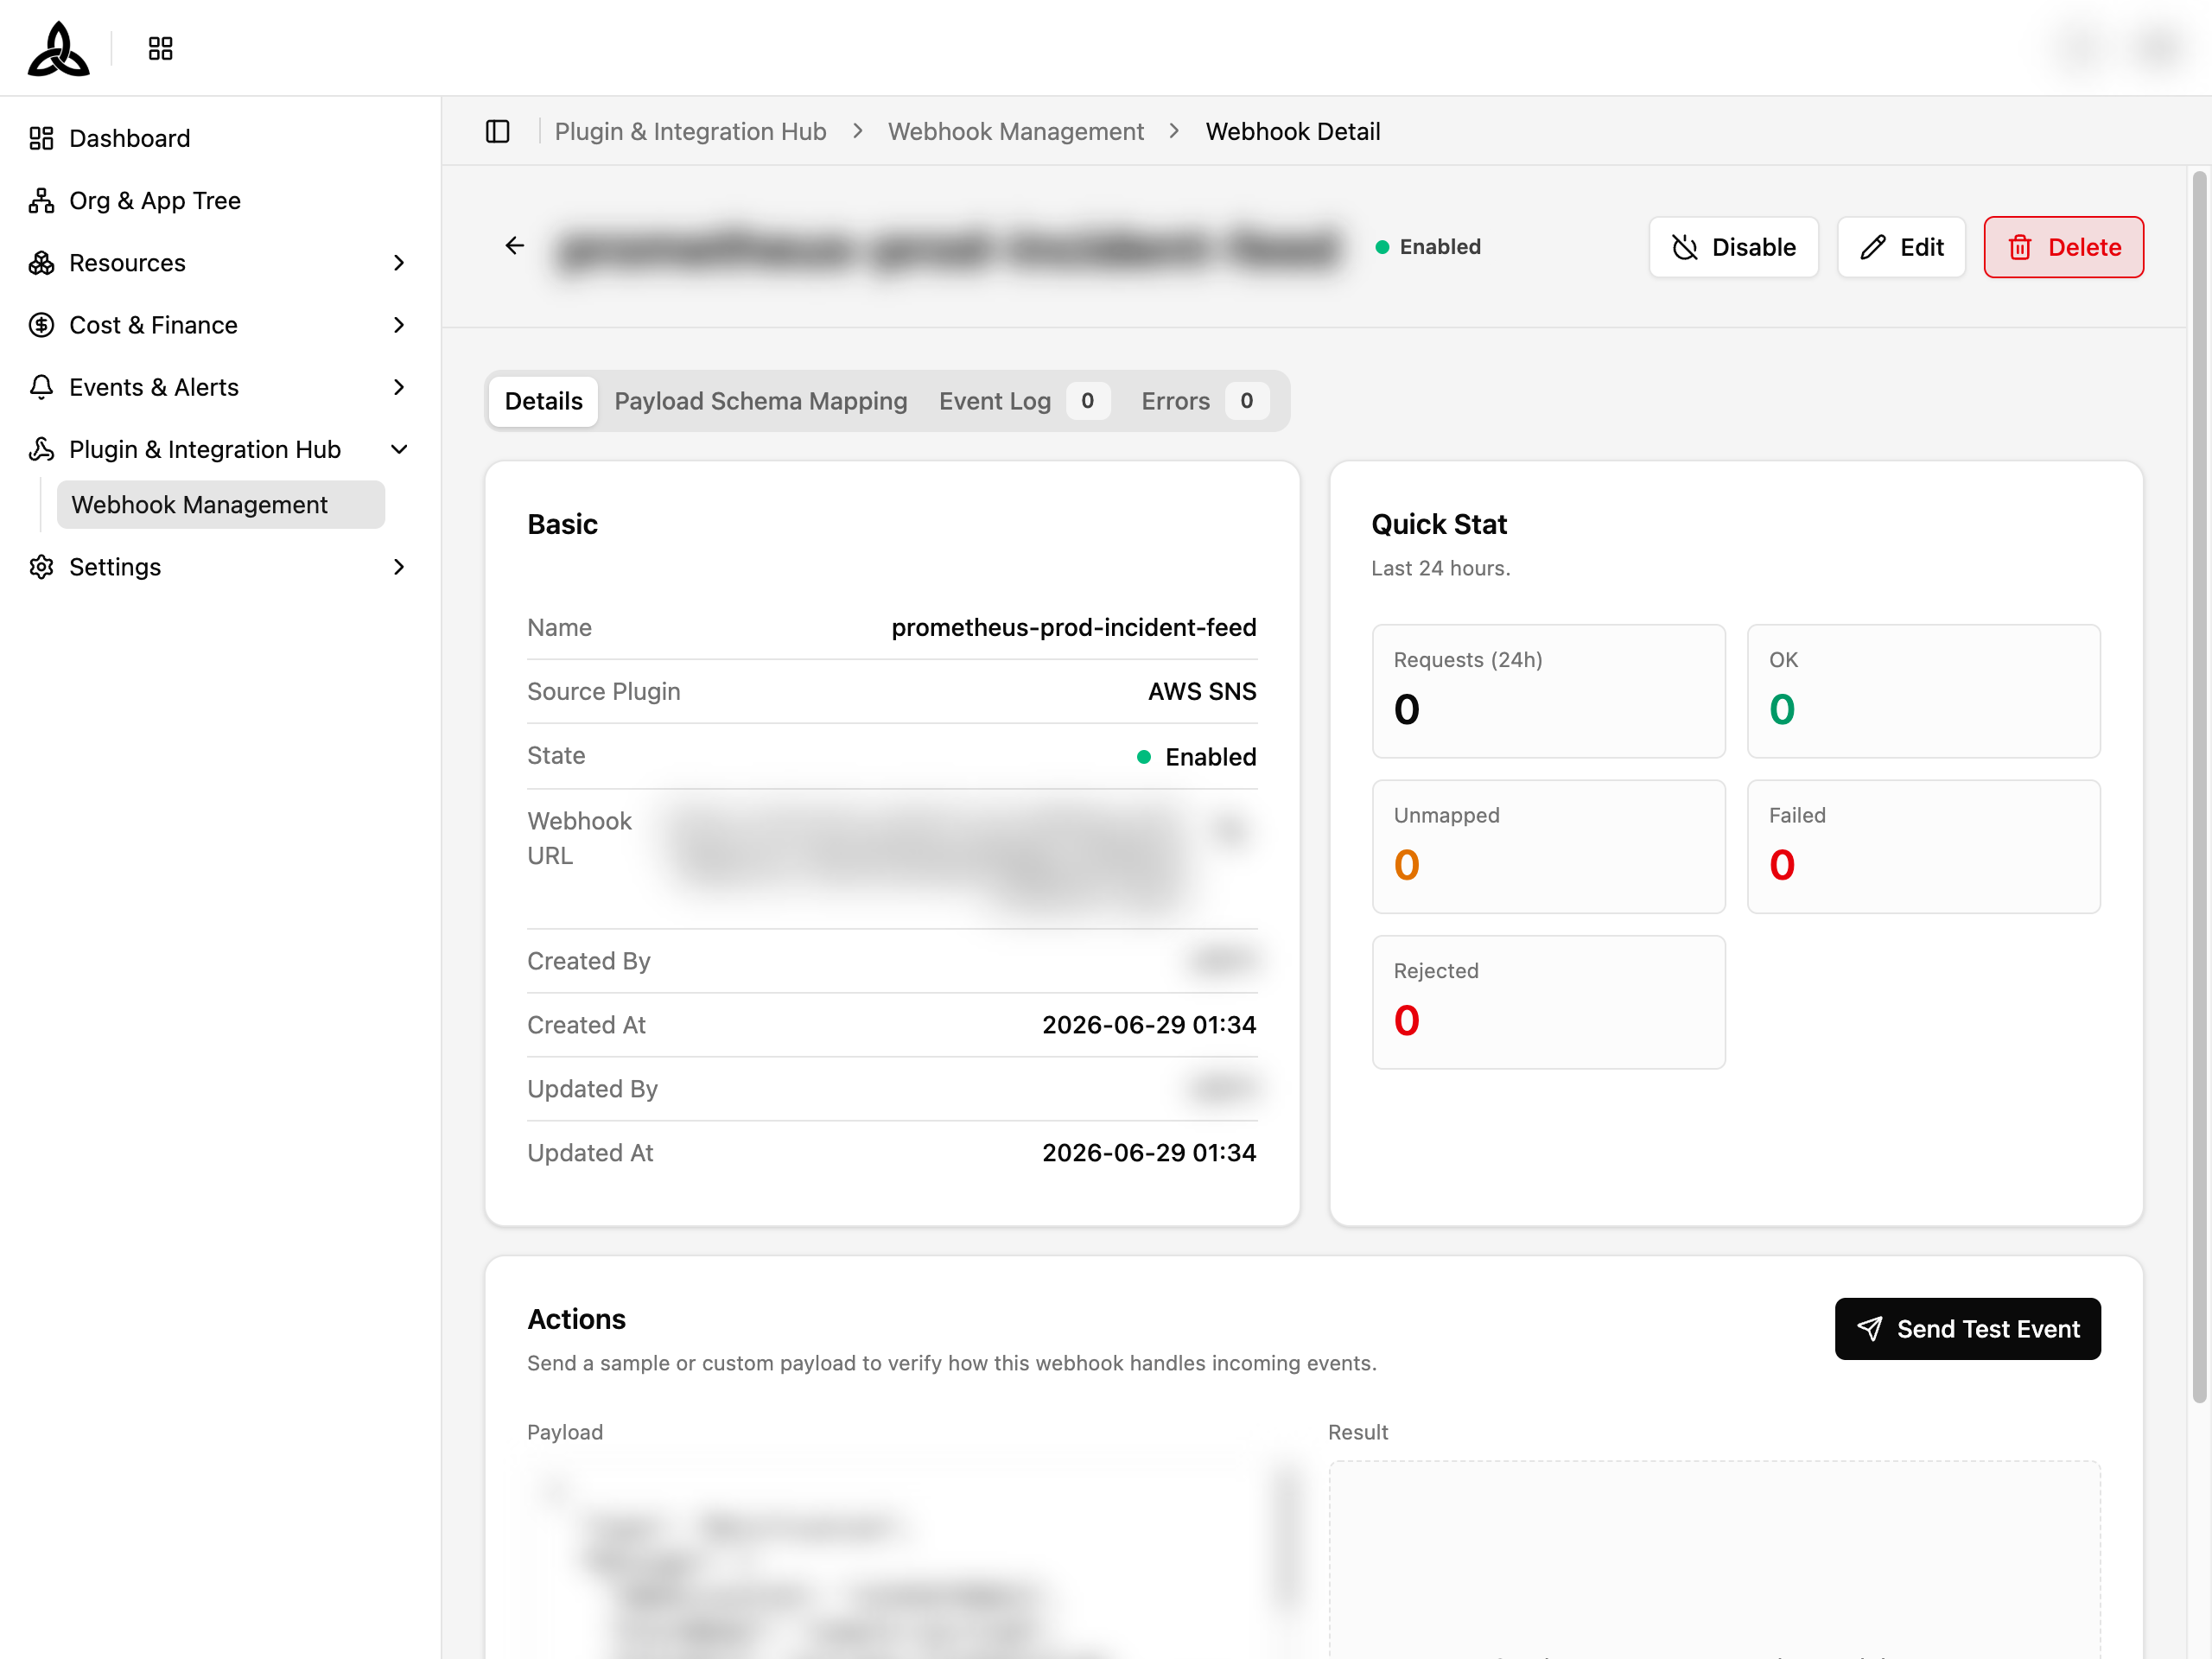
Open a webhook to inspect and operate it. The header carries Disable (or Enable), Edit, and Delete.
| Tab | Contents |
|---|---|
| Details | Basic information, delivery statistics, and the test-event tool |
| Payload Schema Mapping | Where the field mapping will live once the feature ships |
| Event Log | Events received, with a count badge |
| Errors | Events that failed, with a count badge |
Basic
Name, Source Plugin, State, the Webhook URL to register on the sending side, and who created and last updated it.
Quick Stat
Delivery counts over the last 24 hours.
| Metric | Meaning |
|---|---|
| Requests (24h) | Total requests received |
| OK | Successfully processed |
| Unmapped | Received and stored, but not yet routable because no schema mapping is configured |
| Failed | Processing failed |
| Rejected | Refused before processing |
Until payload schema mapping ships, incoming events land here rather than being dropped — a non-zero Unmapped count is expected, and confirms the webhook is receiving traffic.
Actions
[Send Test Event] posts a sample or custom payload so you can confirm how the webhook handles it before wiring up the real source. The result appears next to the payload.
AWS Health rather than AWS Health (via EventBridge). They refer to the same plugin.Deleting a Webhook
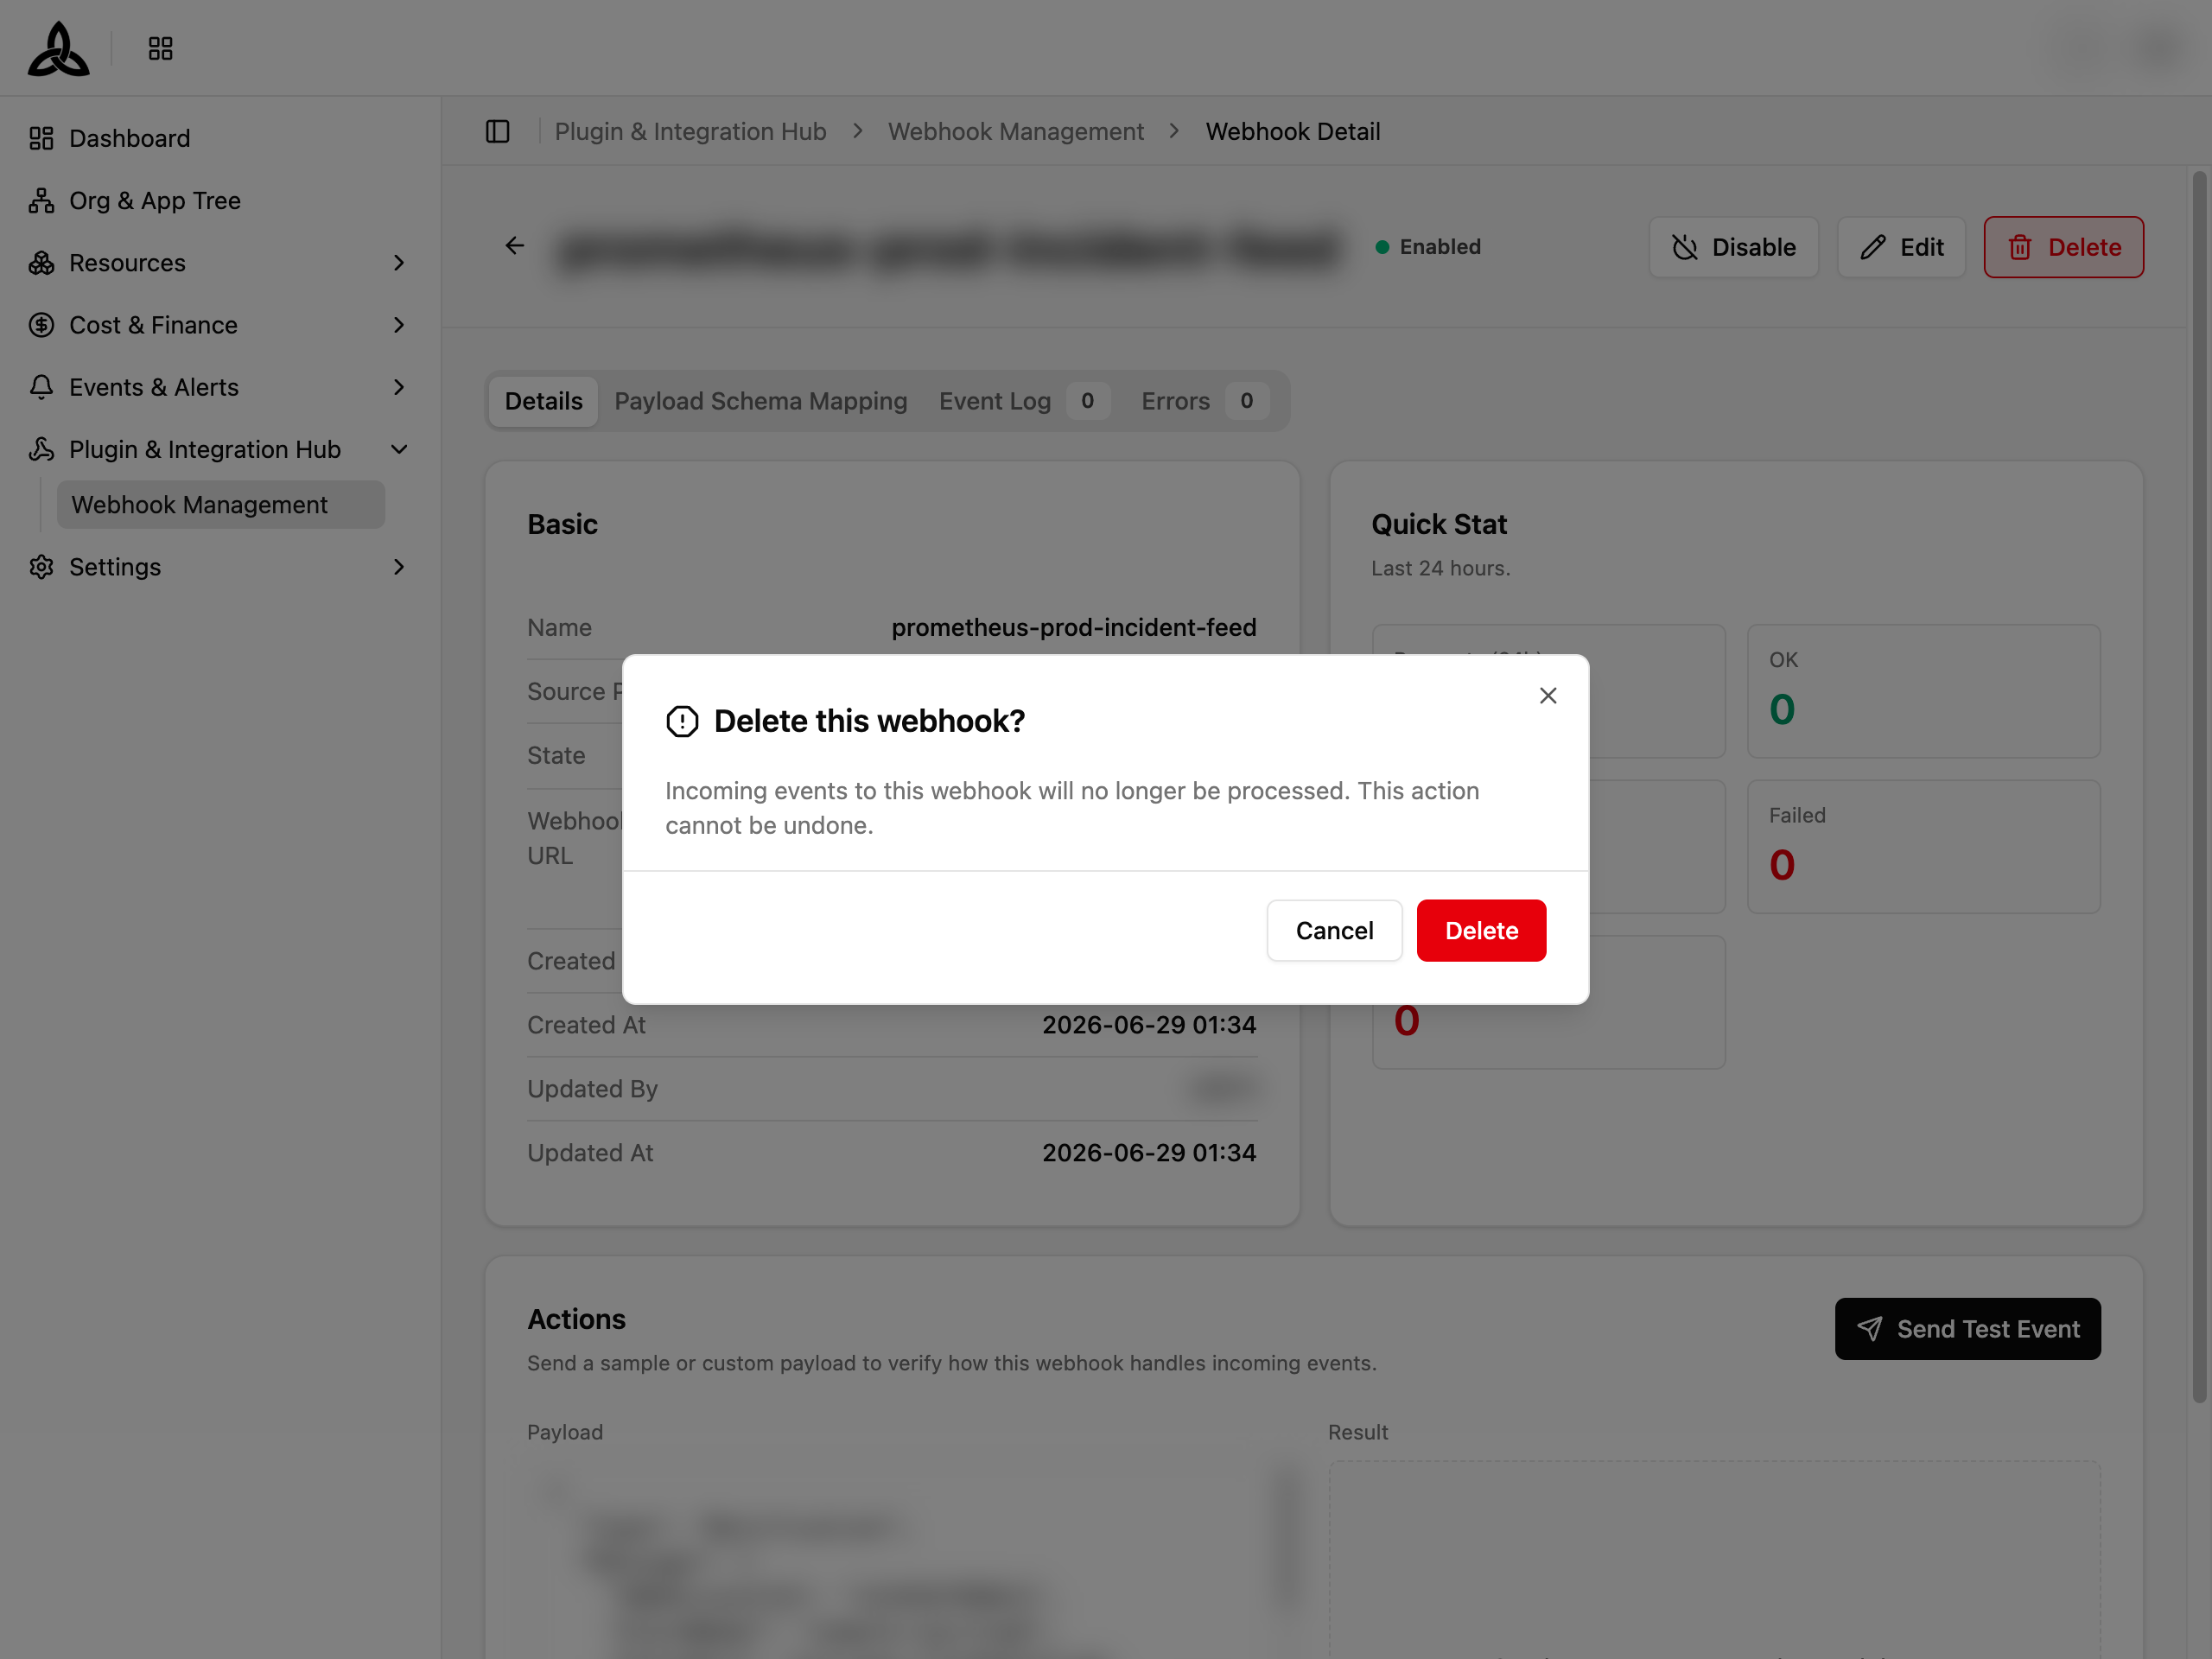
Delete from the row menu, from the bulk bar, or from the detail page. A confirmation dialog appears first, and deletion cannot be undone — the URL stops accepting events immediately, so disable the webhook instead if you only want to pause it.