Organization & Application
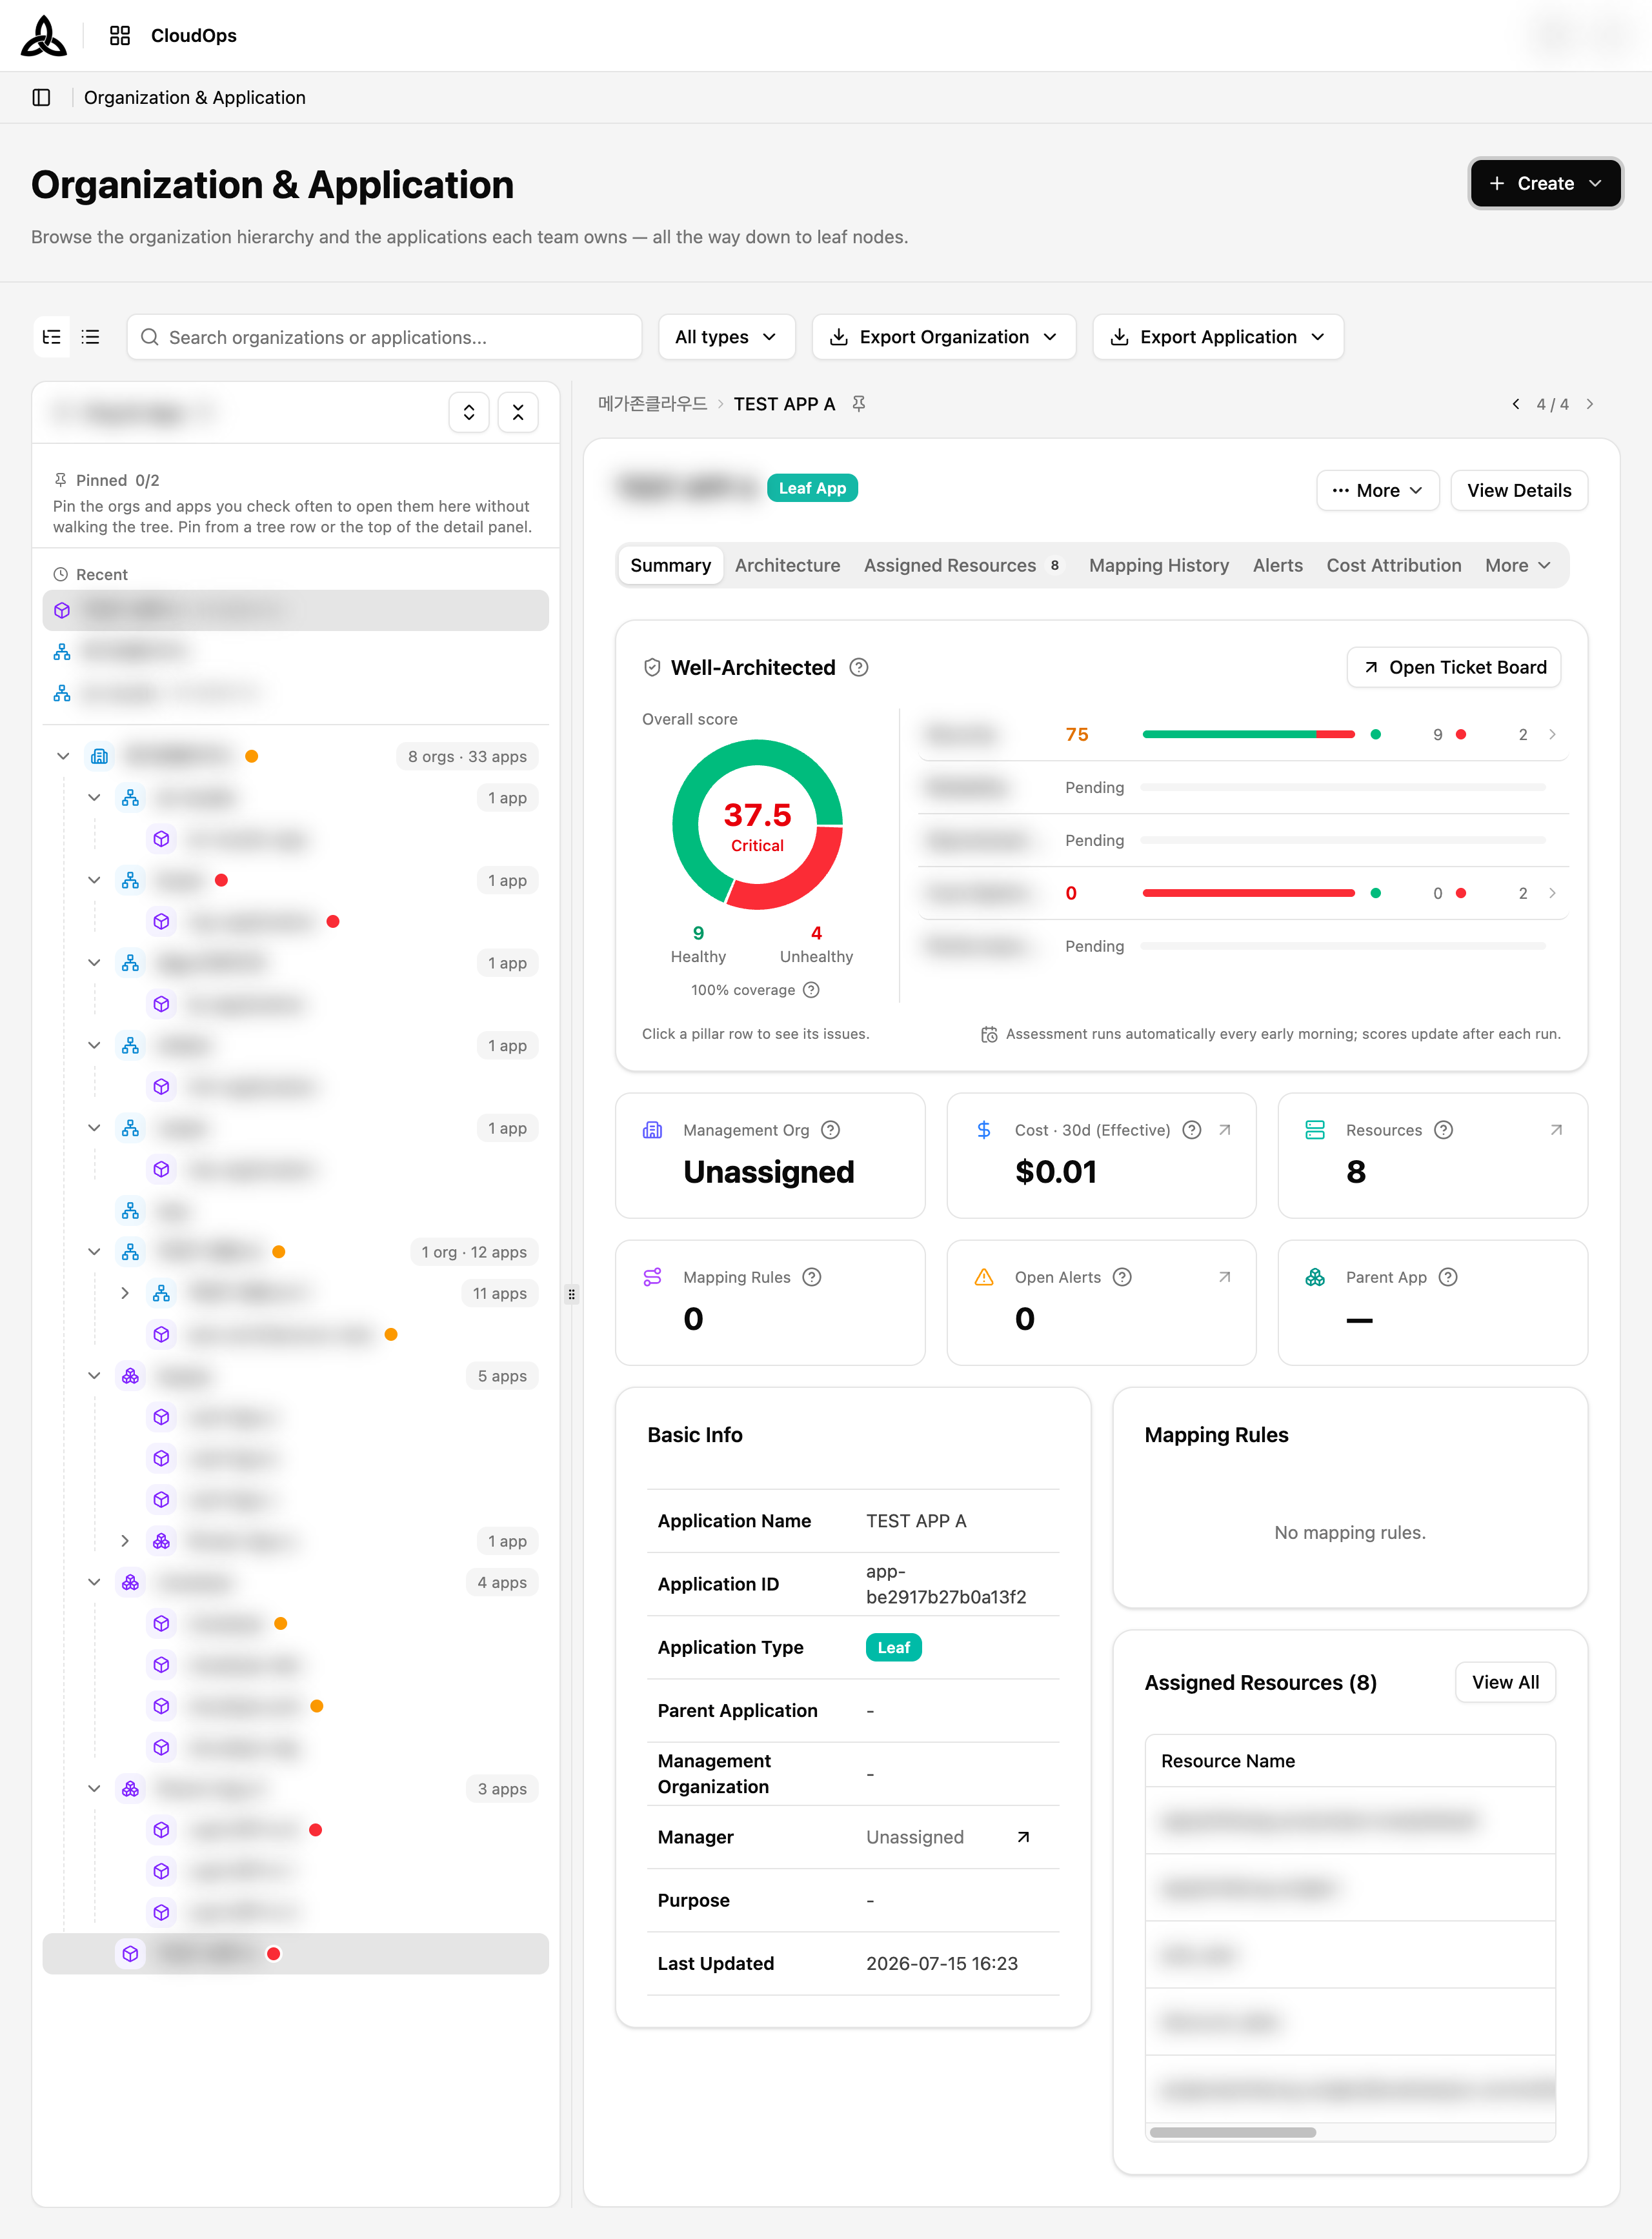
On the [Organization & Application] page, you can browse the organization hierarchy and the applications each team owns — all the way down to leaf nodes.
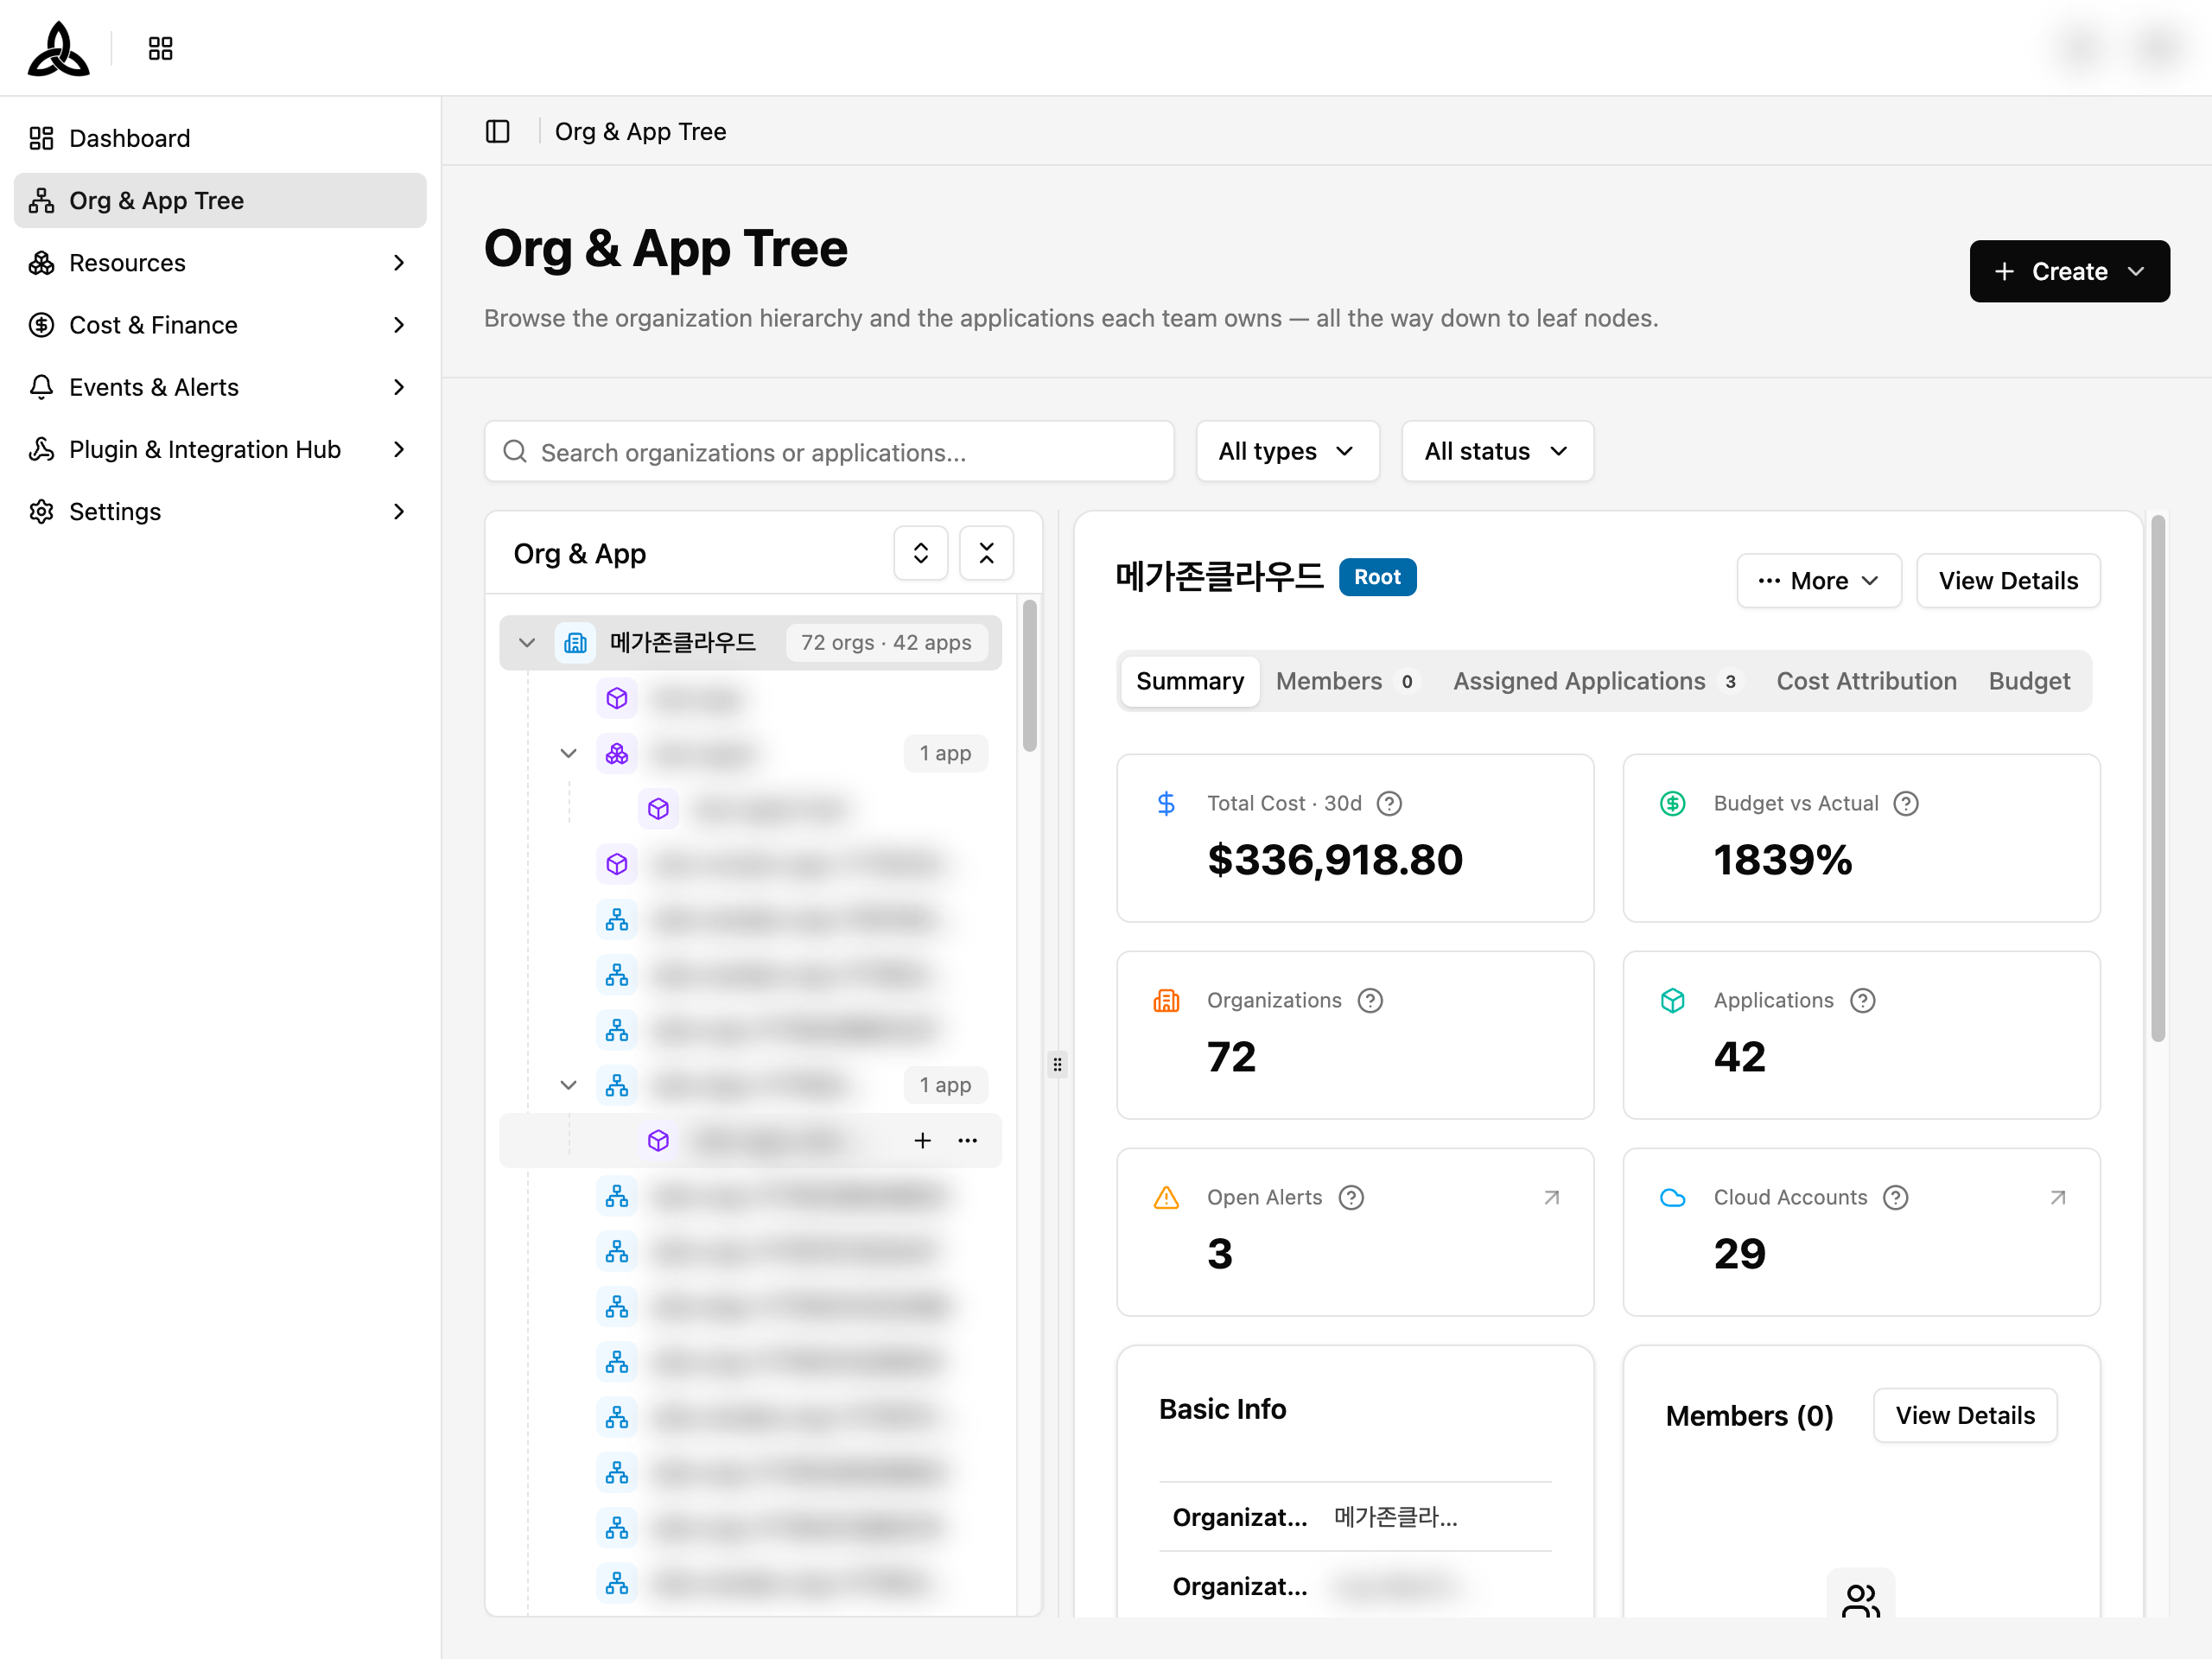
Page Layout
The page is divided into two areas:
| Area | Description |
|---|---|
| Tree Panel (left) | Unified tree displaying both Organizations and Applications in a single hierarchy. Organizations appear at the top level; Applications nest beneath them. A Pinned and Recent strip sits above it |
| Detail Card (right) | Summary information of the selected node — metrics, basic info, and a link to the full detail page. A breadcrumb and sibling arrows sit at its top |
Viewing the Tree
The tree panel shows the full Organization → Application hierarchy. The header displays total counts (e.g., 72 orgs · 40 apps).
| Feature | Description |
|---|---|
| Organization nodes | Shown with a building icon. Selecting one displays organization summary metrics |
| Application nodes | Shown with a box icon. Leaf applications are the lowest level where resources are mapped |
| Expand / Collapse | Click the arrow on a parent node to show or hide children. Children are loaded lazily |
| Collapse all | Click the collapse button in the tree header to close all expanded nodes |
| Add child (+) | Hover over an application node to reveal a + button for creating a child application |
| Count badges | Parent application nodes show the number of child applications |
| WA severity dot | Nodes with Well-Architected scores display a colored dot — red (critical, score < 70) or amber (warning, score 70–84). Hidden when score ≥ 85 or not evaluated |
Node Actions
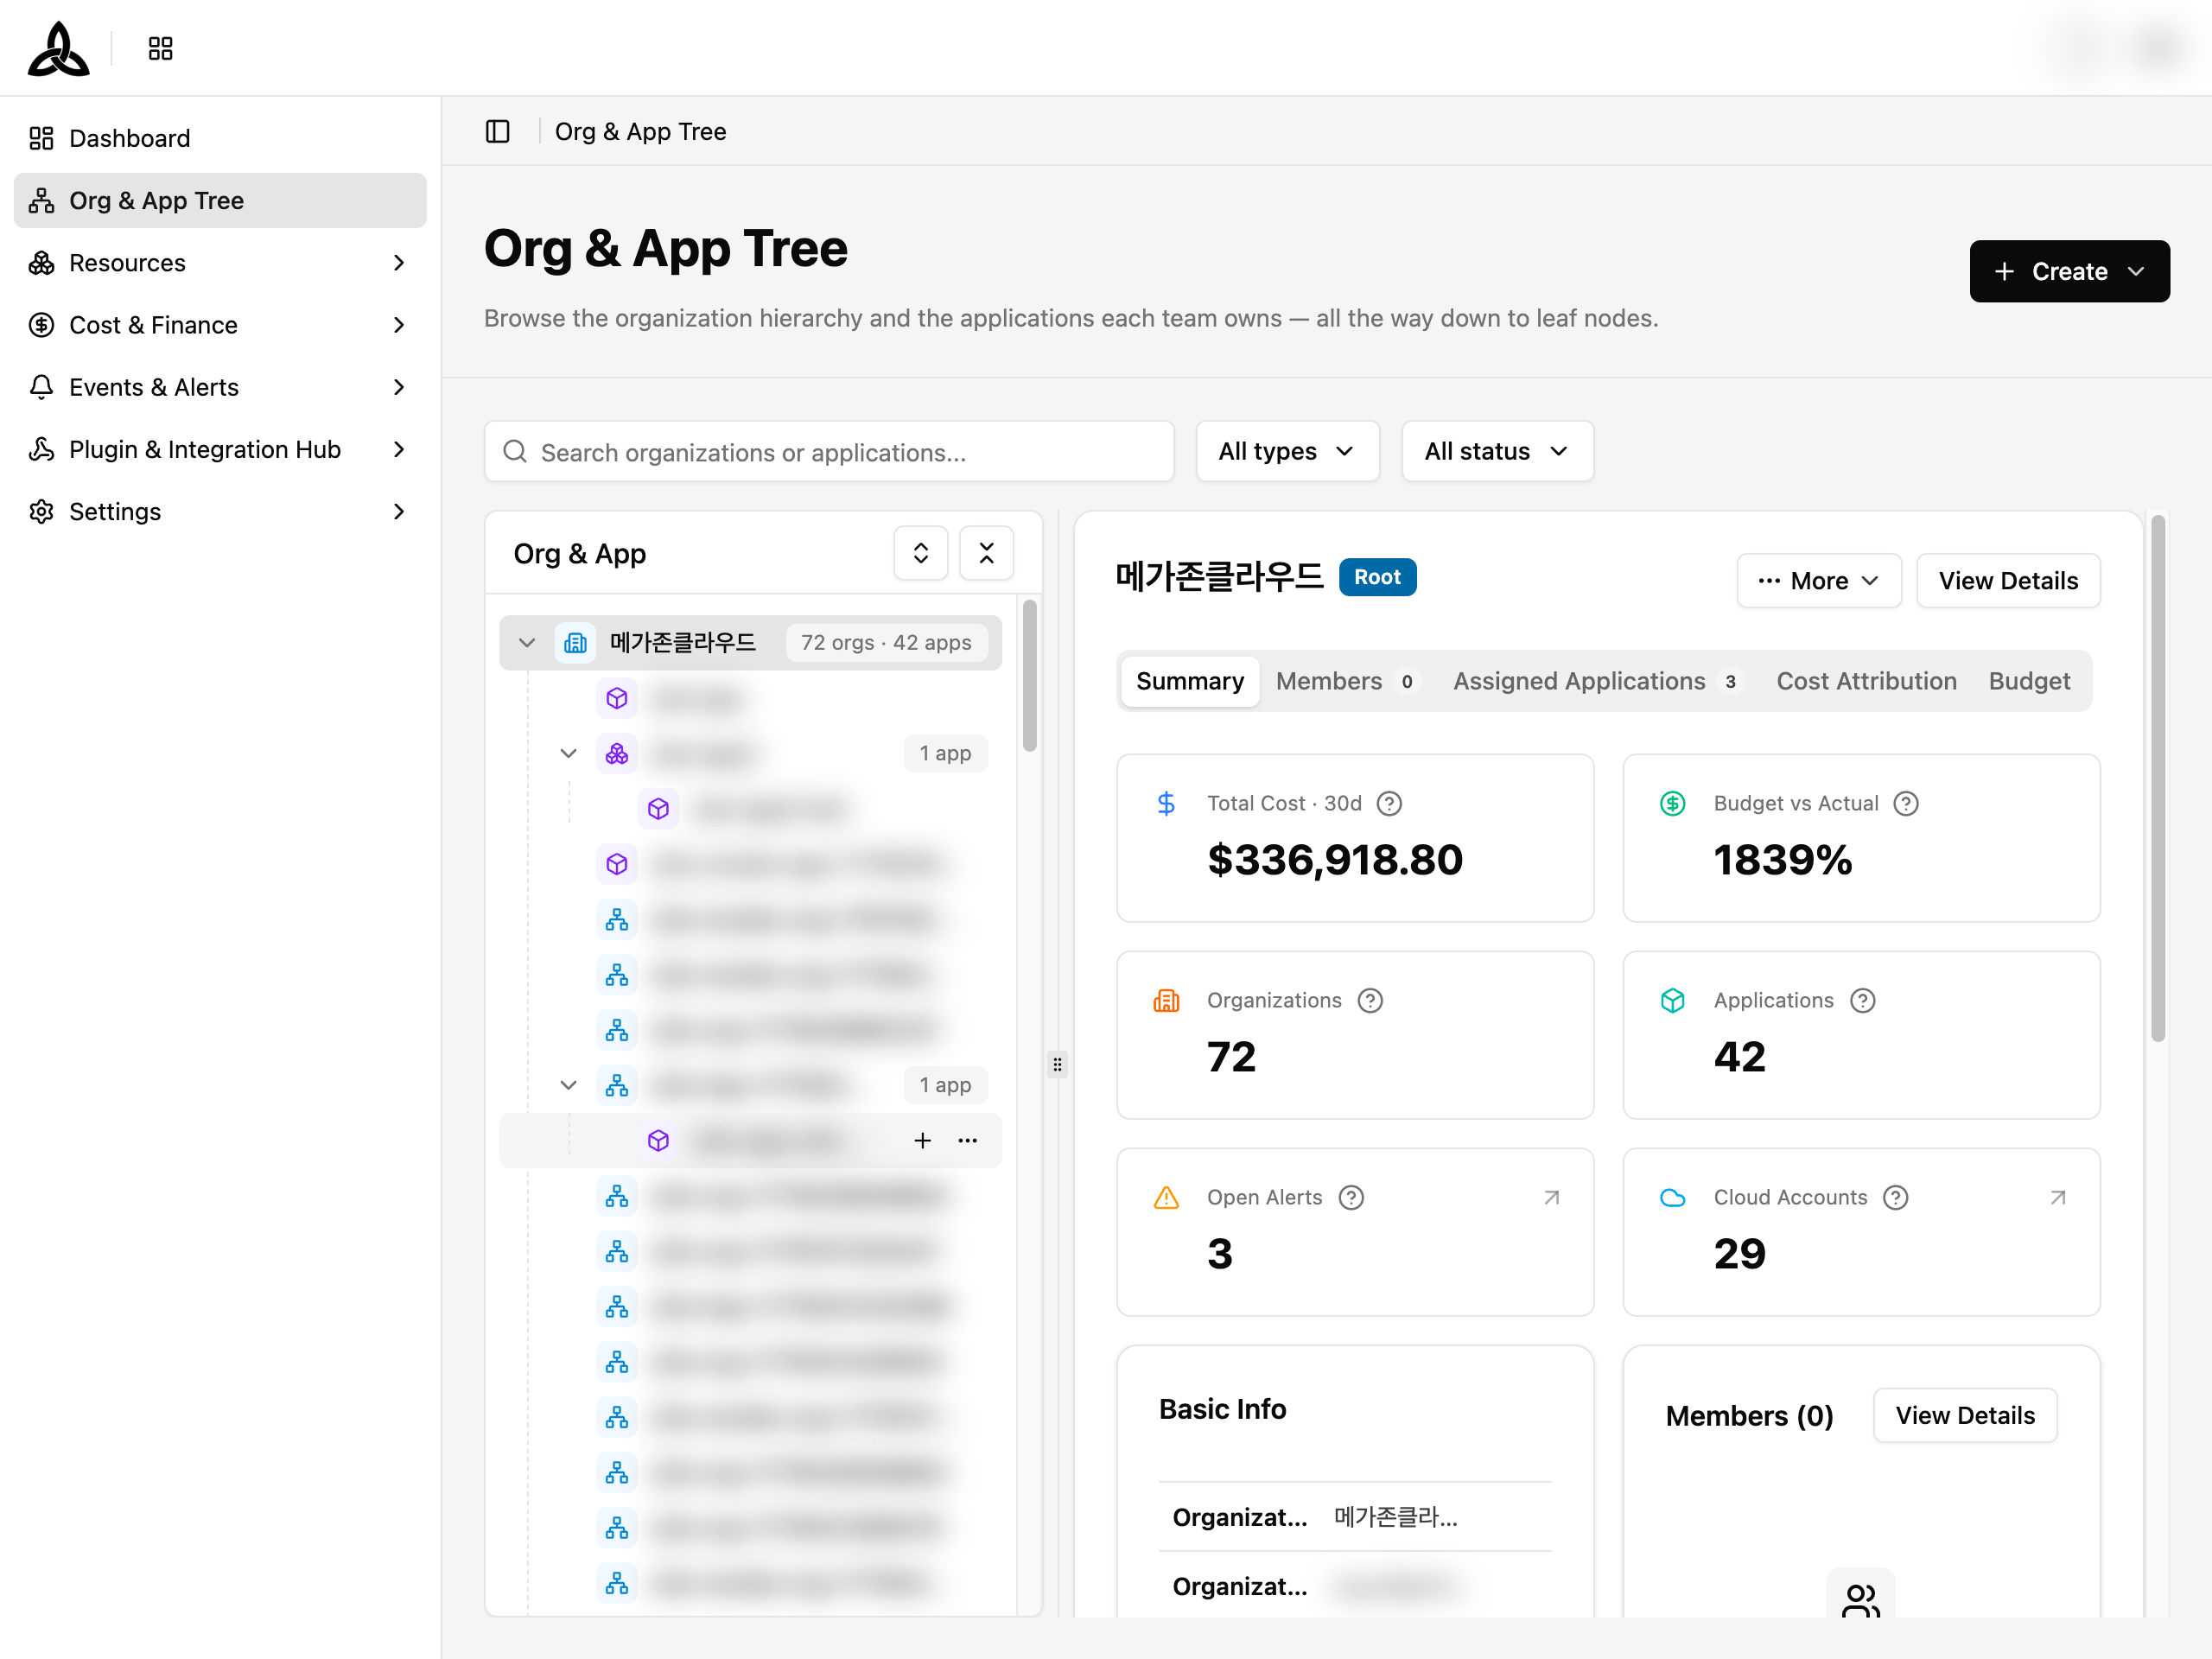
Hover over a tree node to reveal action buttons:
| Button | Description |
|---|---|
| + (Quick Create) | Create a child node. On an organization: choose between Organization or Application. On an application: directly creates a child application |
| ⋯ (More) | Context menu with View details, Edit, Move, Delete. Root organizations only show View details |
Tree or list
The [Tree] / [List] toggle swaps how the same hierarchy is presented. The list drops the nesting and lays every node out as rows, which is the faster way to scan across branches rather than down one:
| Column | Description |
|---|---|
| Name | The organization or application |
| Type | Organization or Application |
| Path | Where it sits, so a row still says which branch it came from |
| Child Orgs / Child Apps | How many each node holds |
| WA Score | Well-Architected score, or - when not evaluated |
Getting back to somewhere
Three things save you from walking the tree again.
| Control | What it does |
|---|---|
| Pinned | Nodes you pinned, opened in one click. Pin from a tree row or the top of the detail panel. There is a limit — past it, unpin something first |
| Recent | Nodes you opened recently, filled in automatically |
| Breadcrumb | The path to the selected node, above the detail card. Long paths collapse the middle into +N |
| Sibling arrows | [Previous] / [Next] step through the nodes alongside the current one, with 3 / 12 saying where you are |
Which branches you left expanded is remembered, so returning to the page does not reset the tree to fully collapsed.
Exporting the tree
The toolbar carries two export buttons, because the tree holds two kinds of thing: [Export Organization] and [Export Application]. Each offers Excel (up to 30,000 rows) or CSV (up to 50,000 rows), and exports what the current filters and visible columns give.
Search and Filters
| UI Element | Description |
|---|---|
| Search | Search organizations or applications by name |
| All types | Filter by node type — All types, Organizations, or Applications |
Types Filter
Click [All types] to filter the tree by node type.

Selecting an Organization
Click an organization node in the tree to view its summary card. The card displays a Root badge and provides the following tabs.
Summary
Key metrics at a glance — Total Cost, Budget vs Actual, Organizations, Applications, Open Alerts, Cloud Accounts. Basic Info and Members section below.
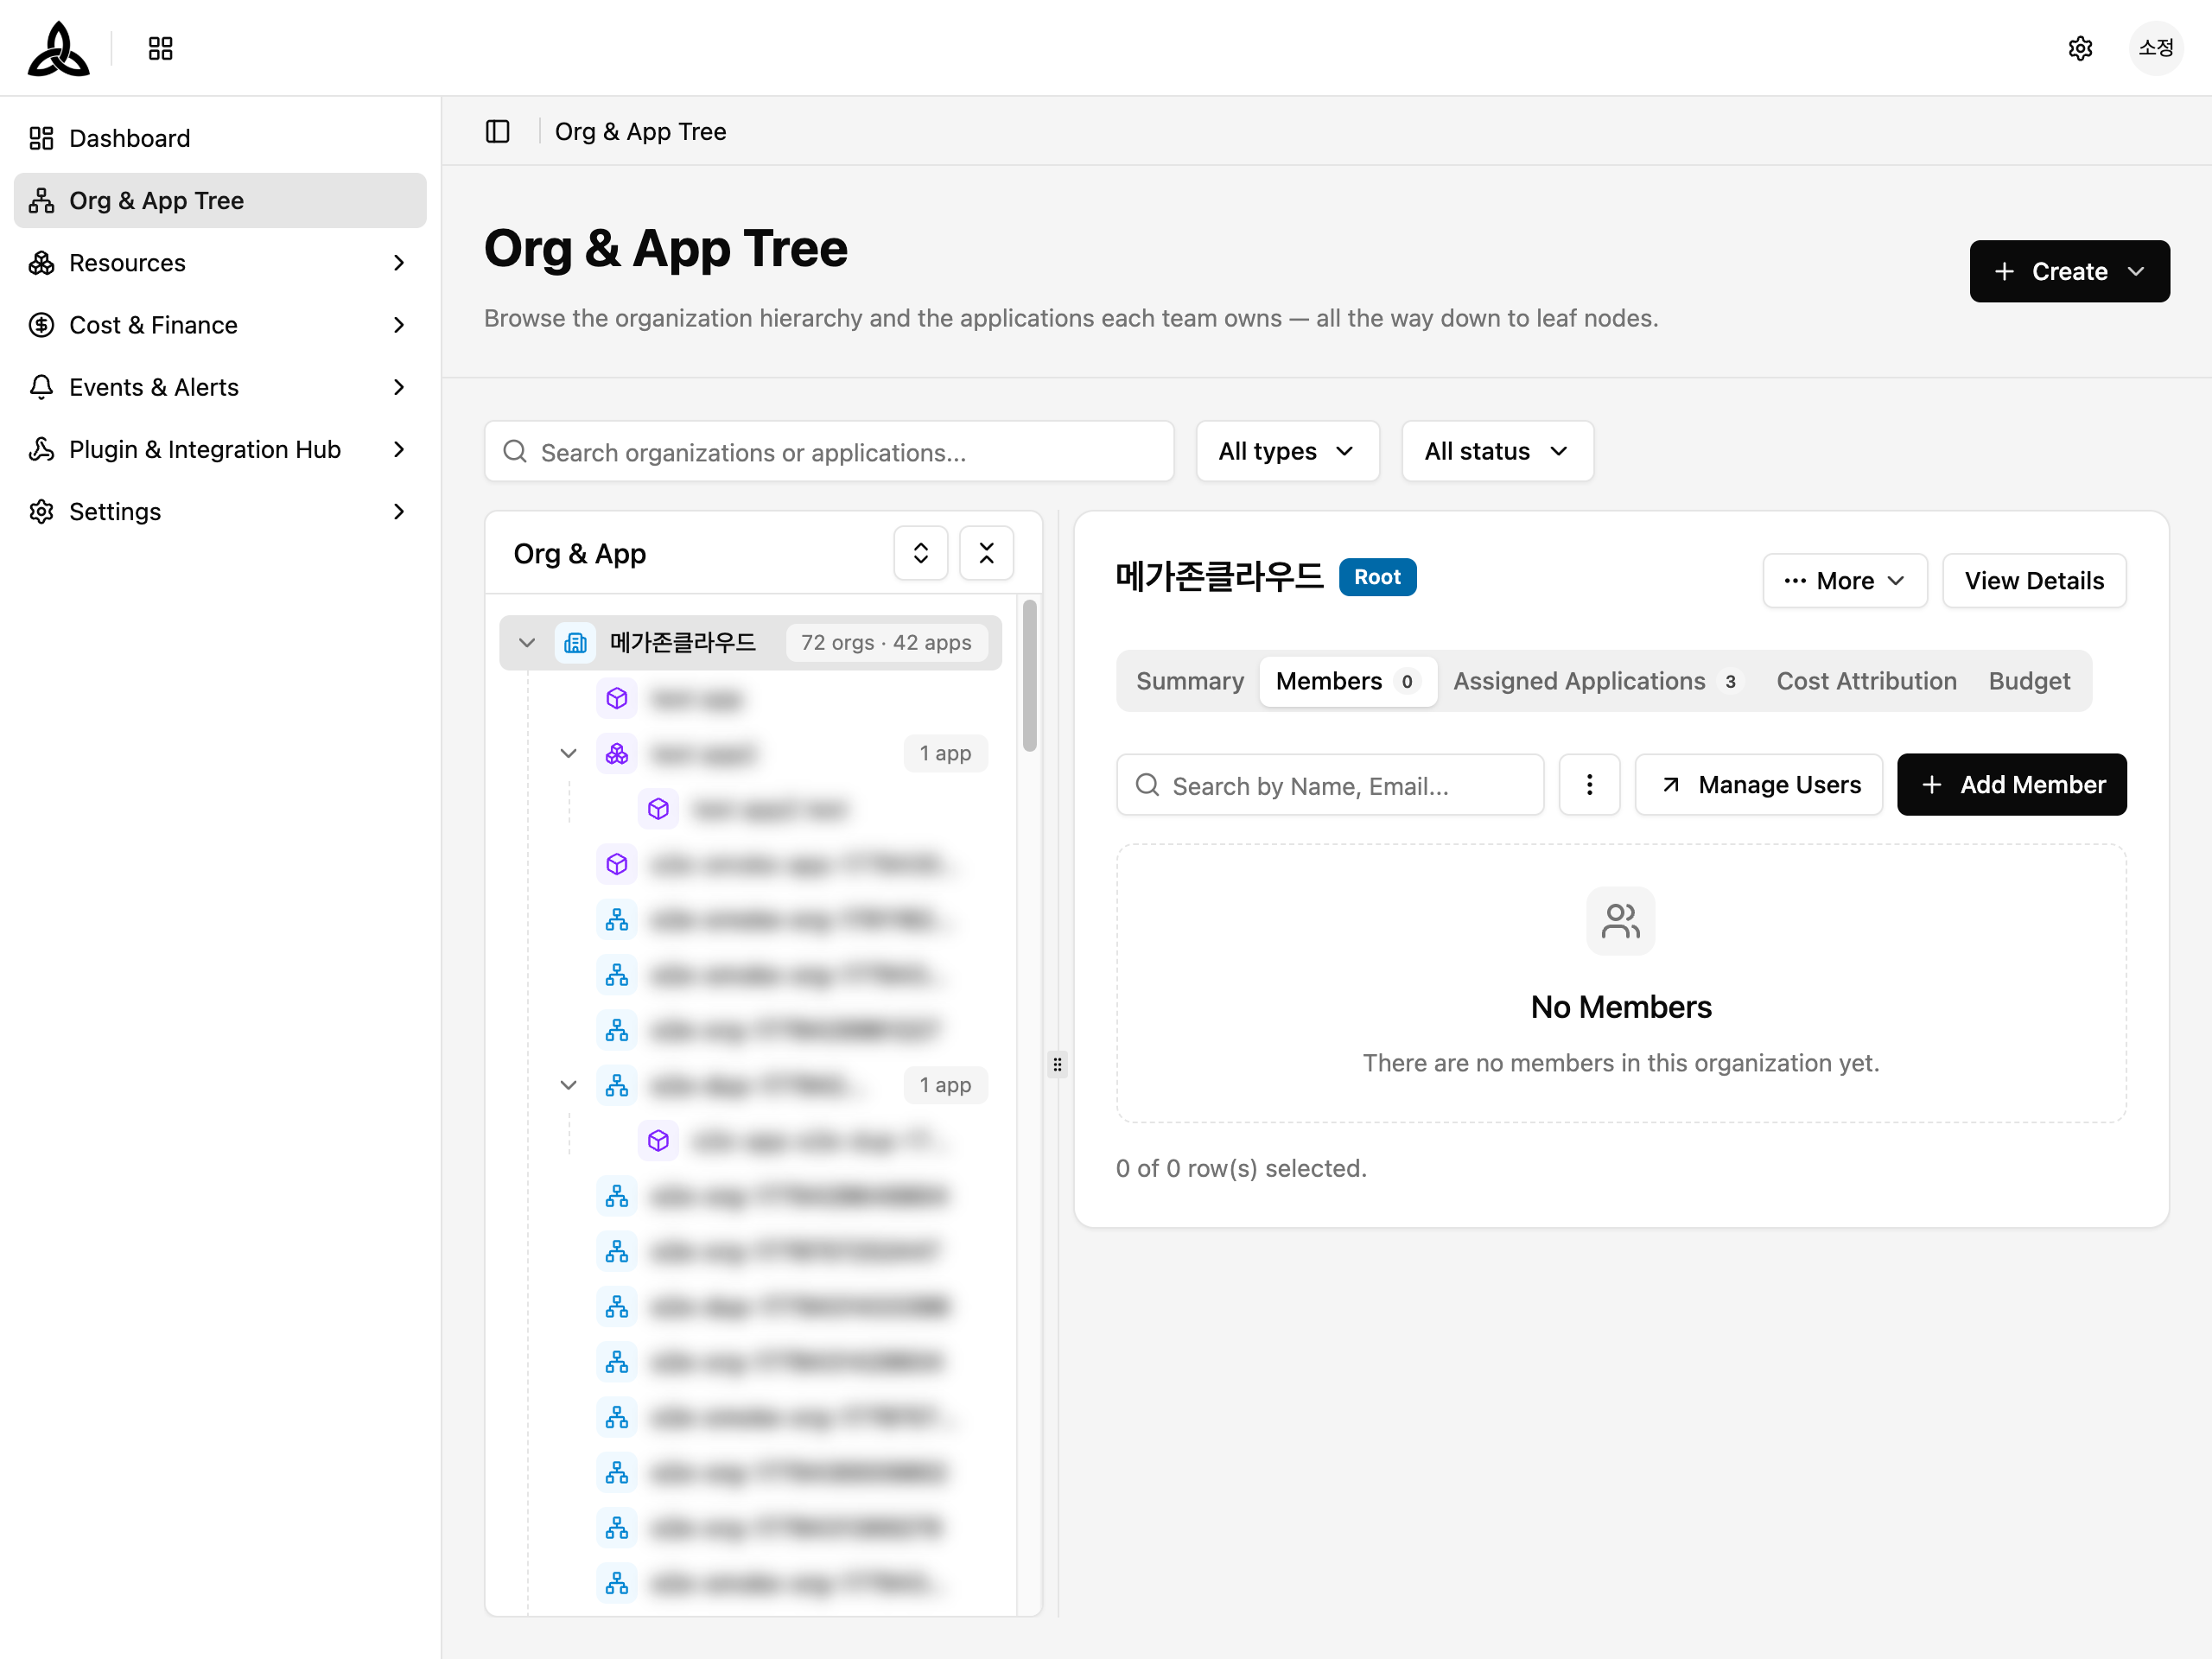
Members
View and manage organization members. Search by name or email, and add new members with [+ Add Member].
Assigned Applications
Applications assigned to this organization, shown with count badge.
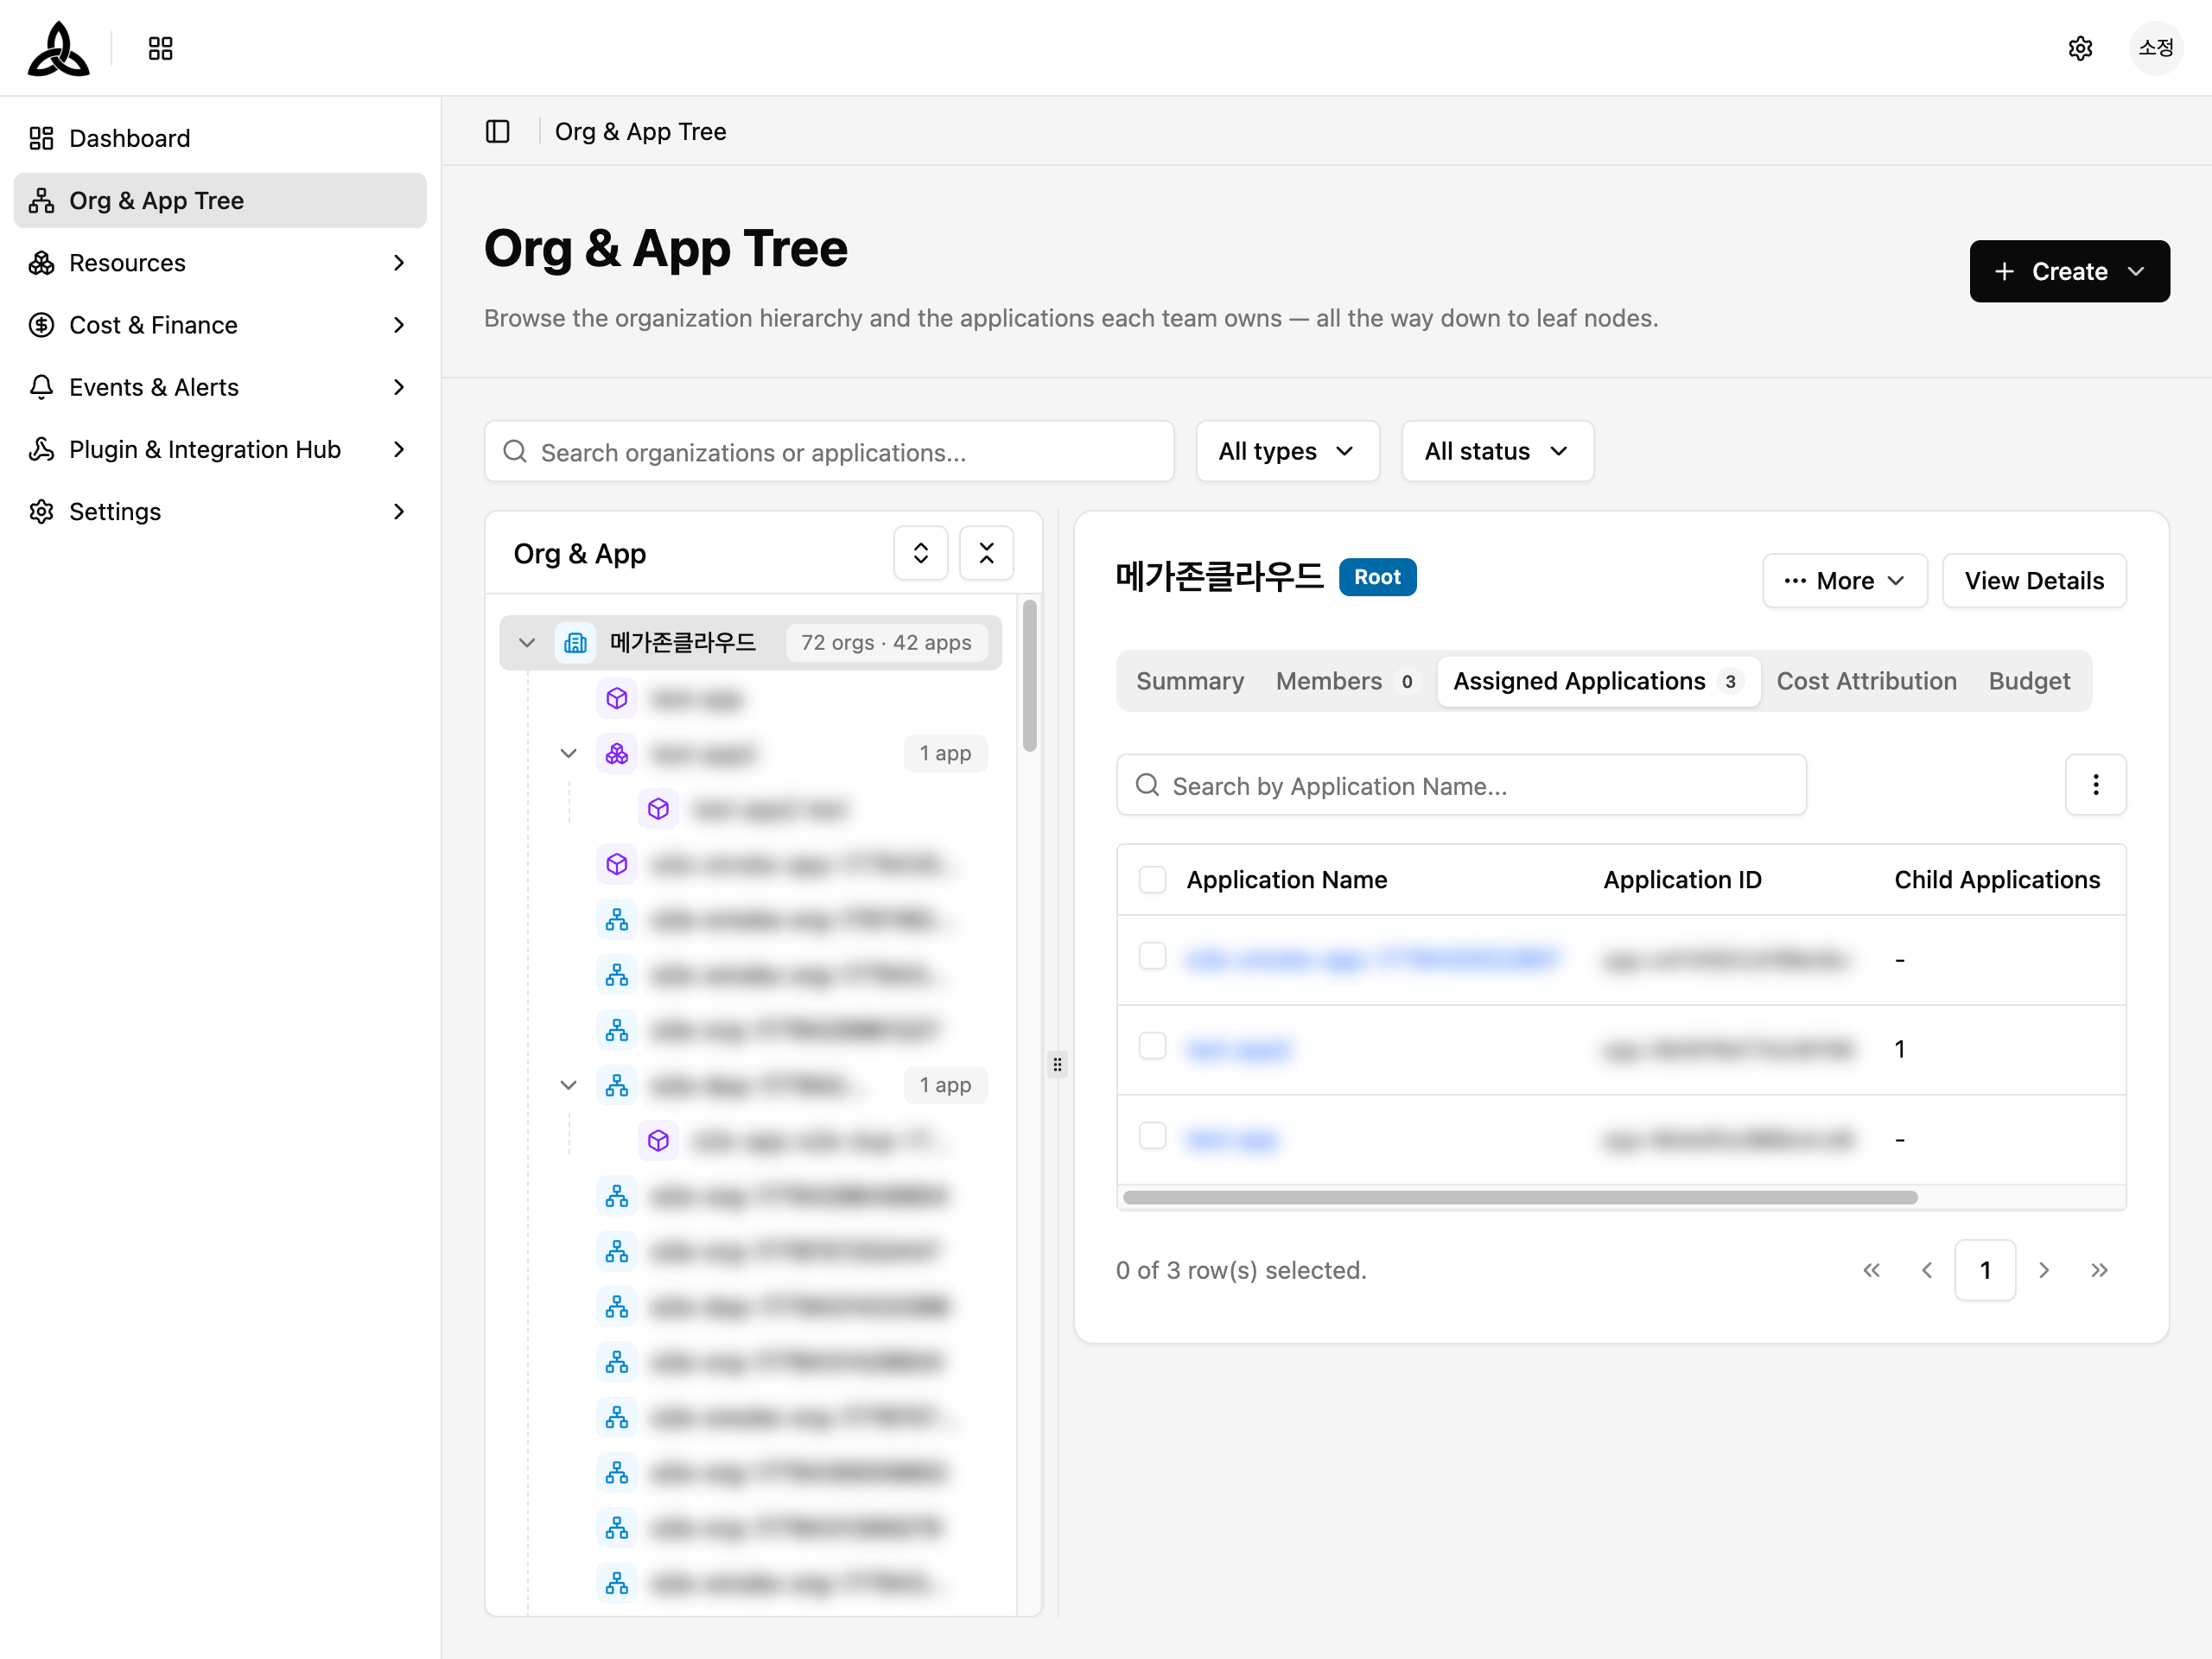
Reassigning an application
Reassign moves an application to a different managing organization. Alongside the new organization you choose Cost effective from — the date from which the application’s cost counts against the new owner. It defaults to today.
| Date you pick | What happens to cost |
|---|---|
| Today (the default) | Cost goes to the new organization from today. Everything before today stays with the old one |
| Earlier this month | Cost from that date through today moves out of the old organization into the new one. Anything earlier stays put |
The date you chose is recorded in the organization’s Mapping History, so a later reader can see not just that the application moved but from when its cost did.
Cost Attribution
Cost breakdown for this organization, in Effective, Billed, and List terms.
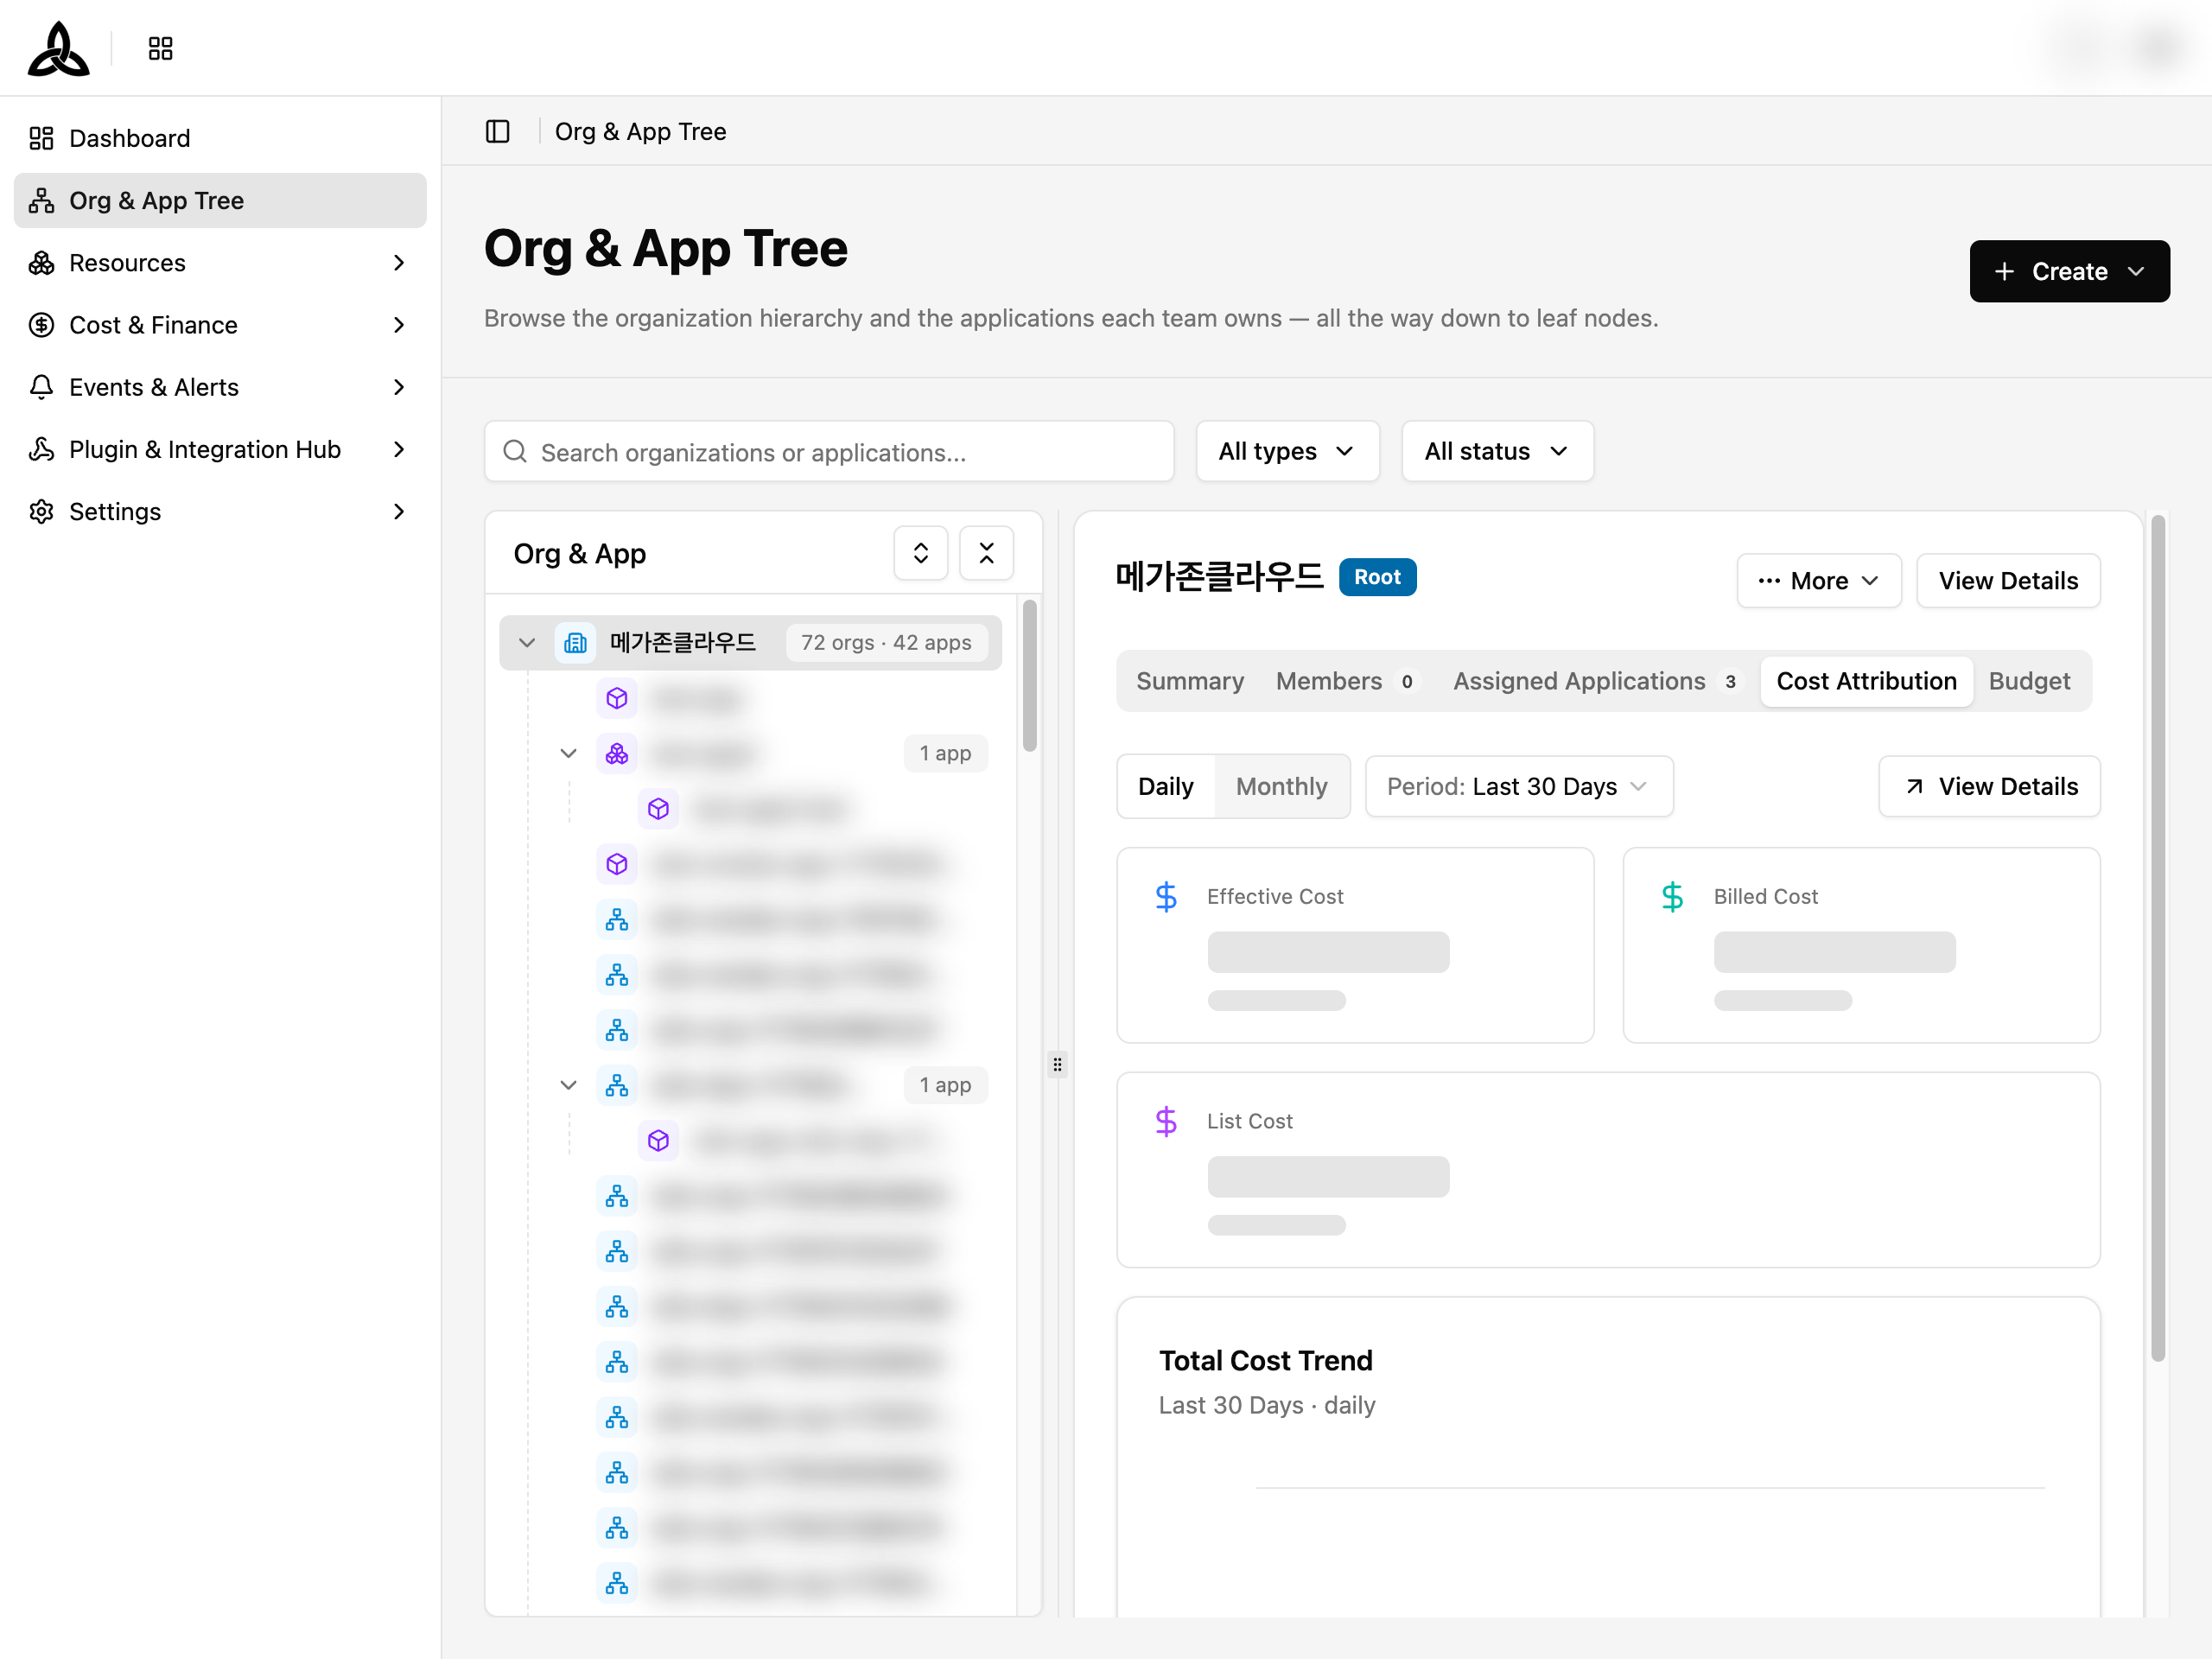
| Control | What it changes |
|---|---|
| Daily / Monthly | The bucket size of the chart |
| Period | How far back to look |
| Trend / Cumulative | Whether the chart shows cost per bucket or a running total |
The chart also projects where the cost is heading: actual months are drawn solid, and the Forecast region continues them as a dashed line over a shaded background. A marker labels the month still in progress, and a caption states the date the data runs through — so a projection is never read as settled spend.
Budget
Budget information for this organization.
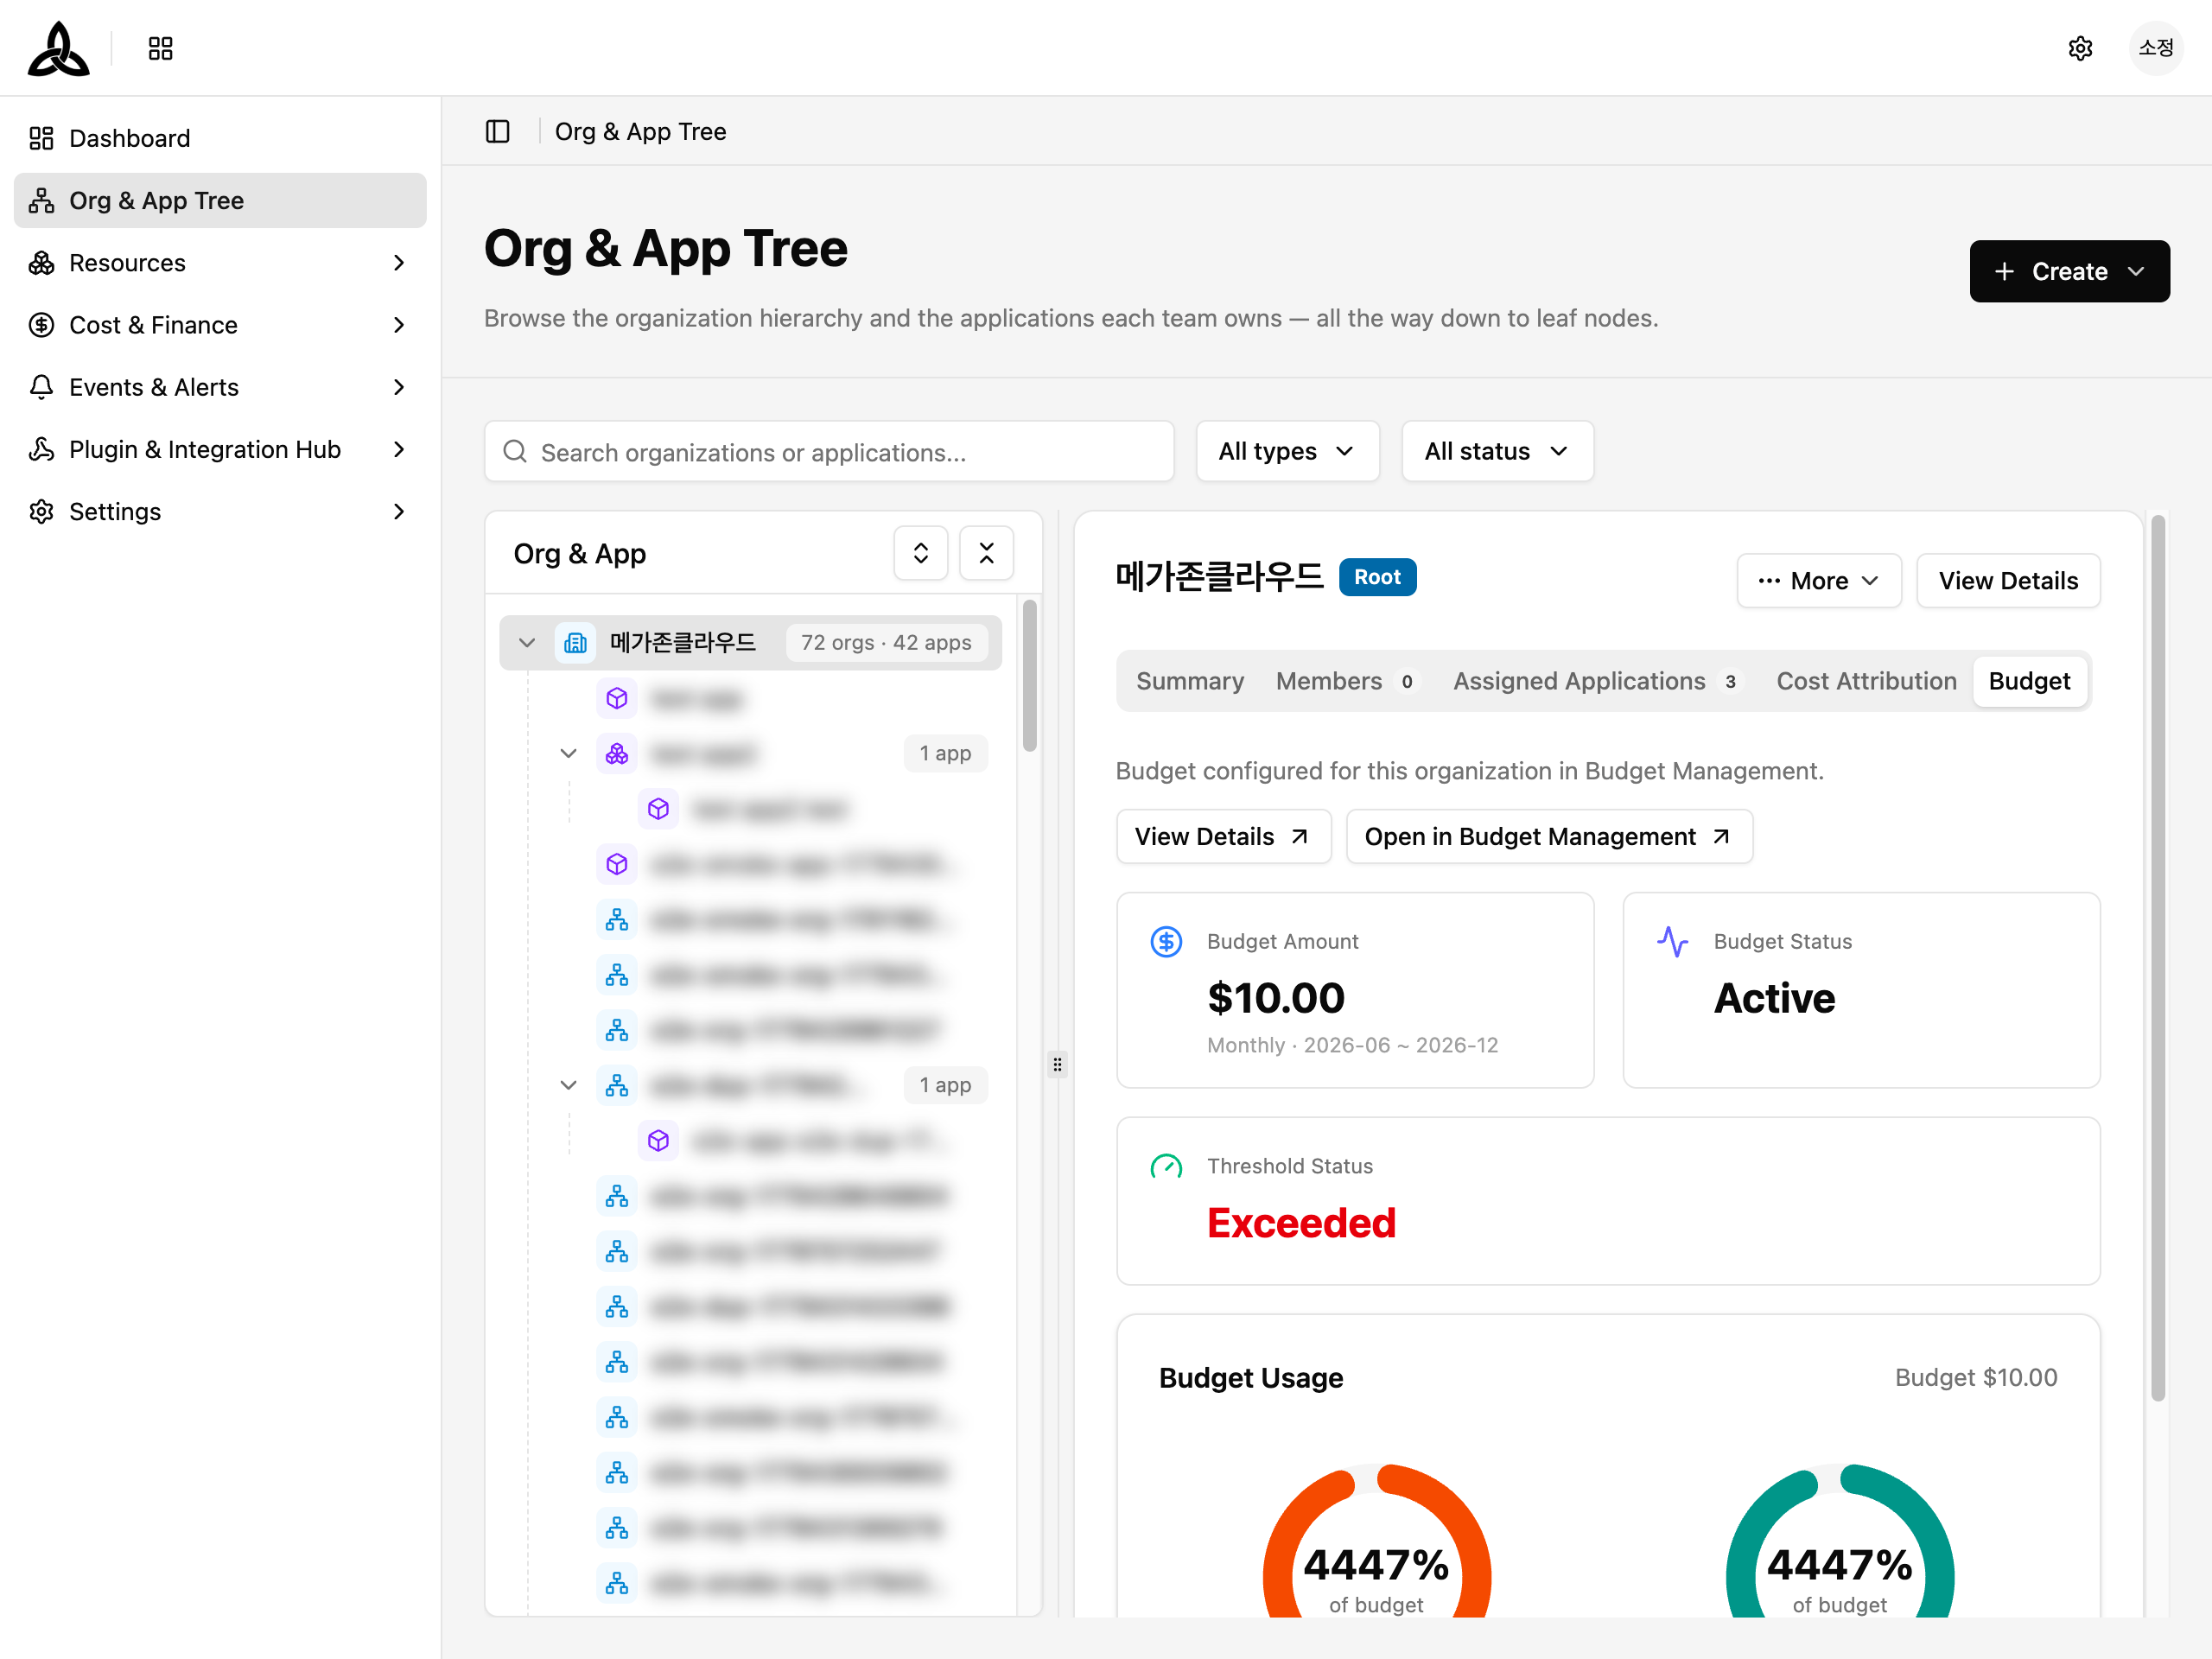
Click [View Details] to navigate to the full organization detail page.
Selecting an Application
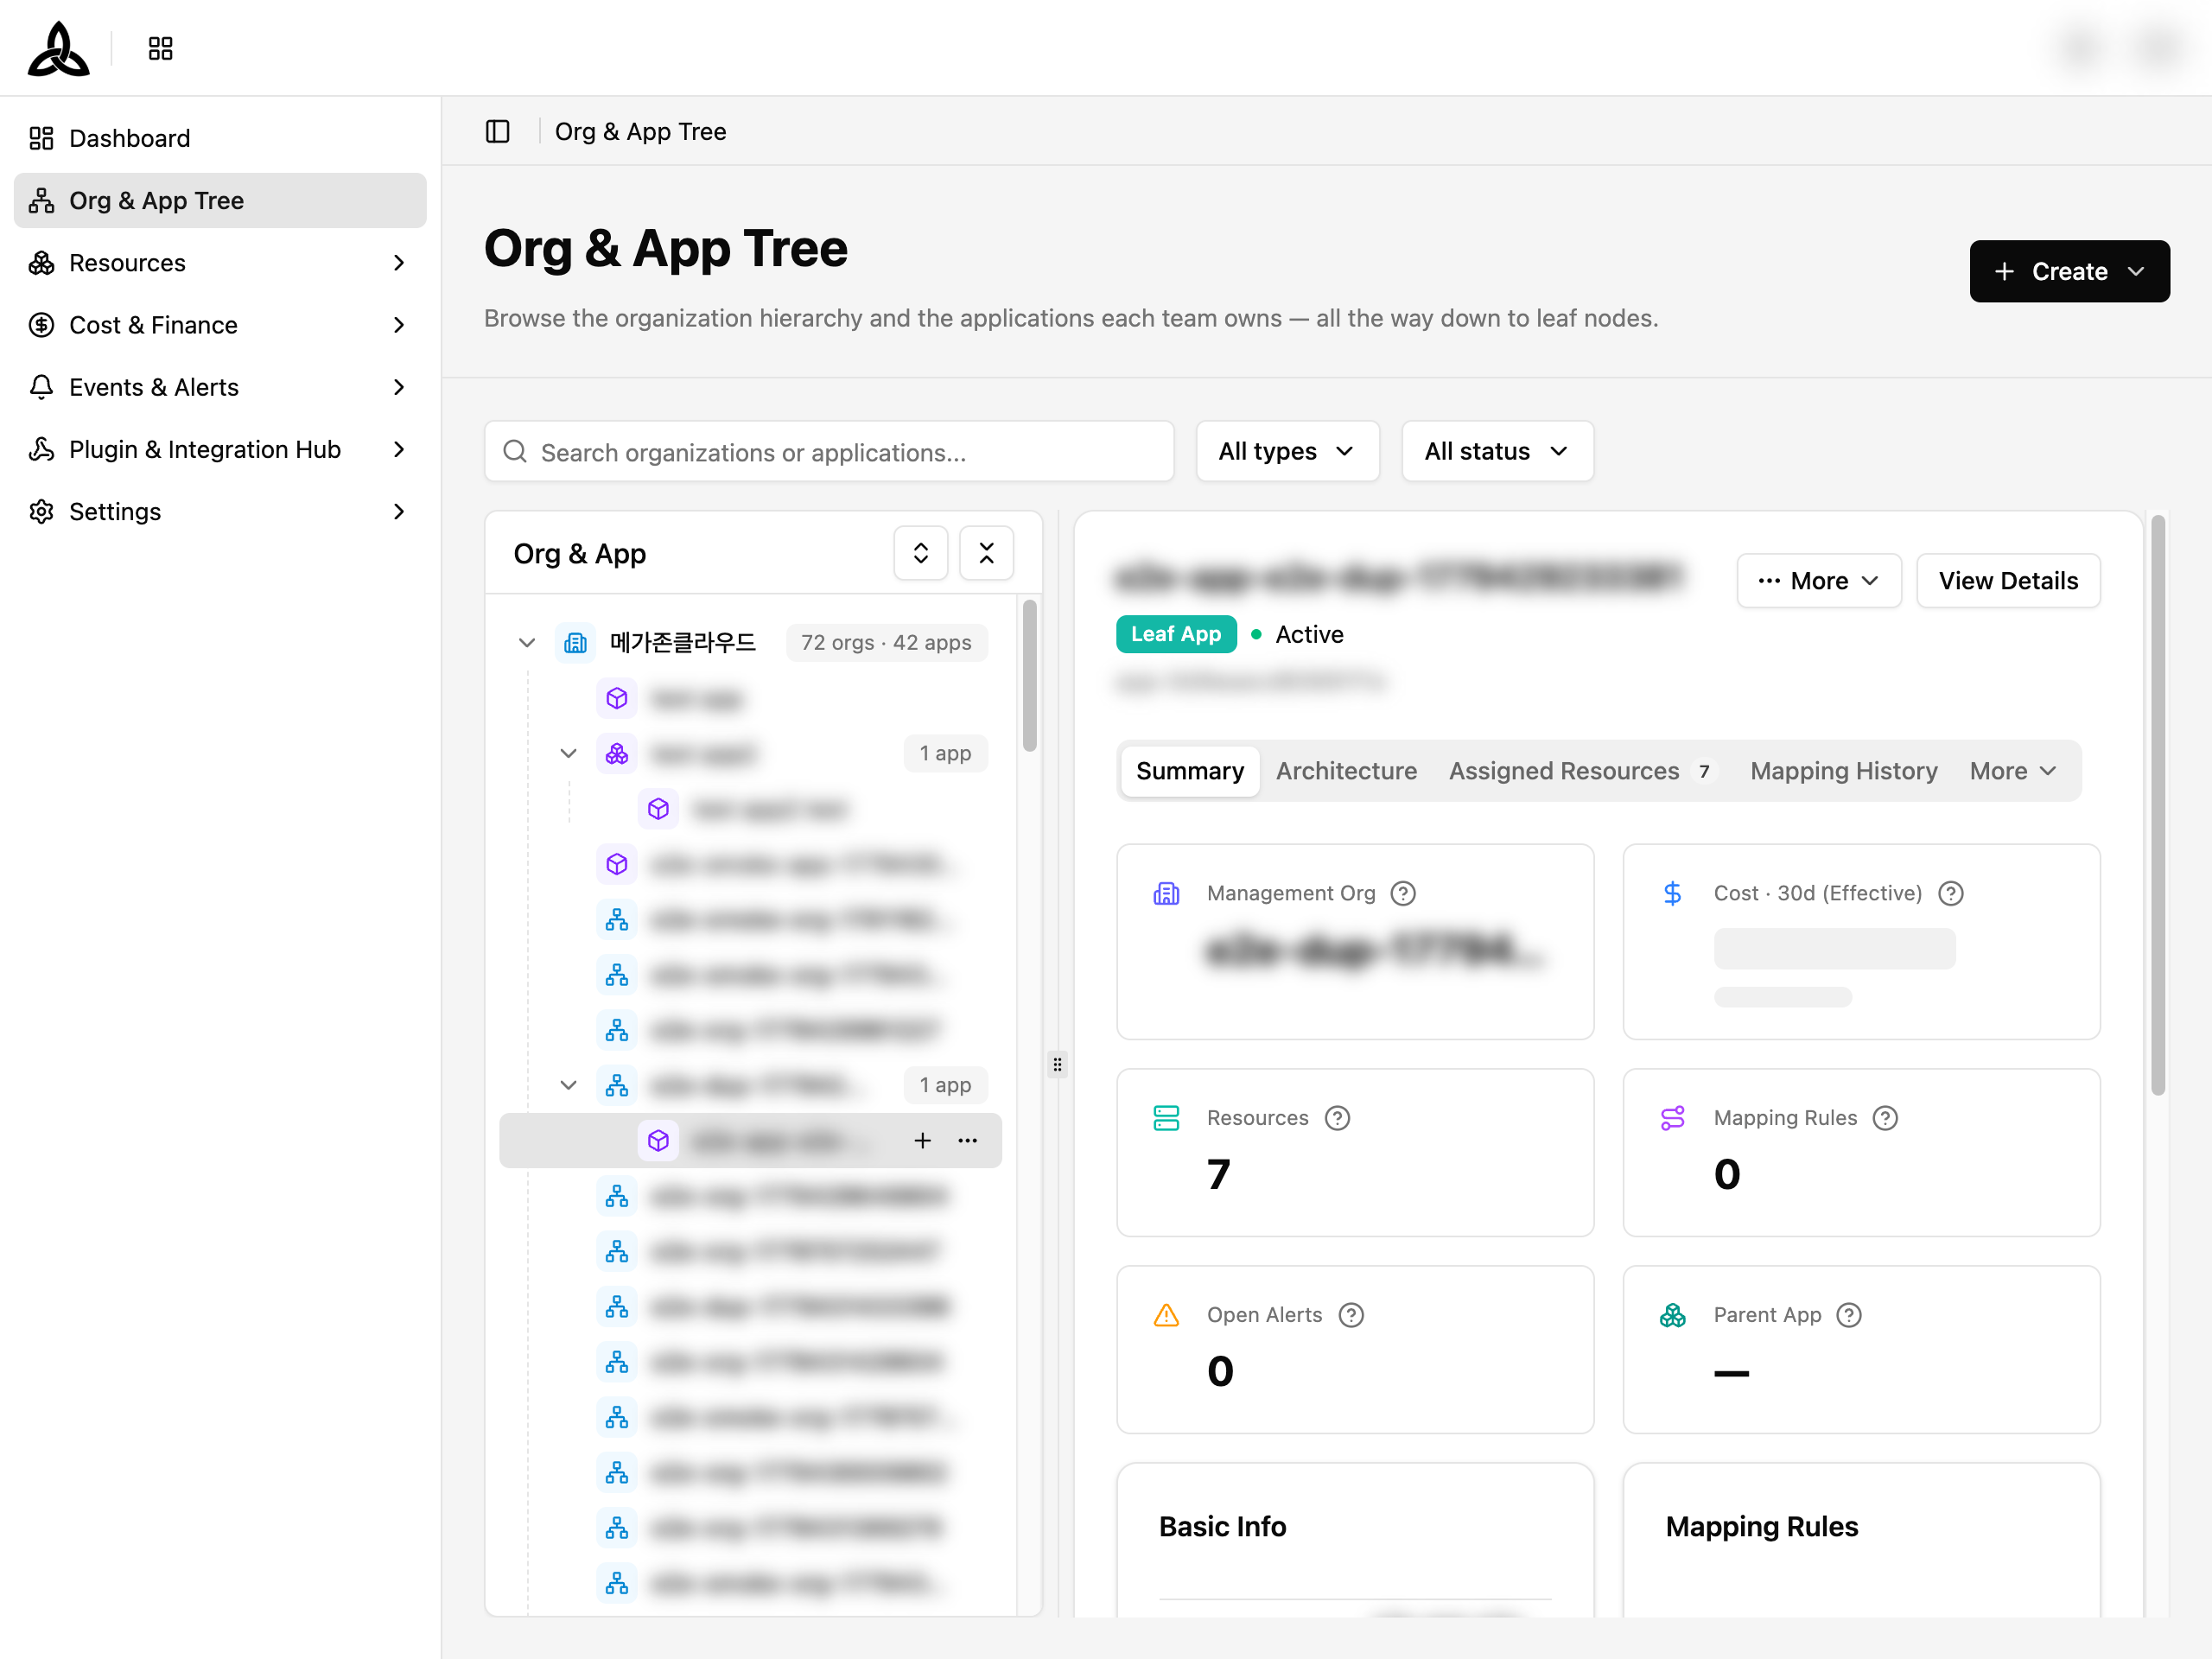
Click an application node in the tree to view its summary card. The card displays the application type badge (Leaf App or Parent App), status (Active / Inactive), and ID.
Summary
Key metrics — Management Org, Cost (30d Effective), Resources, Mapping Rules, Open Alerts, Parent App. Basic Info and Mapping Rules section below.
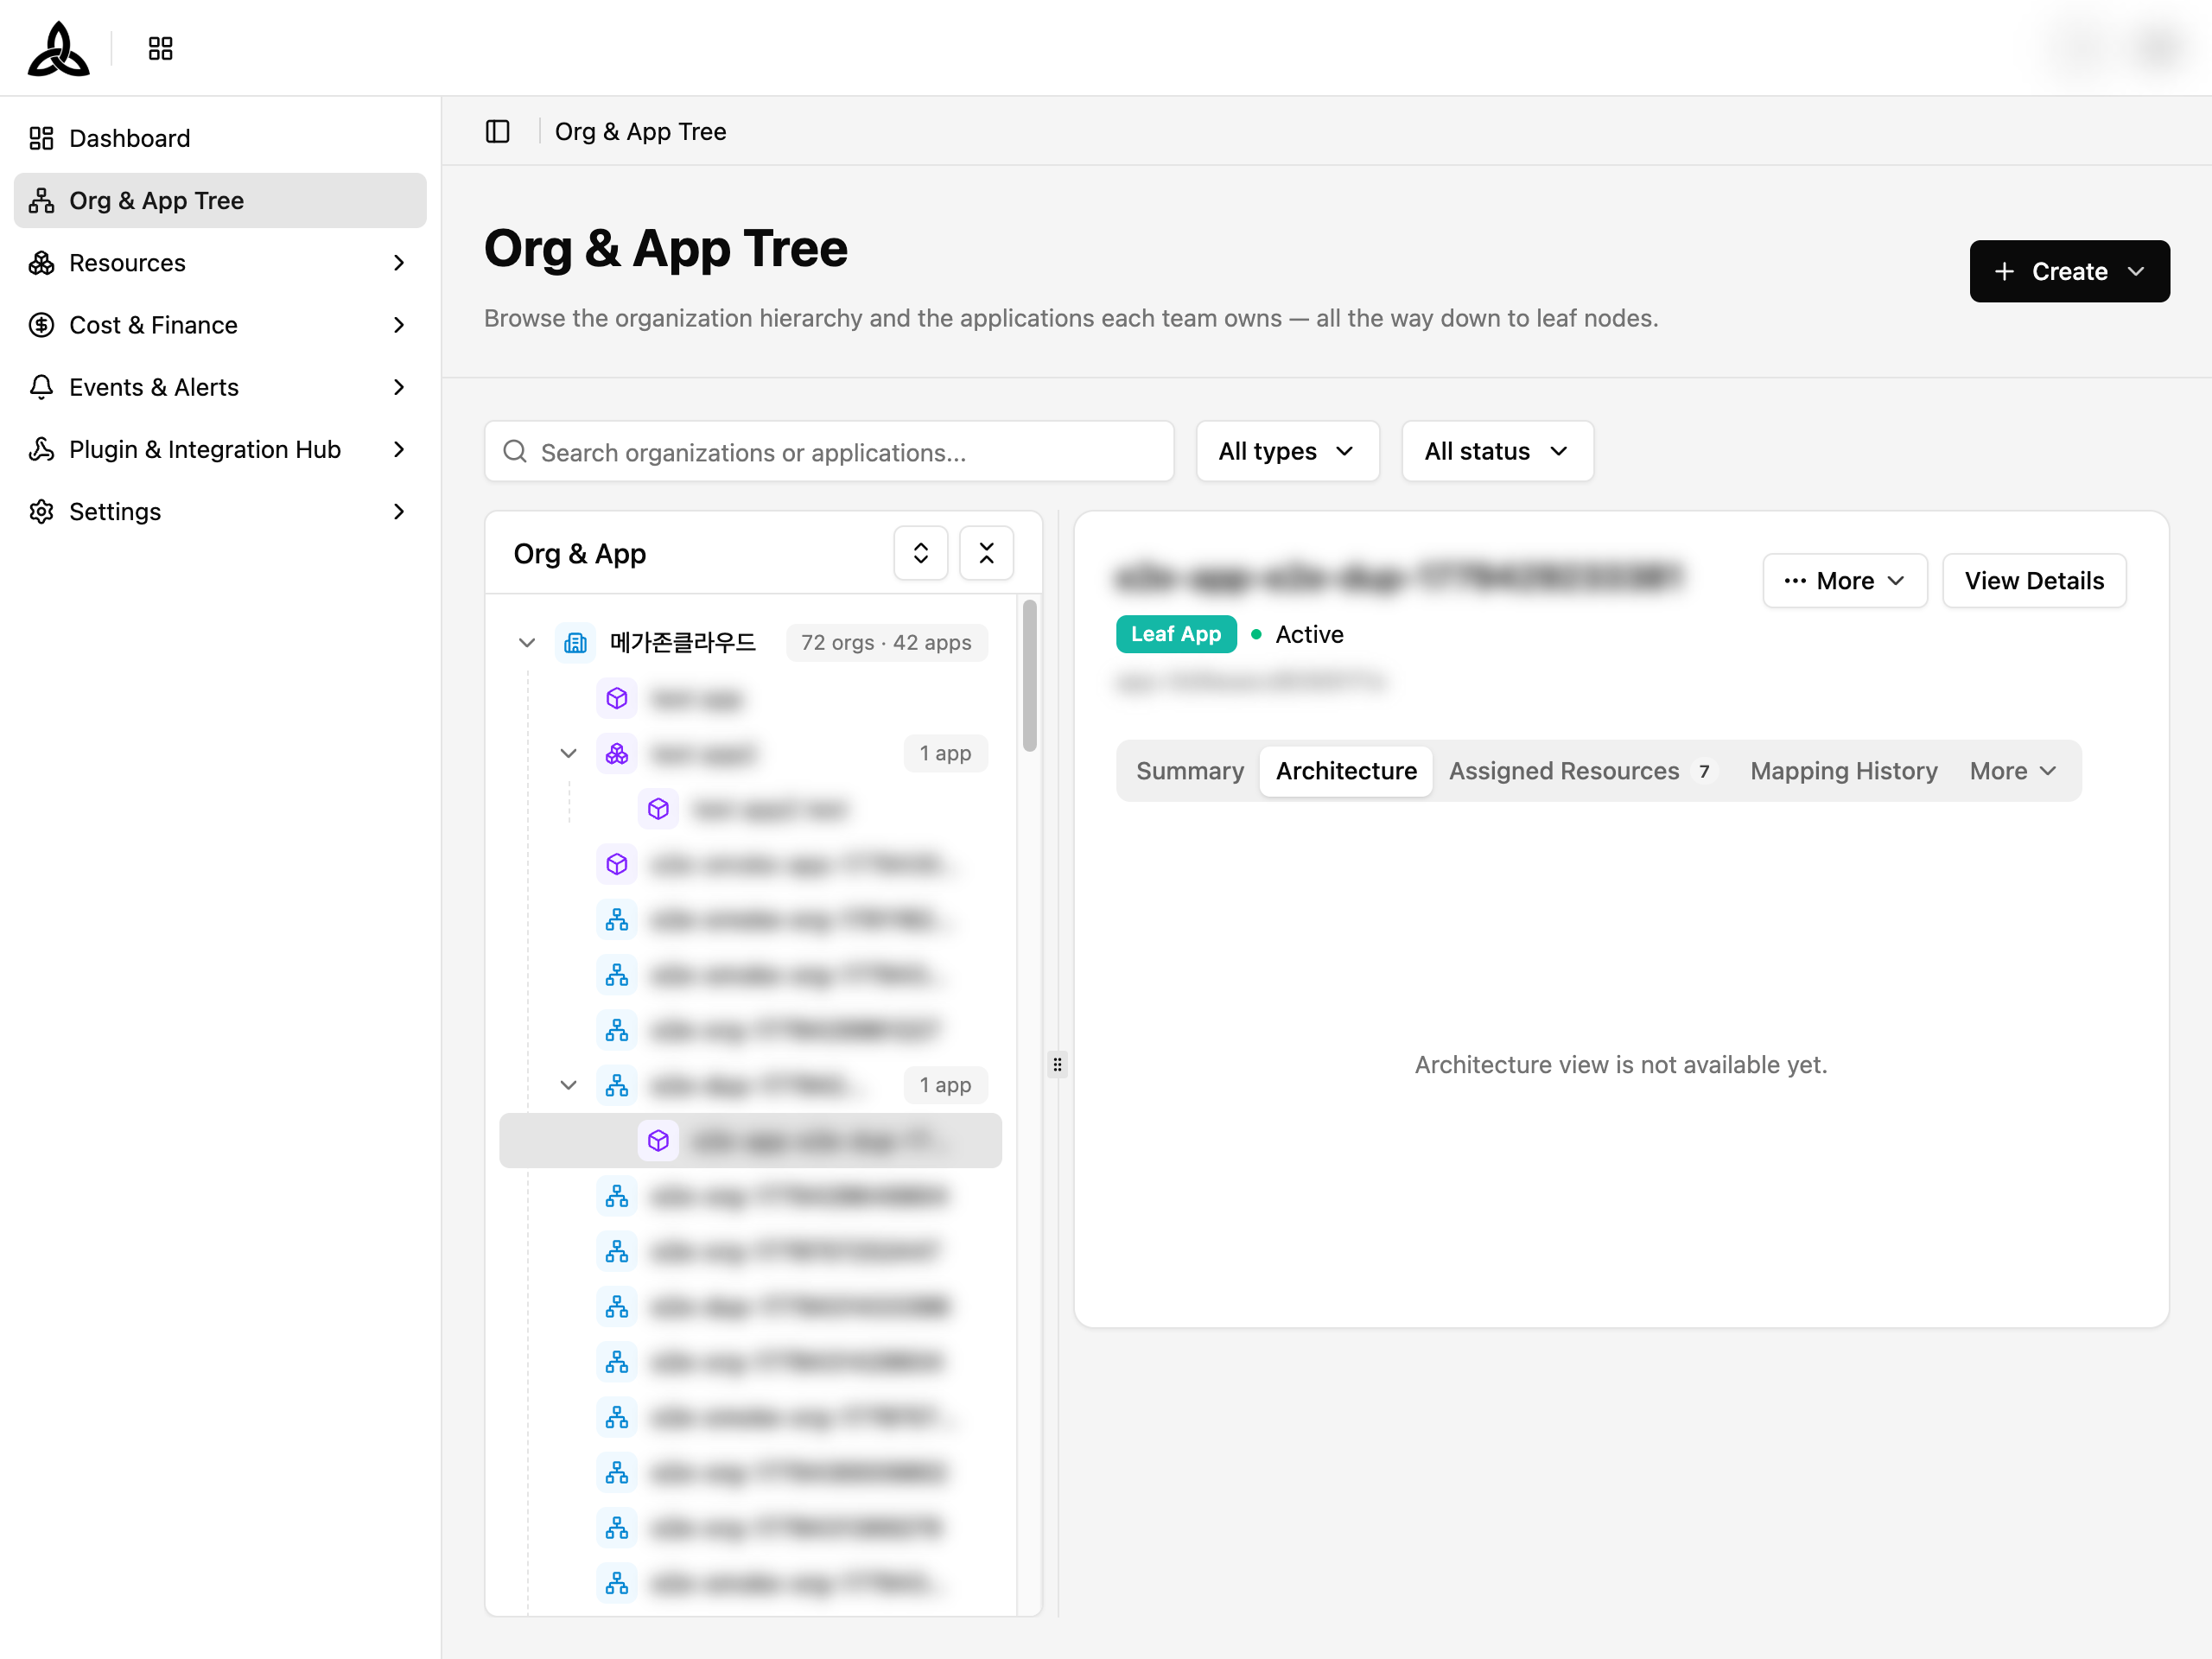
Architecture
Architecture topology view of the application’s resources. Shows the network relationship graph between resources mapped to this application.
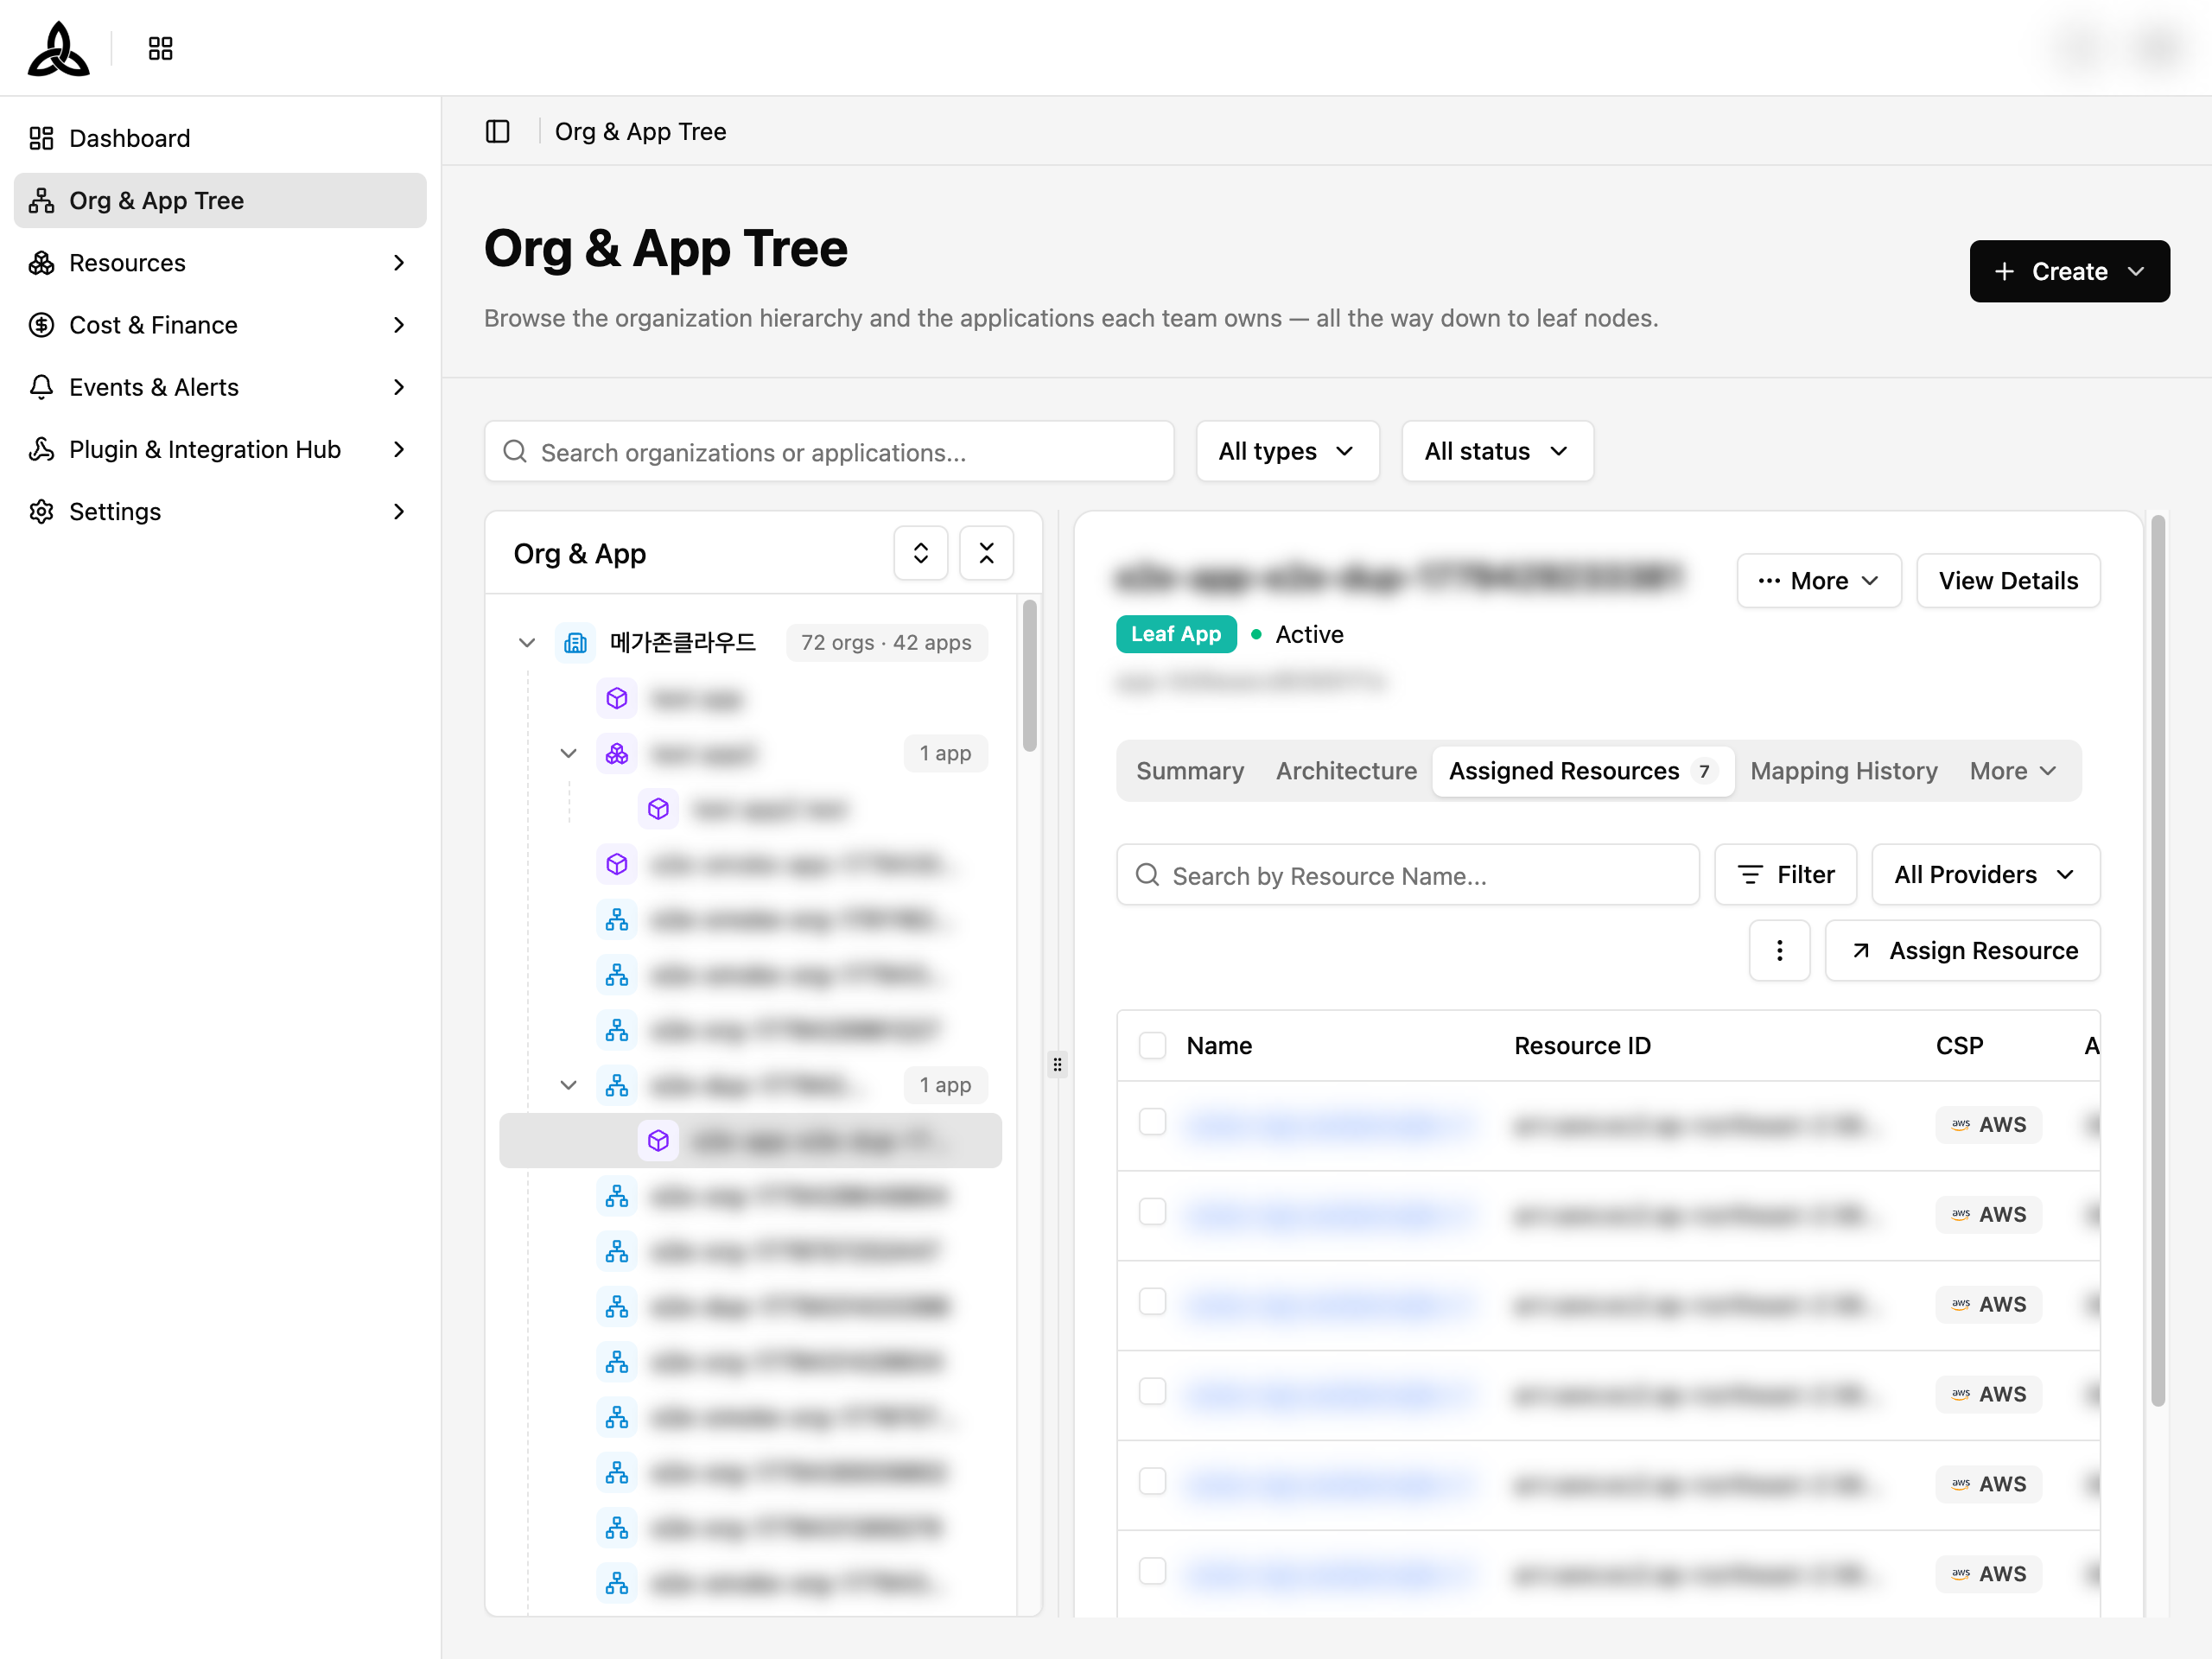
Assigned Resources
Resources mapped to this application. Search by resource name, filter by provider, and assign new resources with [Assign Resource].
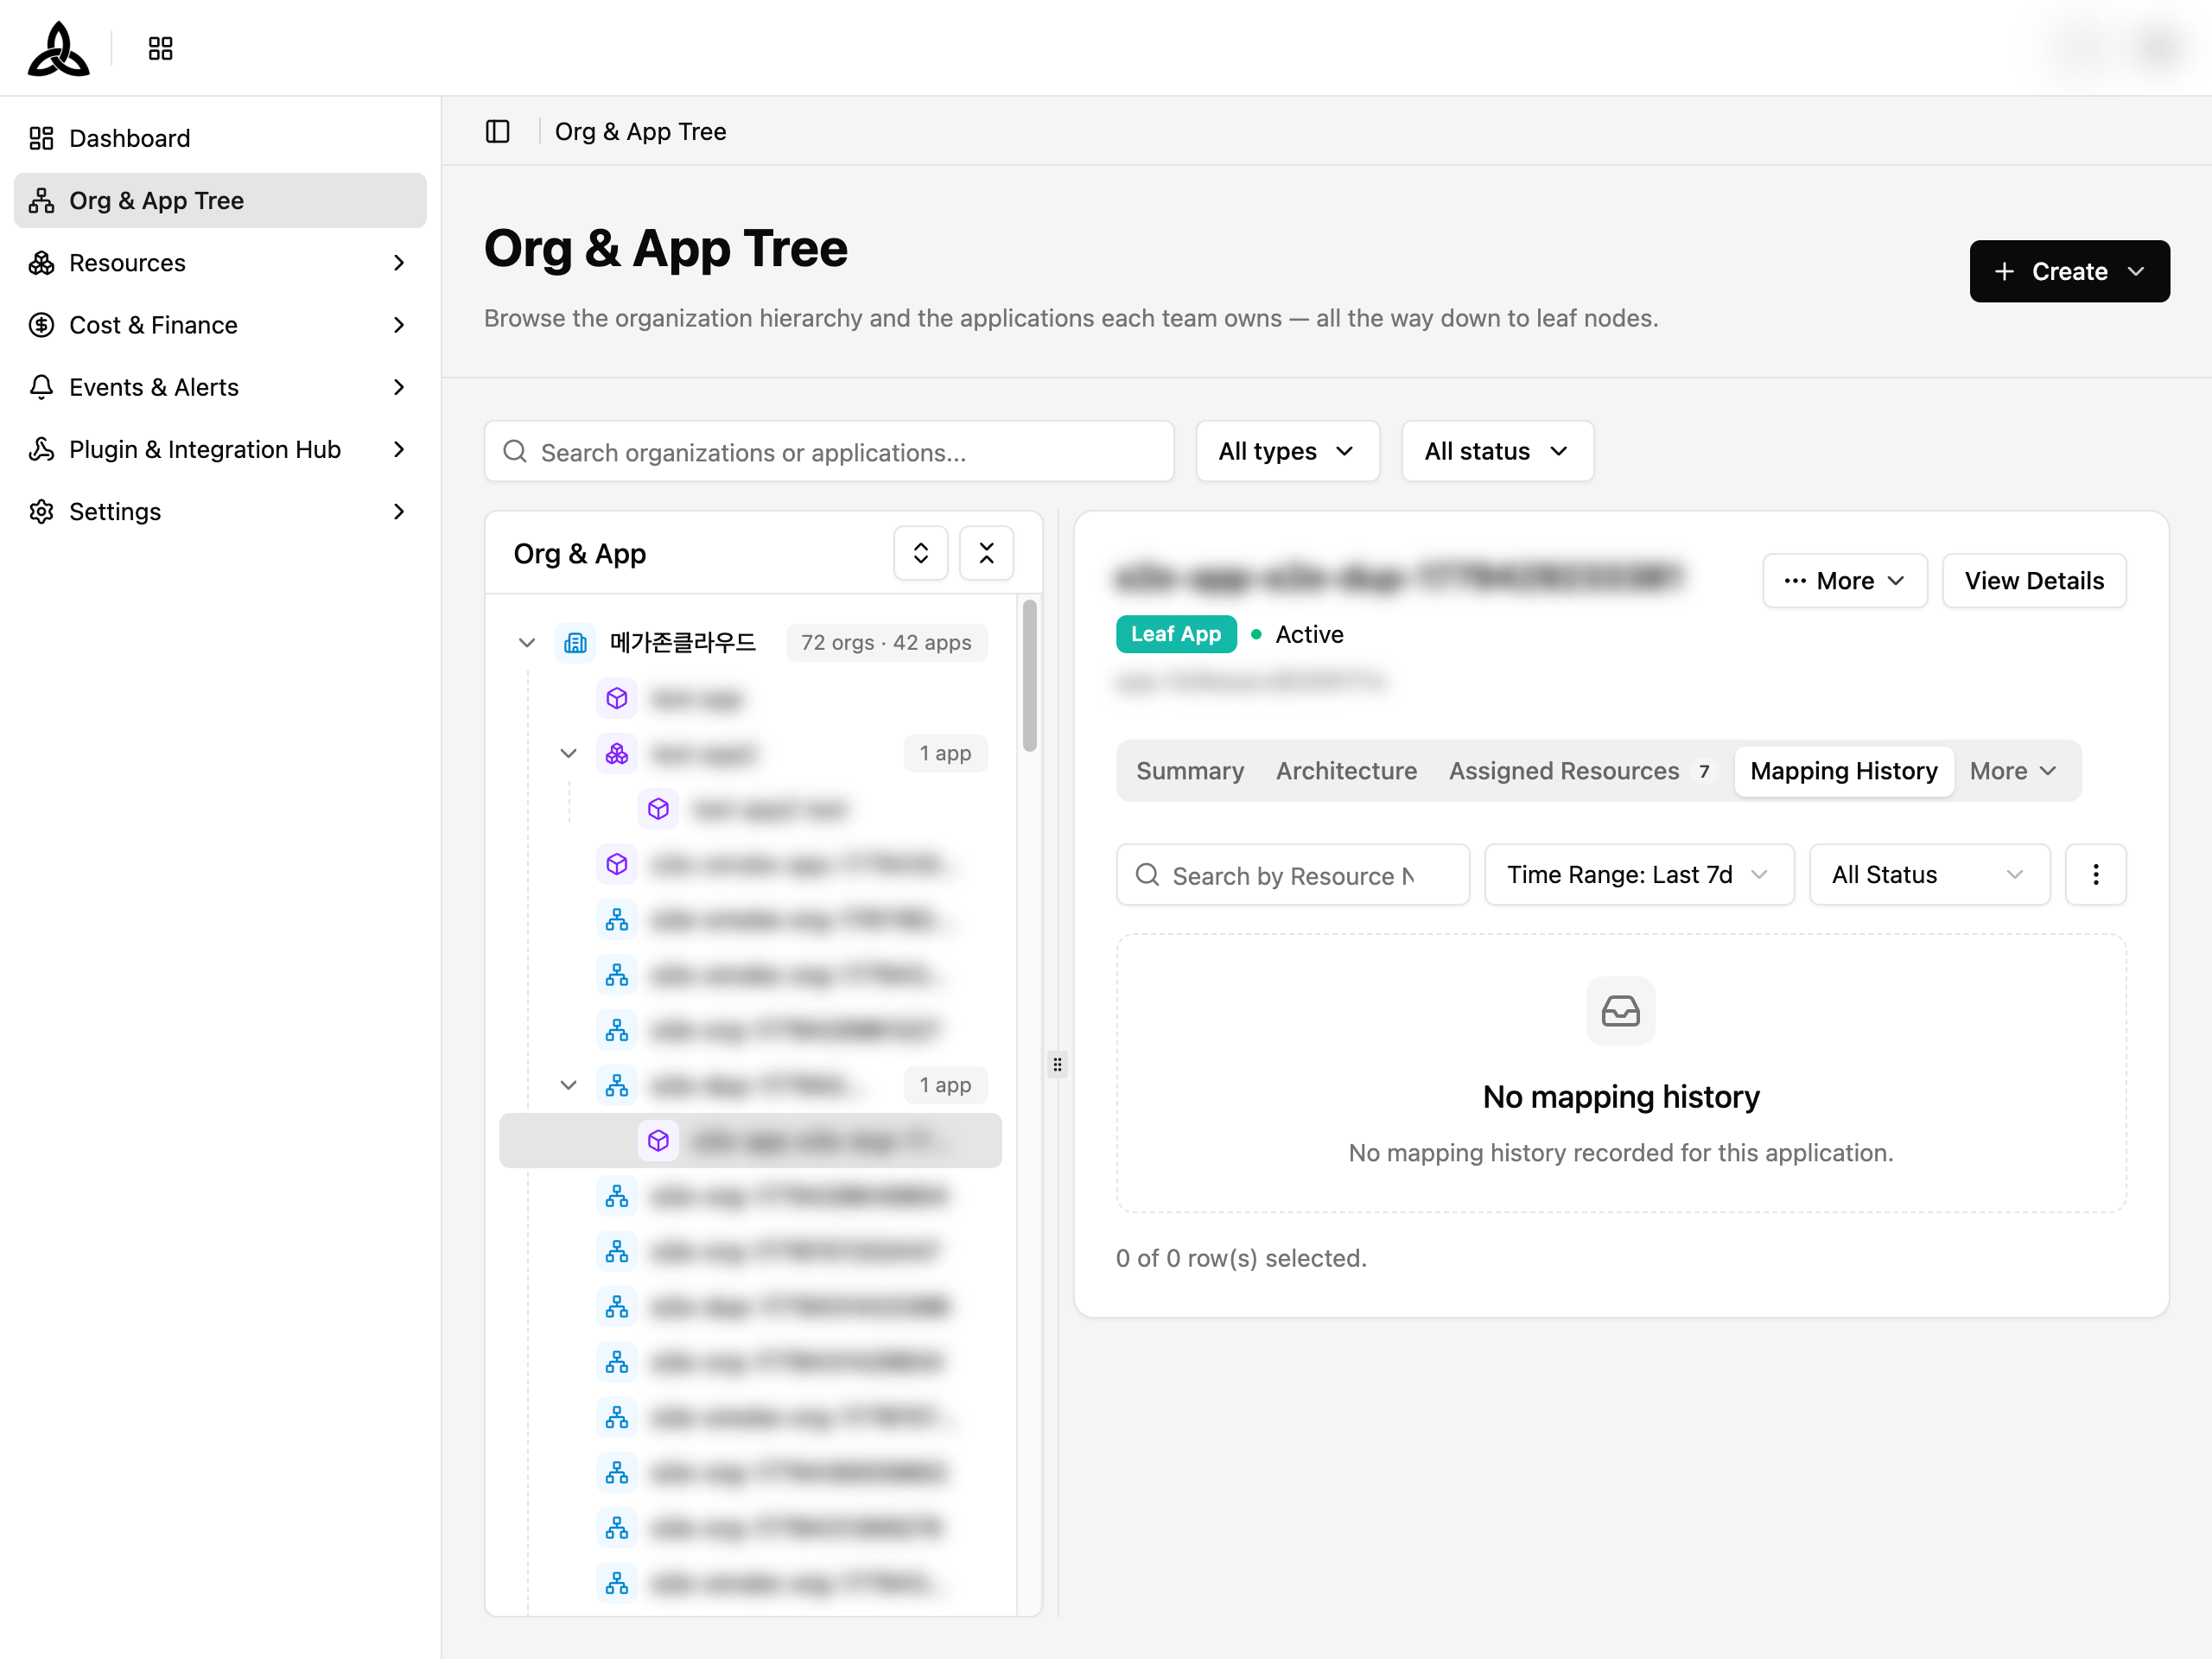
Mapping History
History of resource mapping changes for this application.
Click [View Details] to navigate to the full application detail page.
Creating an Organization
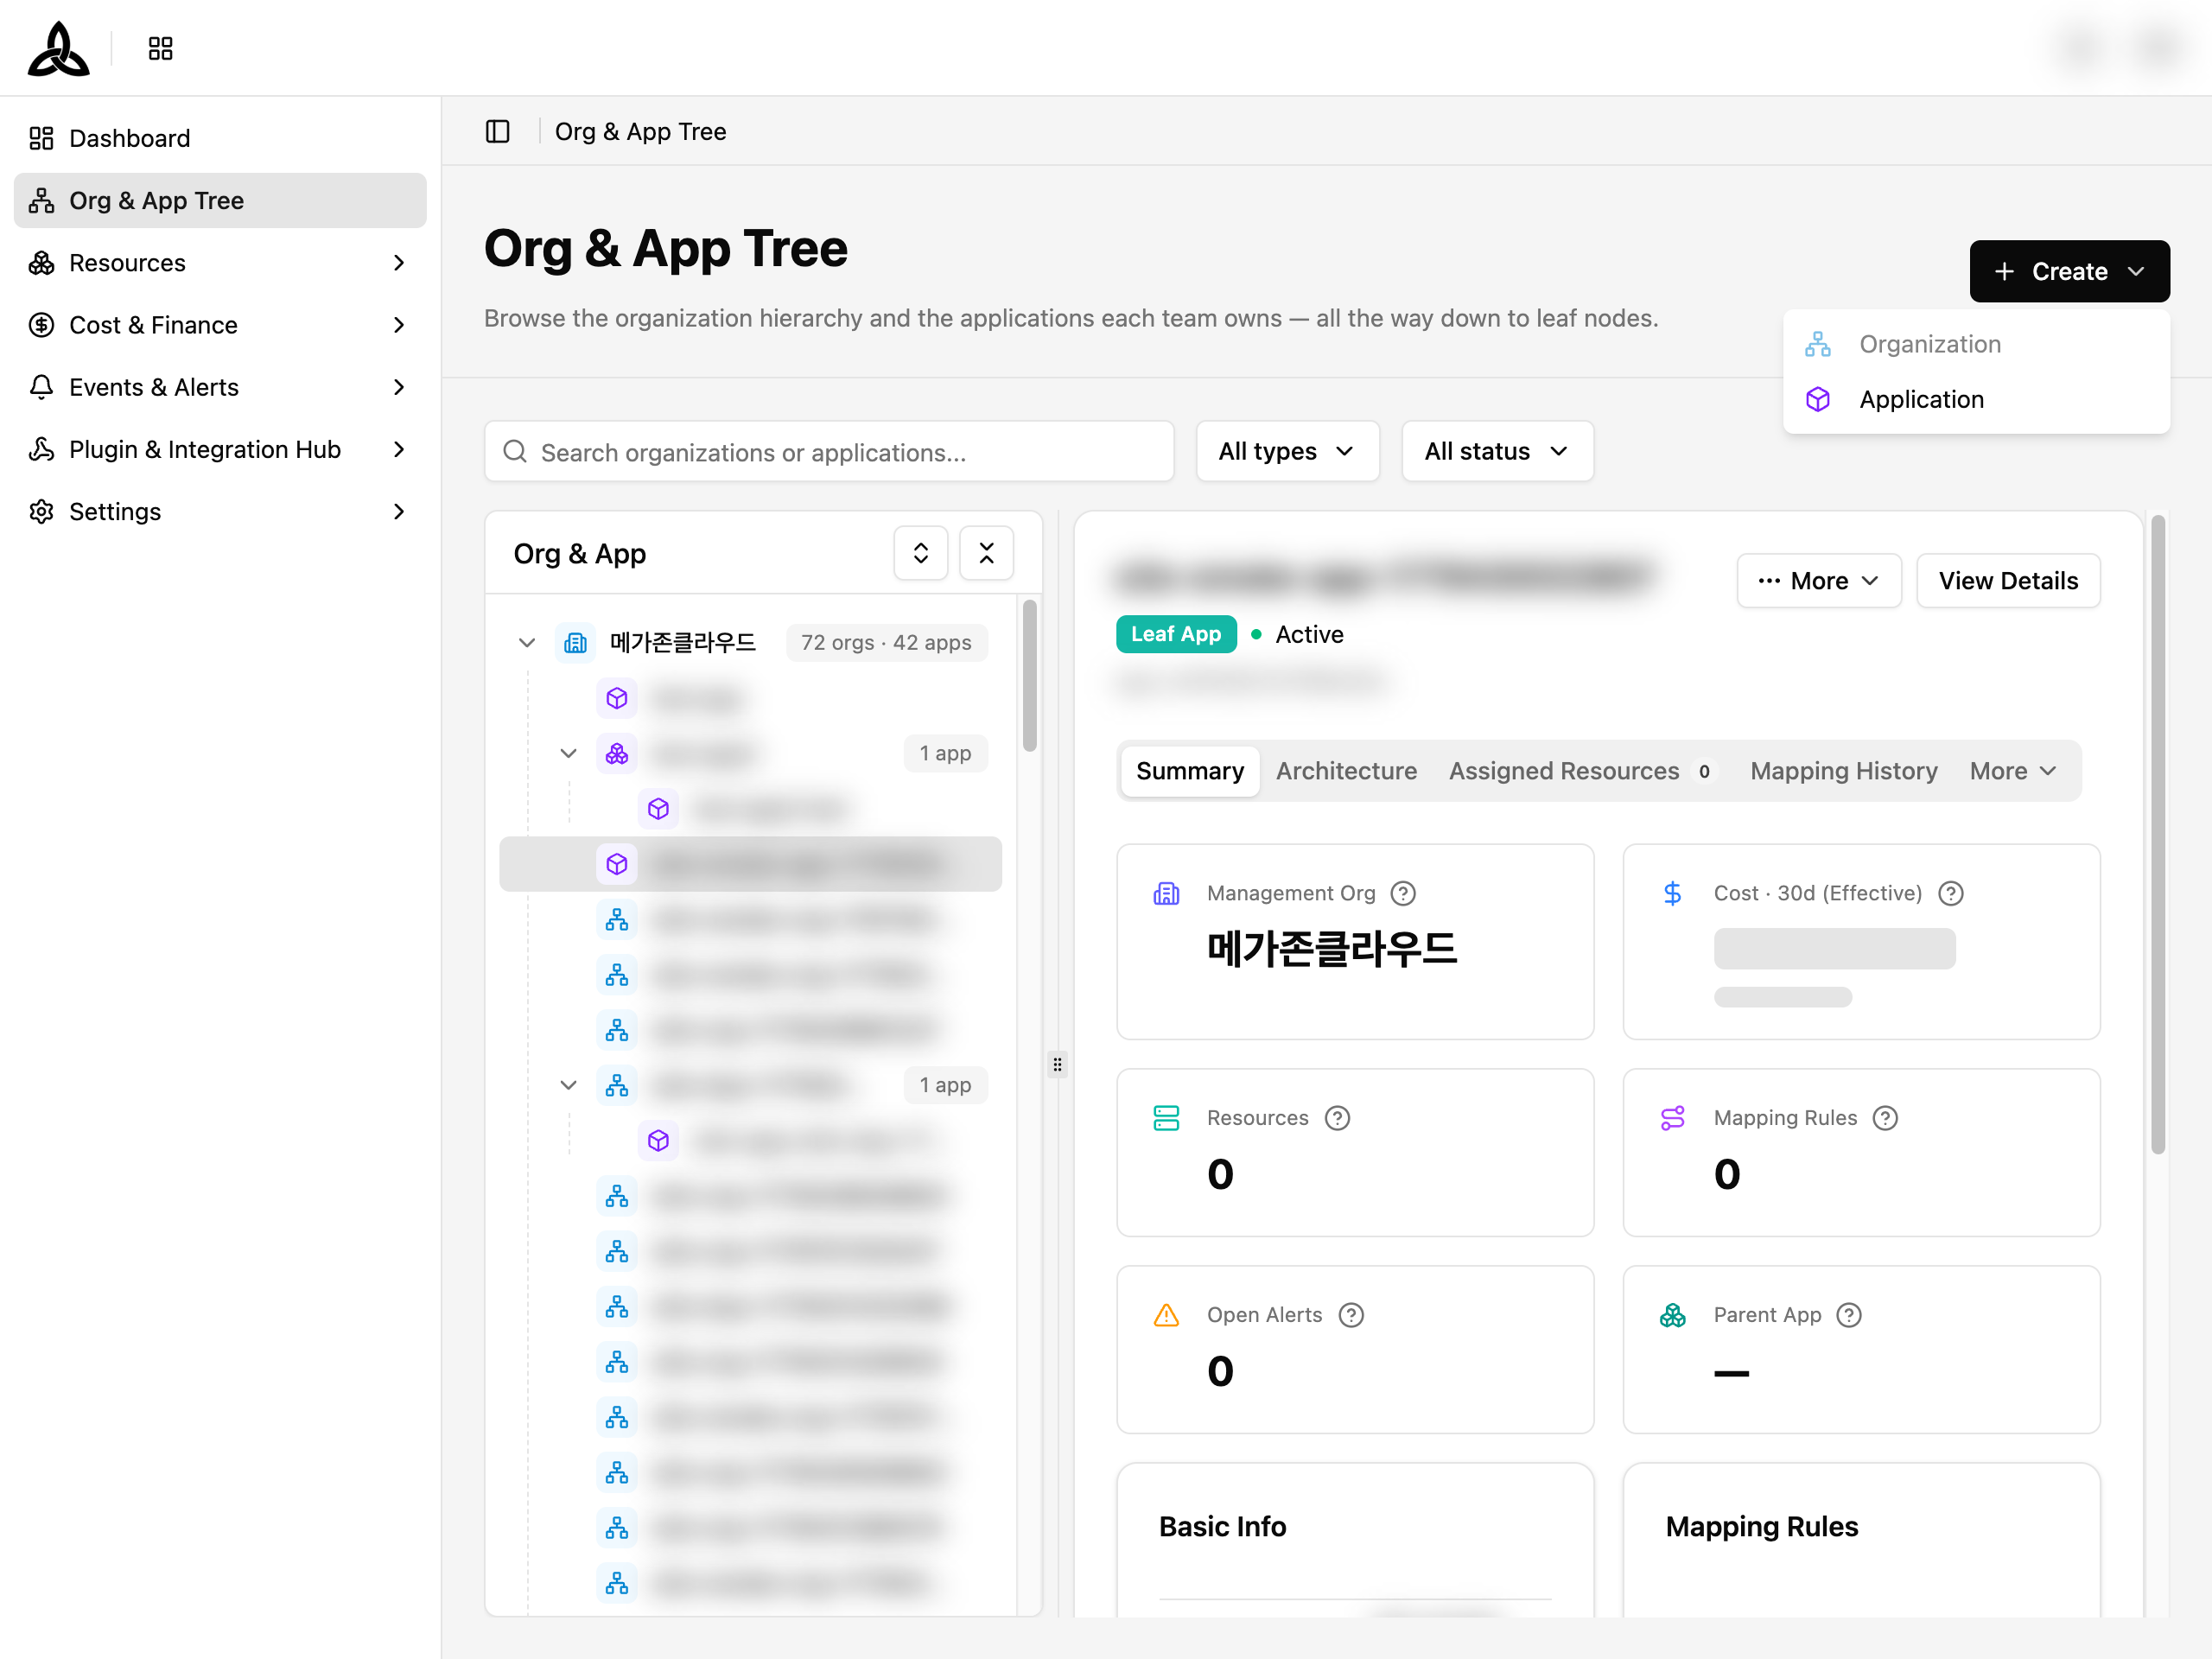
Click [+ Create] and select Organization
Click the [+ Create] button at the top right, then select Organization.
Fill in the organization details
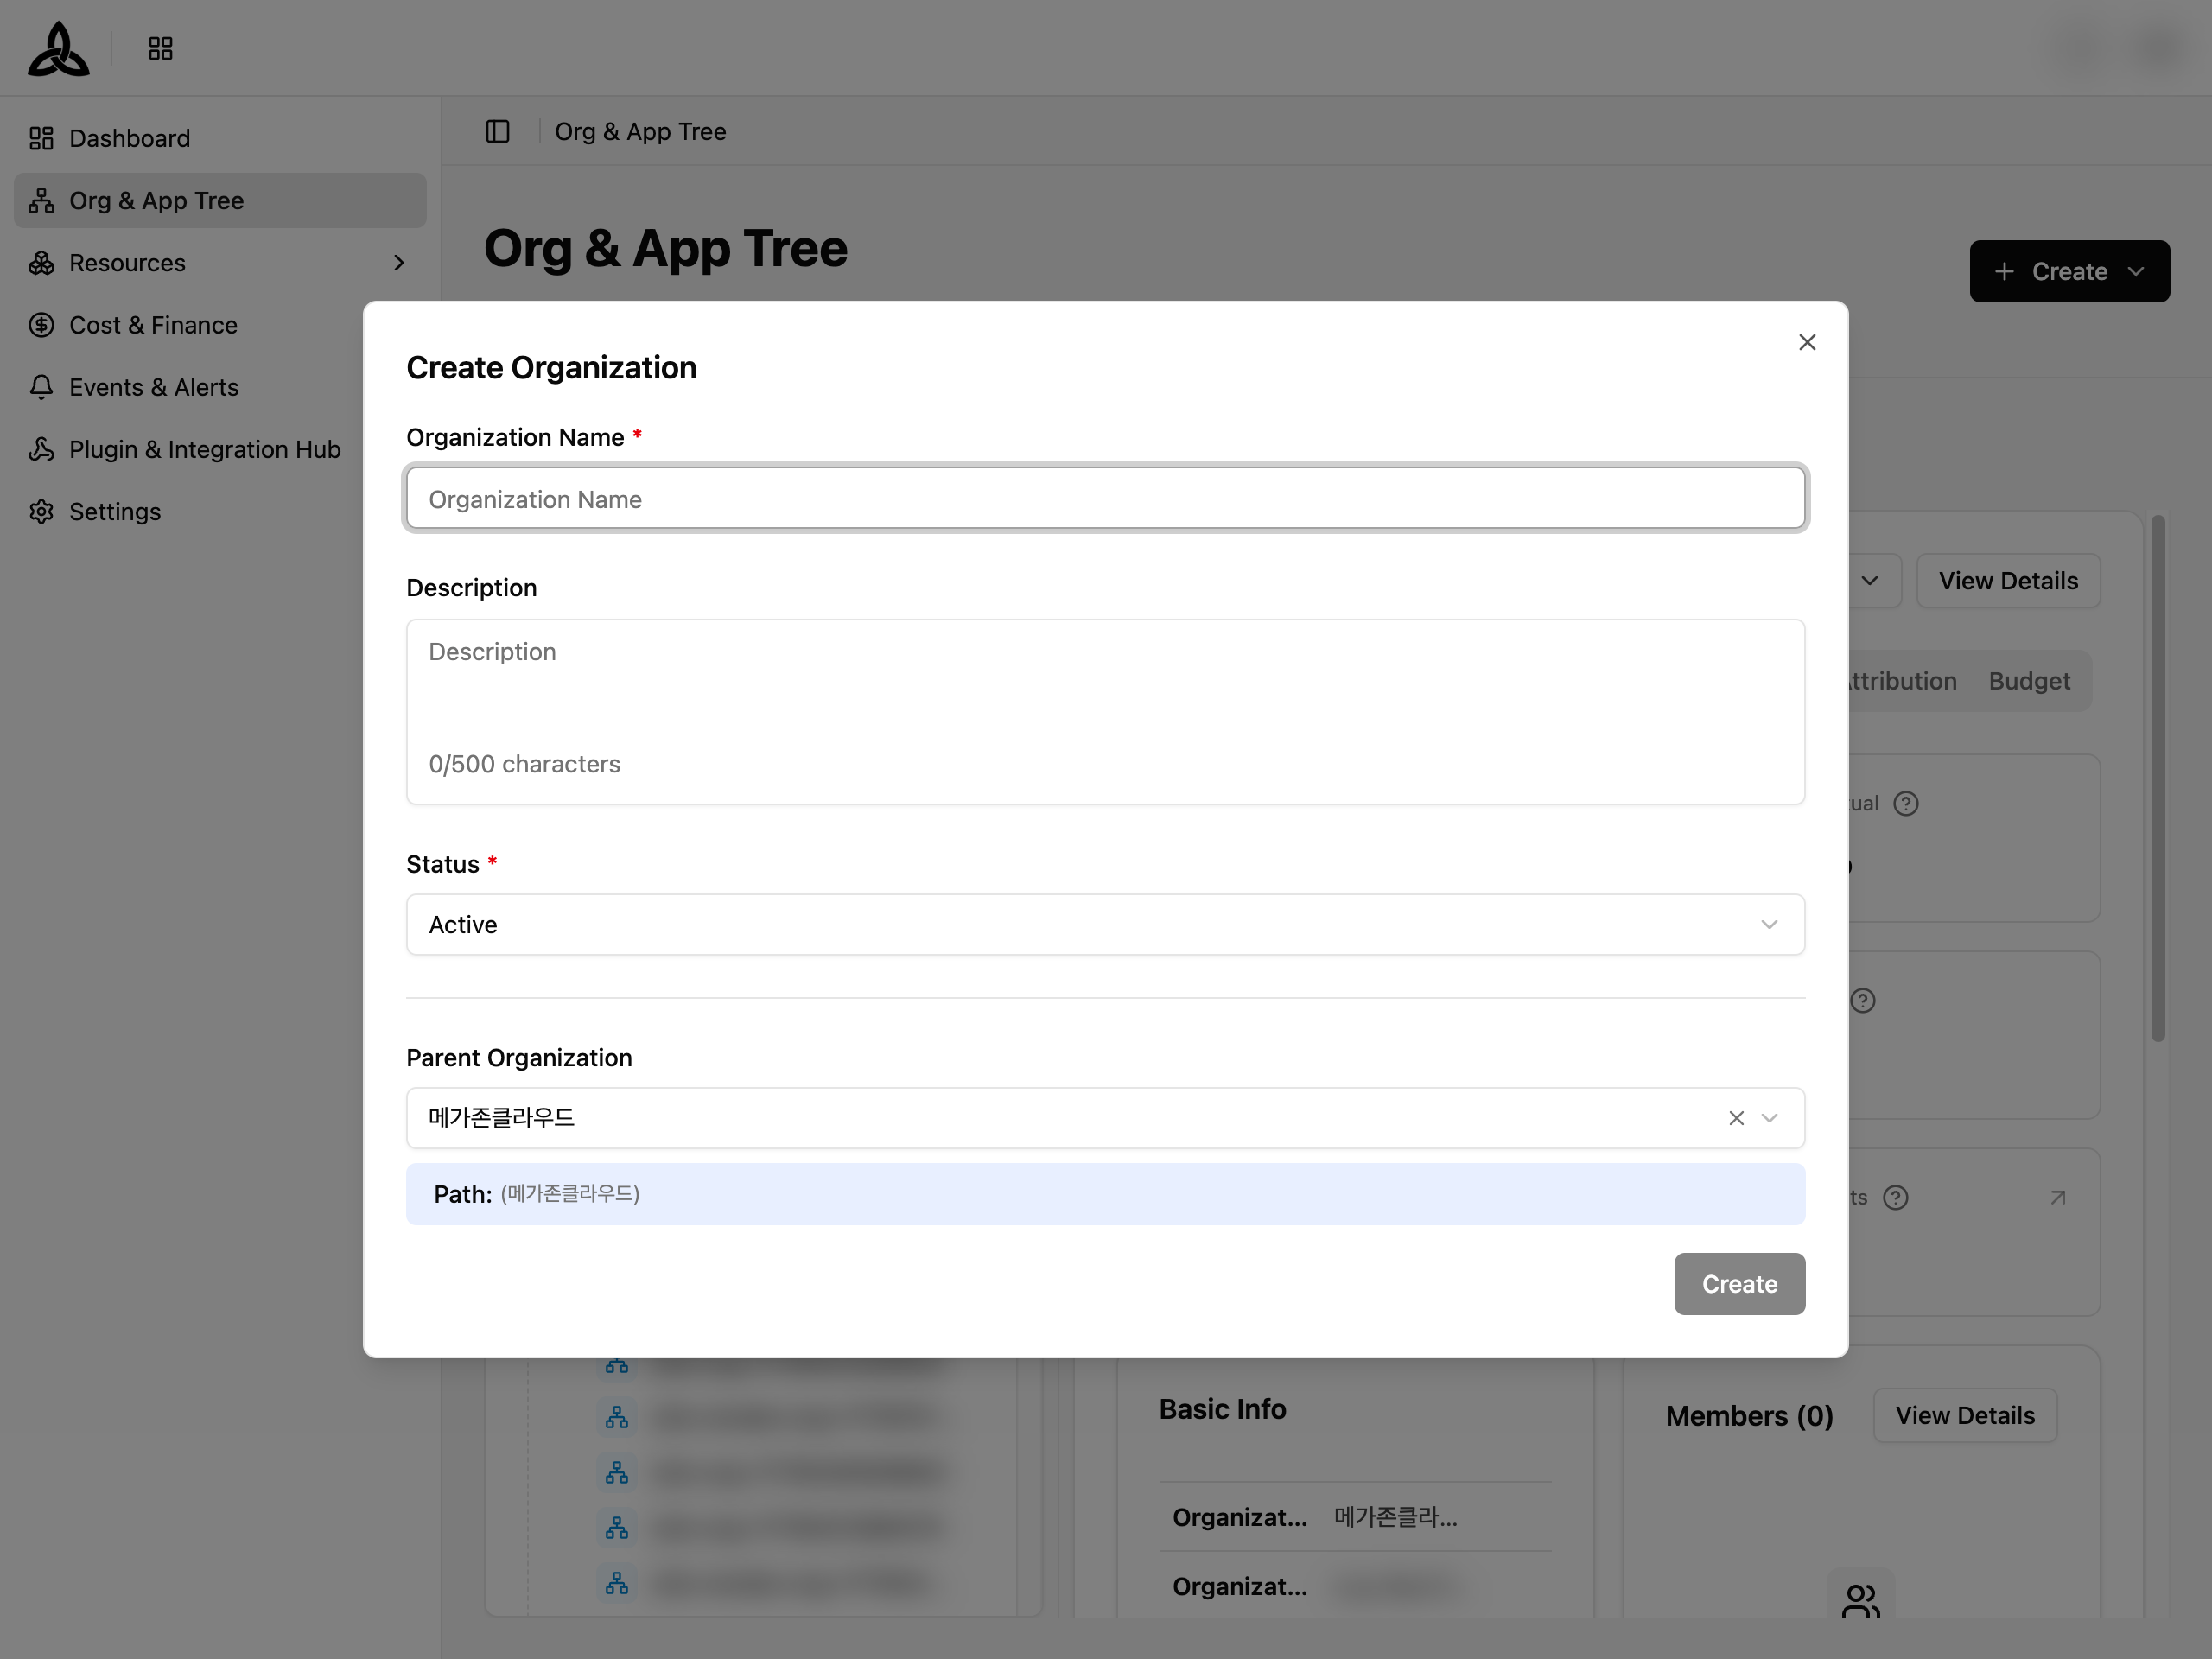
| Field | Required | Description |
|---|---|---|
| Organization Name | Yes | Name of the new organization |
| Description | No | Purpose or description (max 500 characters) |
| Status | Yes | Initial status — Active or Inactive |
| Parent Organization | No | Select a parent to nest under an existing organization. If omitted, created as a root organization |
The Path indicator below the parent selector shows the full hierarchy path.
Click [Create]
Click [Create] to save. The new organization appears in the tree.
Creating an Application
Click [+ Create] and select Application
Click the [+ Create] button at the top right, then select Application.
Fill in the application details
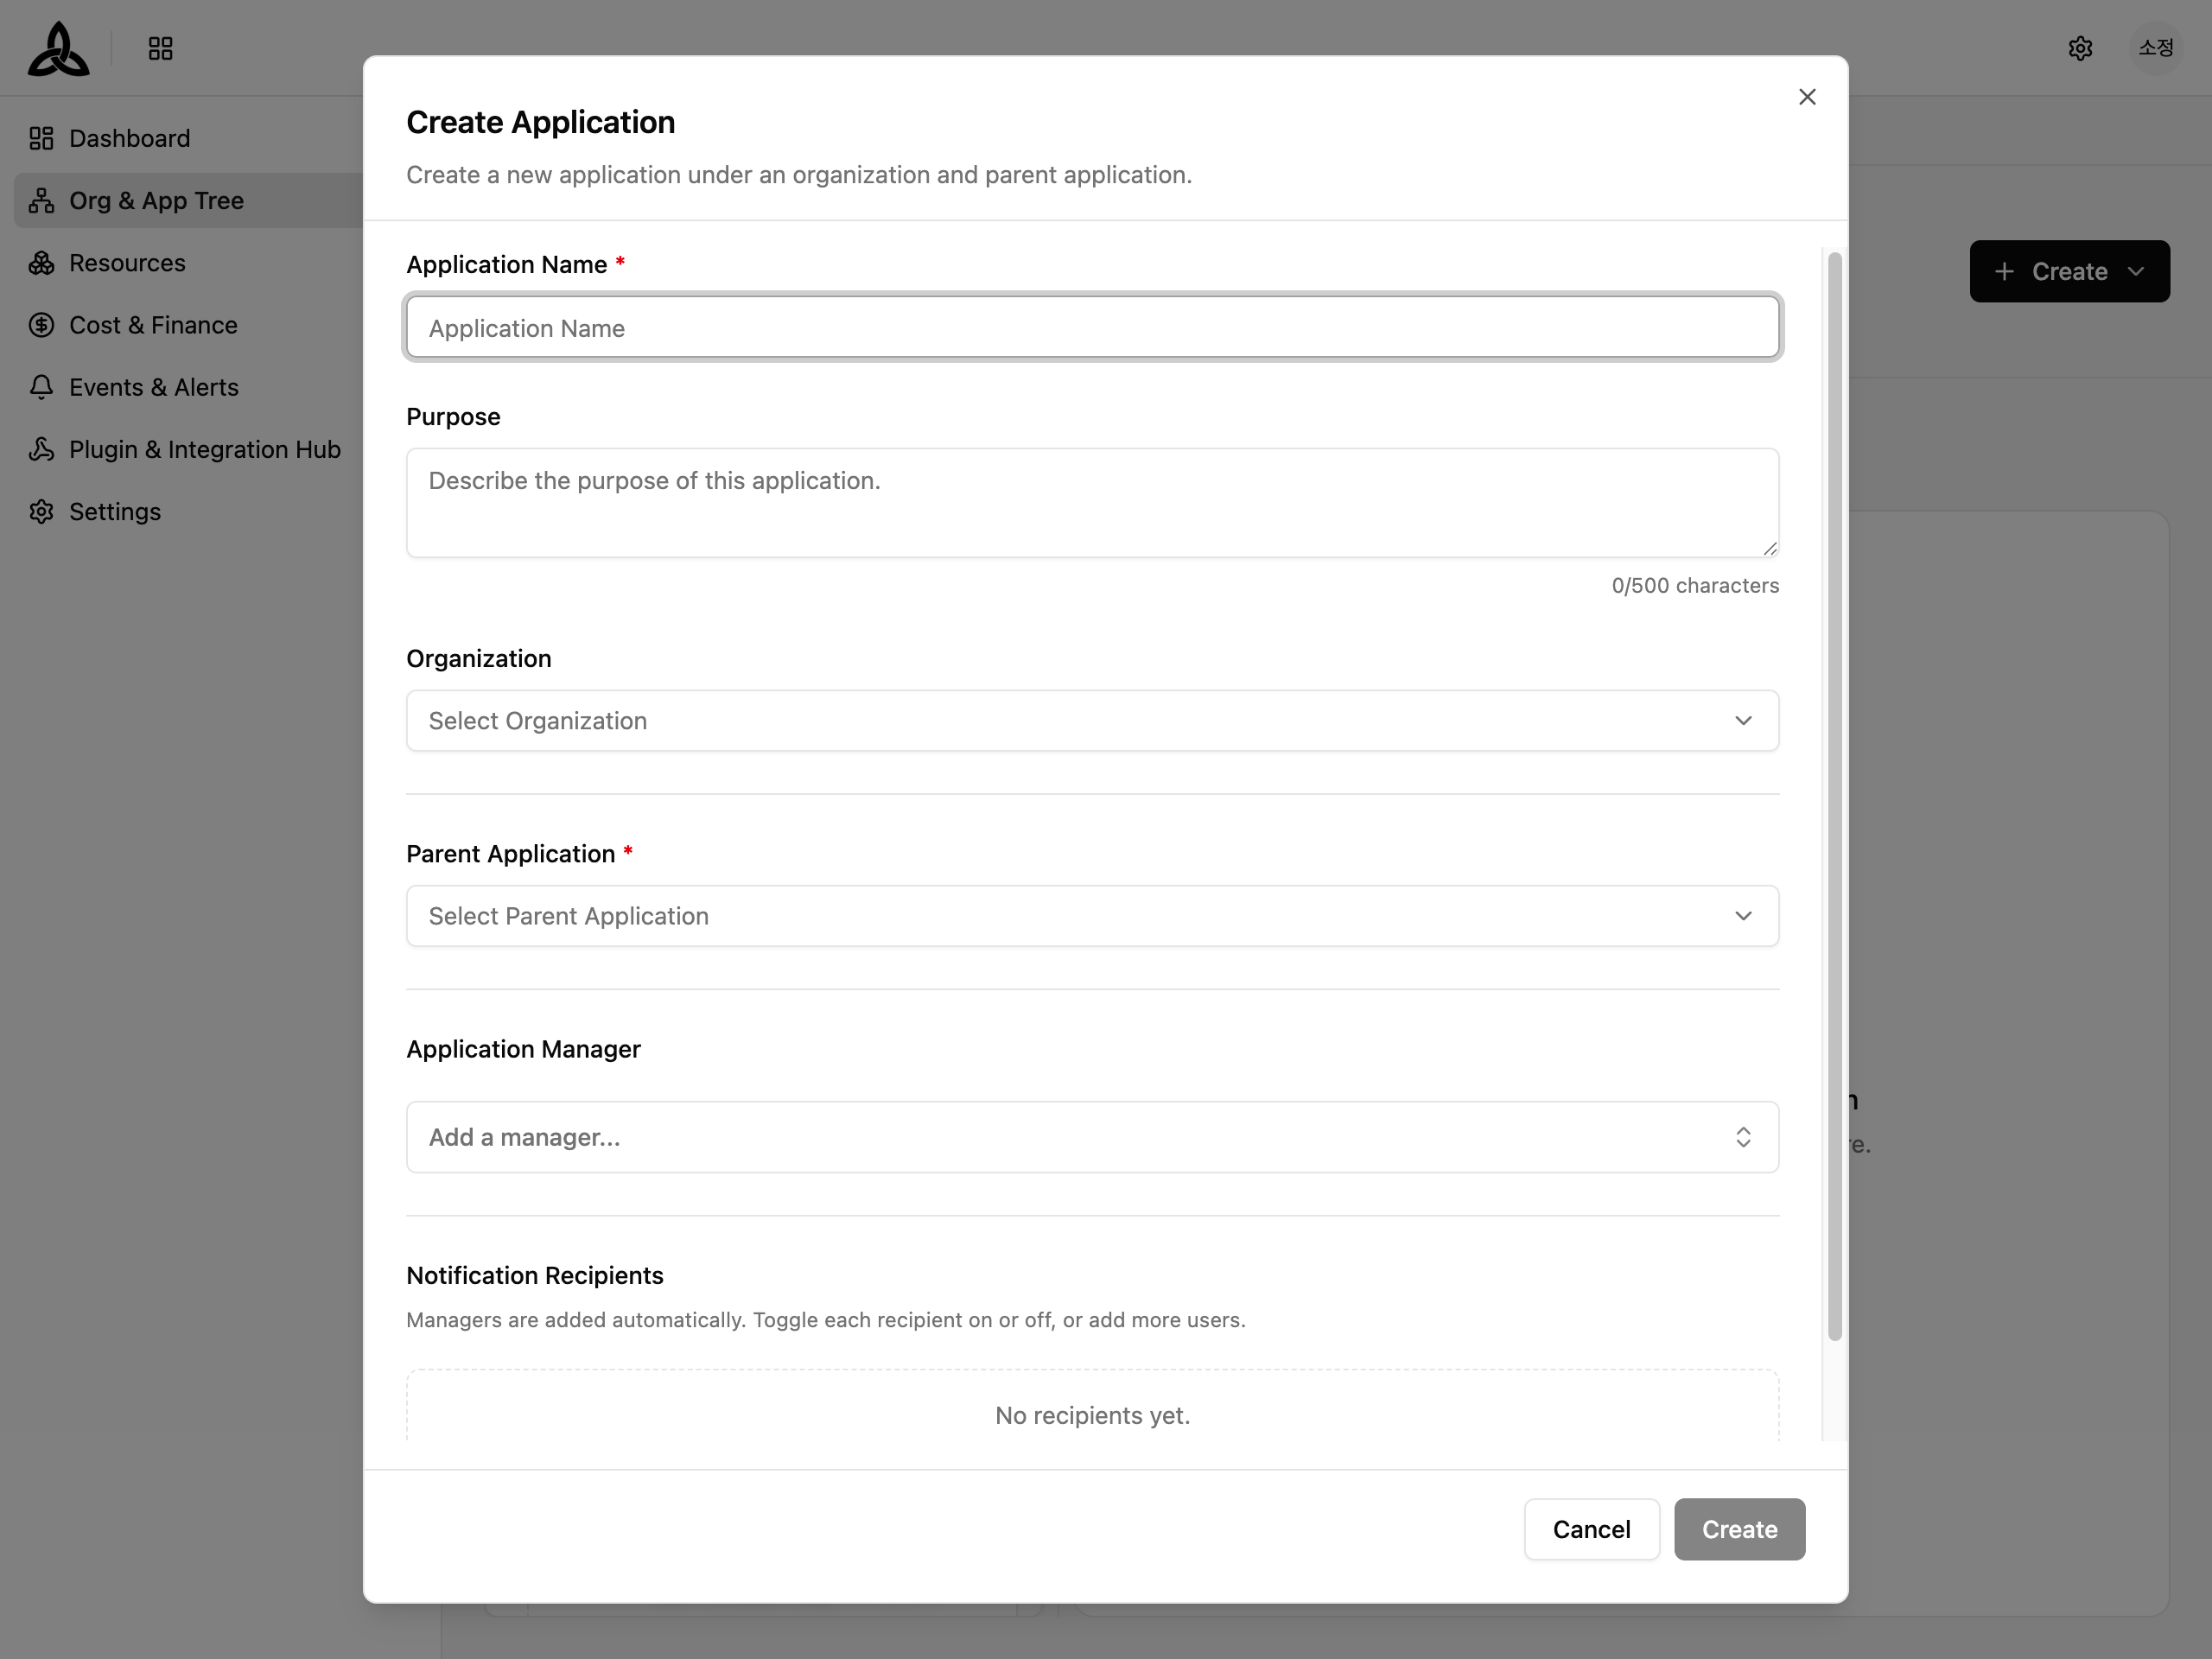
| Field | Required | Description |
|---|---|---|
| Application Name | Yes | Name of the new application |
| Purpose | No | Description of the application’s purpose (max 500 characters) |
| Organization | No | Select the owning organization |
| Parent Application | Yes | Select a parent application to nest under. Determines the tree position |
| Application Manager | No | Assign a manager for this application |
| Notification Recipients | No | Managers are added automatically. Toggle each recipient on or off, or add more users |
Click [Create]
Click [Create] to save. The new application appears in the tree under the selected parent.
Bulk Import
Click the [+ Create] button and select bulk creation to add many organizations and applications at once. The Bulk create dialog runs in three steps — Input → Preview → Result — so nothing is written until you have seen what will be created.
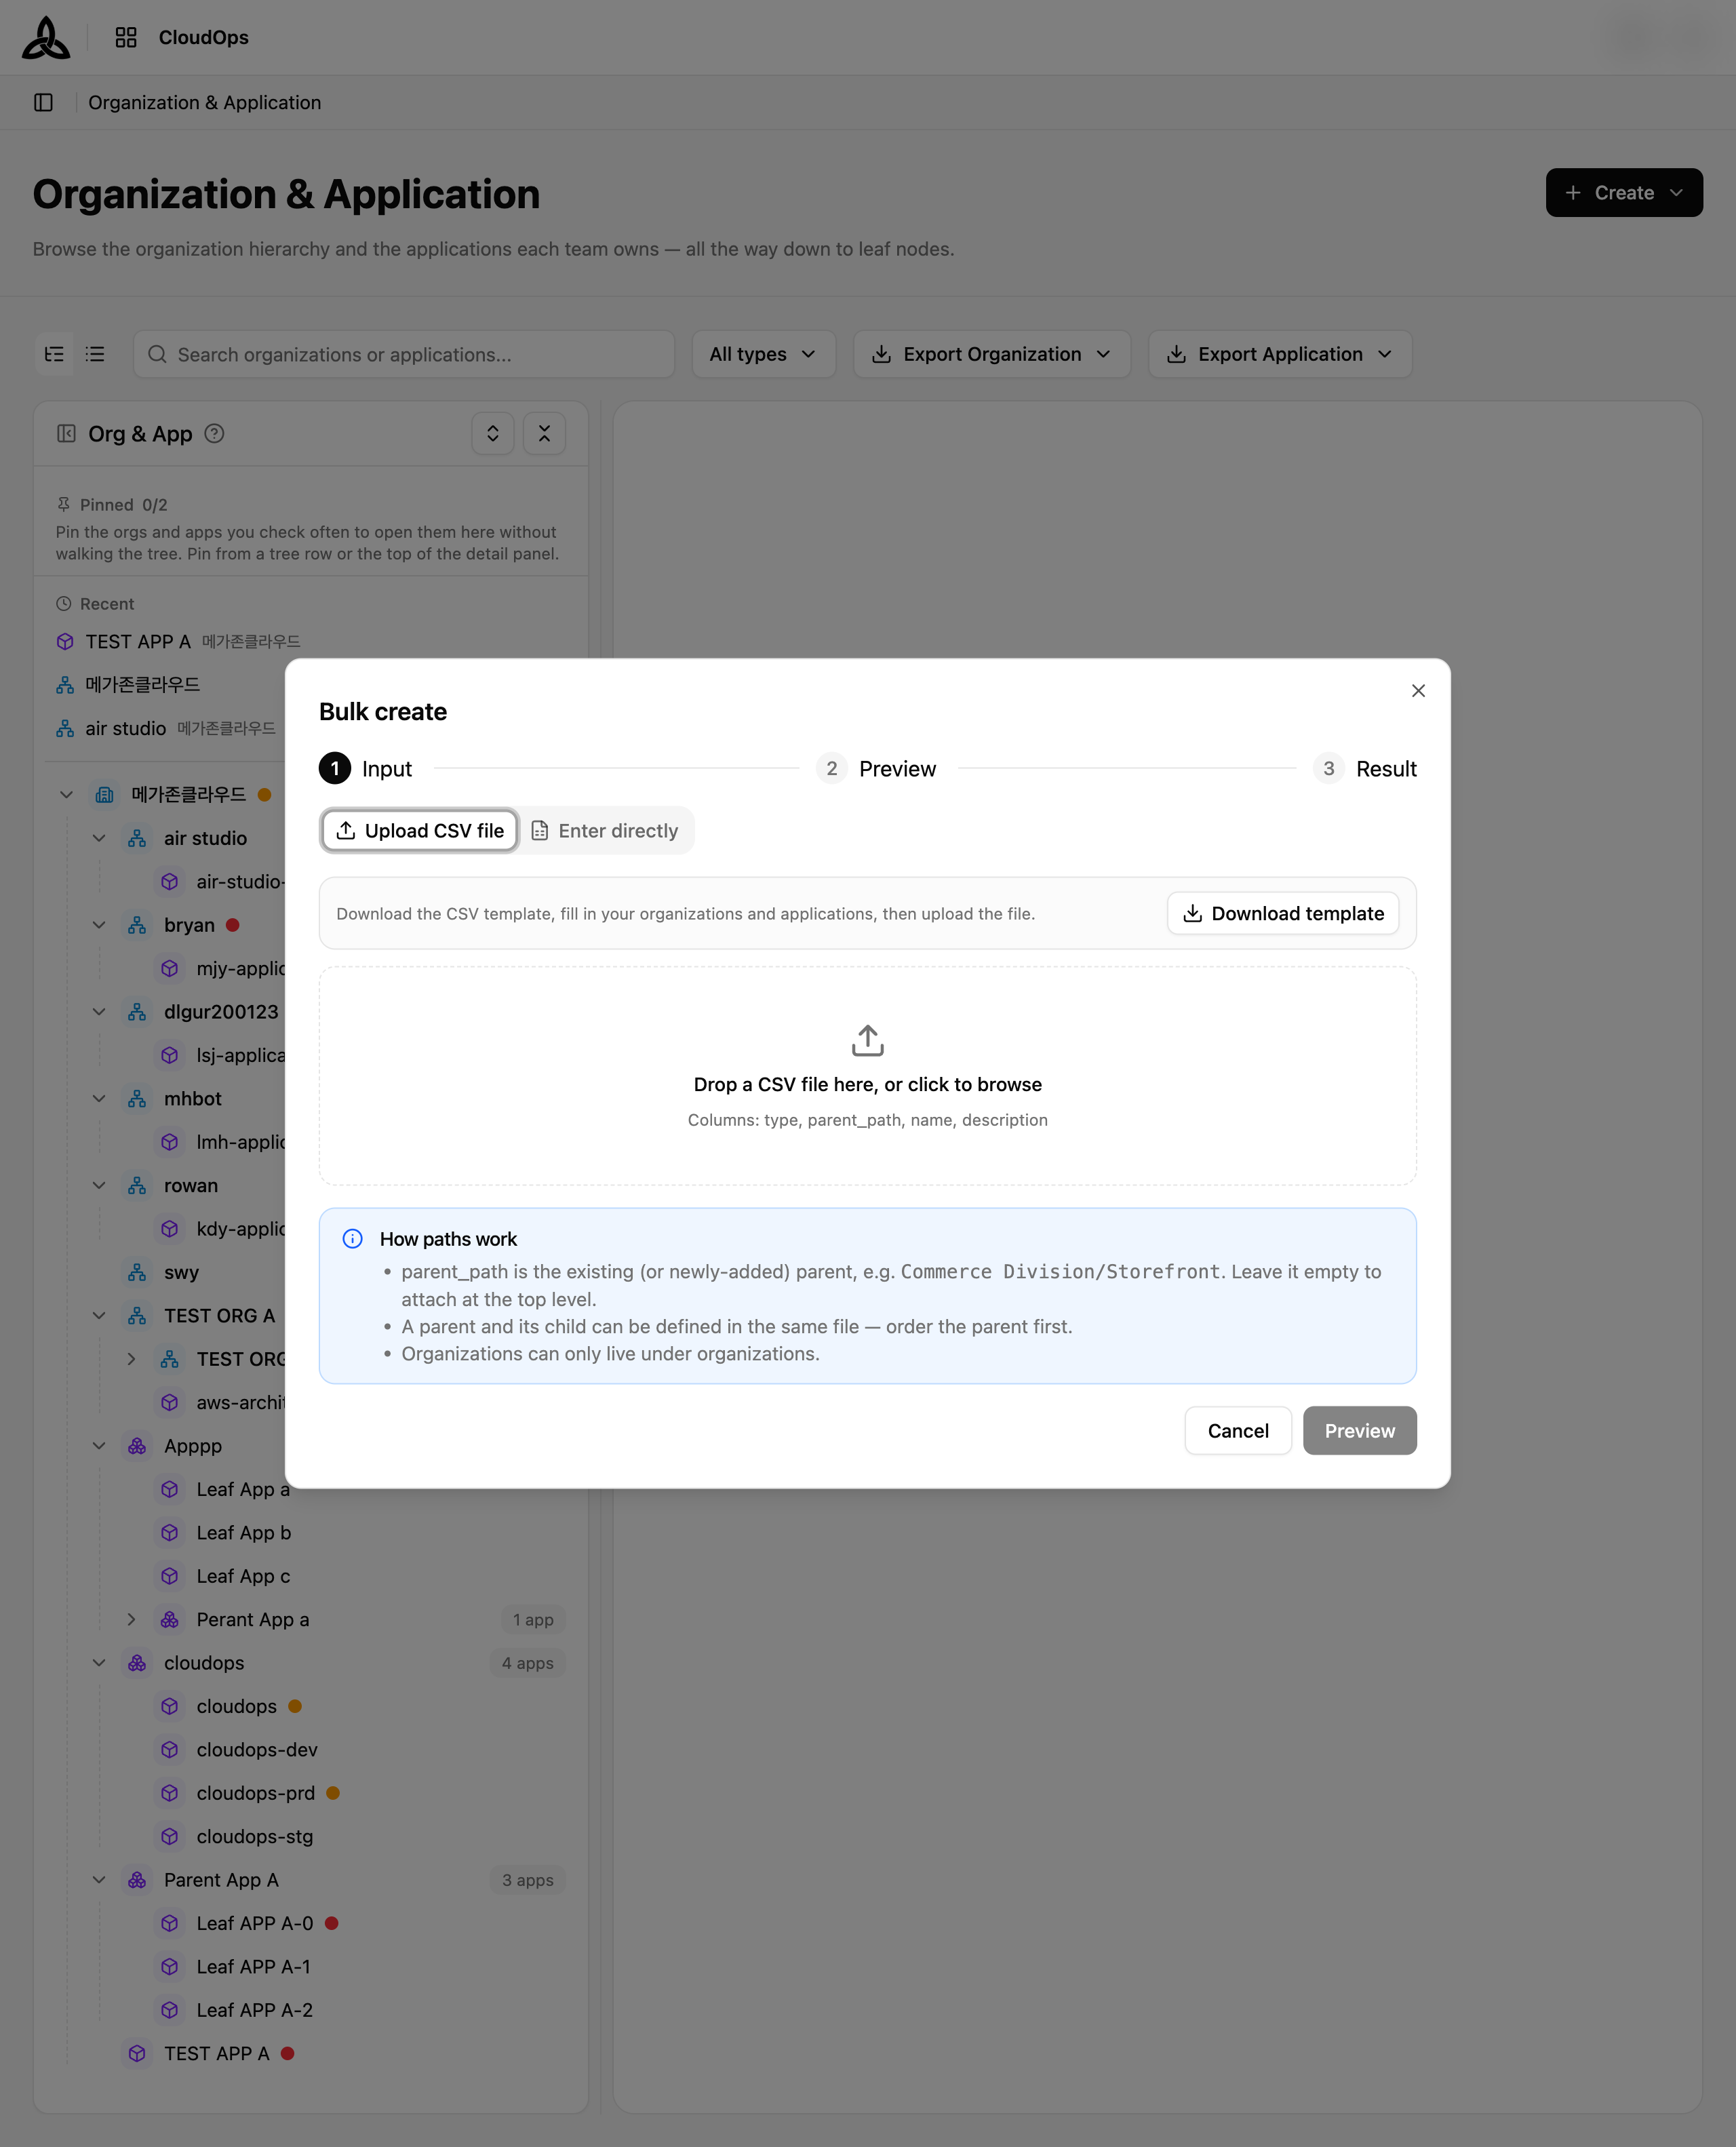
| Step | What happens |
|---|---|
| Input | Supply the rows, either by Upload CSV file or Enter directly. Download template gives you the CSV with the right columns — type, parent_path, name, description |
| Preview | Shows what will be created before anything is written |
| Result | Reports what was created |
parent_path names the existing or newly-added parent, for example Commerce Division/Storefront. Leave it empty to attach at the top level. A parent and its child can live in the same file as long as the parent comes first, and organizations can only sit under organizations.The wizard has three steps:
Input
Choose an input method:
| Method | Description |
|---|---|
| Upload CSV file | Drop or browse for a CSV file. Click [Download template] to get the expected format (type, parent_path, name, description) |
| Enter directly | Paste or type rows directly in the text area |
The parent_path column determines where each node is placed. Leave it empty to attach at the top level. A parent and its child can be defined in the same file — order the parent first. Organizations can only live under organizations.
Preview
Review the parsed tree before creation. Verify the hierarchy is correct.
Result
Shows the creation results — success/failure count for each row.
Application Detail Page
Click [View Details] on an application card to open the full detail page. The header shows the application name, type badge, and action buttons (Move, Edit Application, Delete).
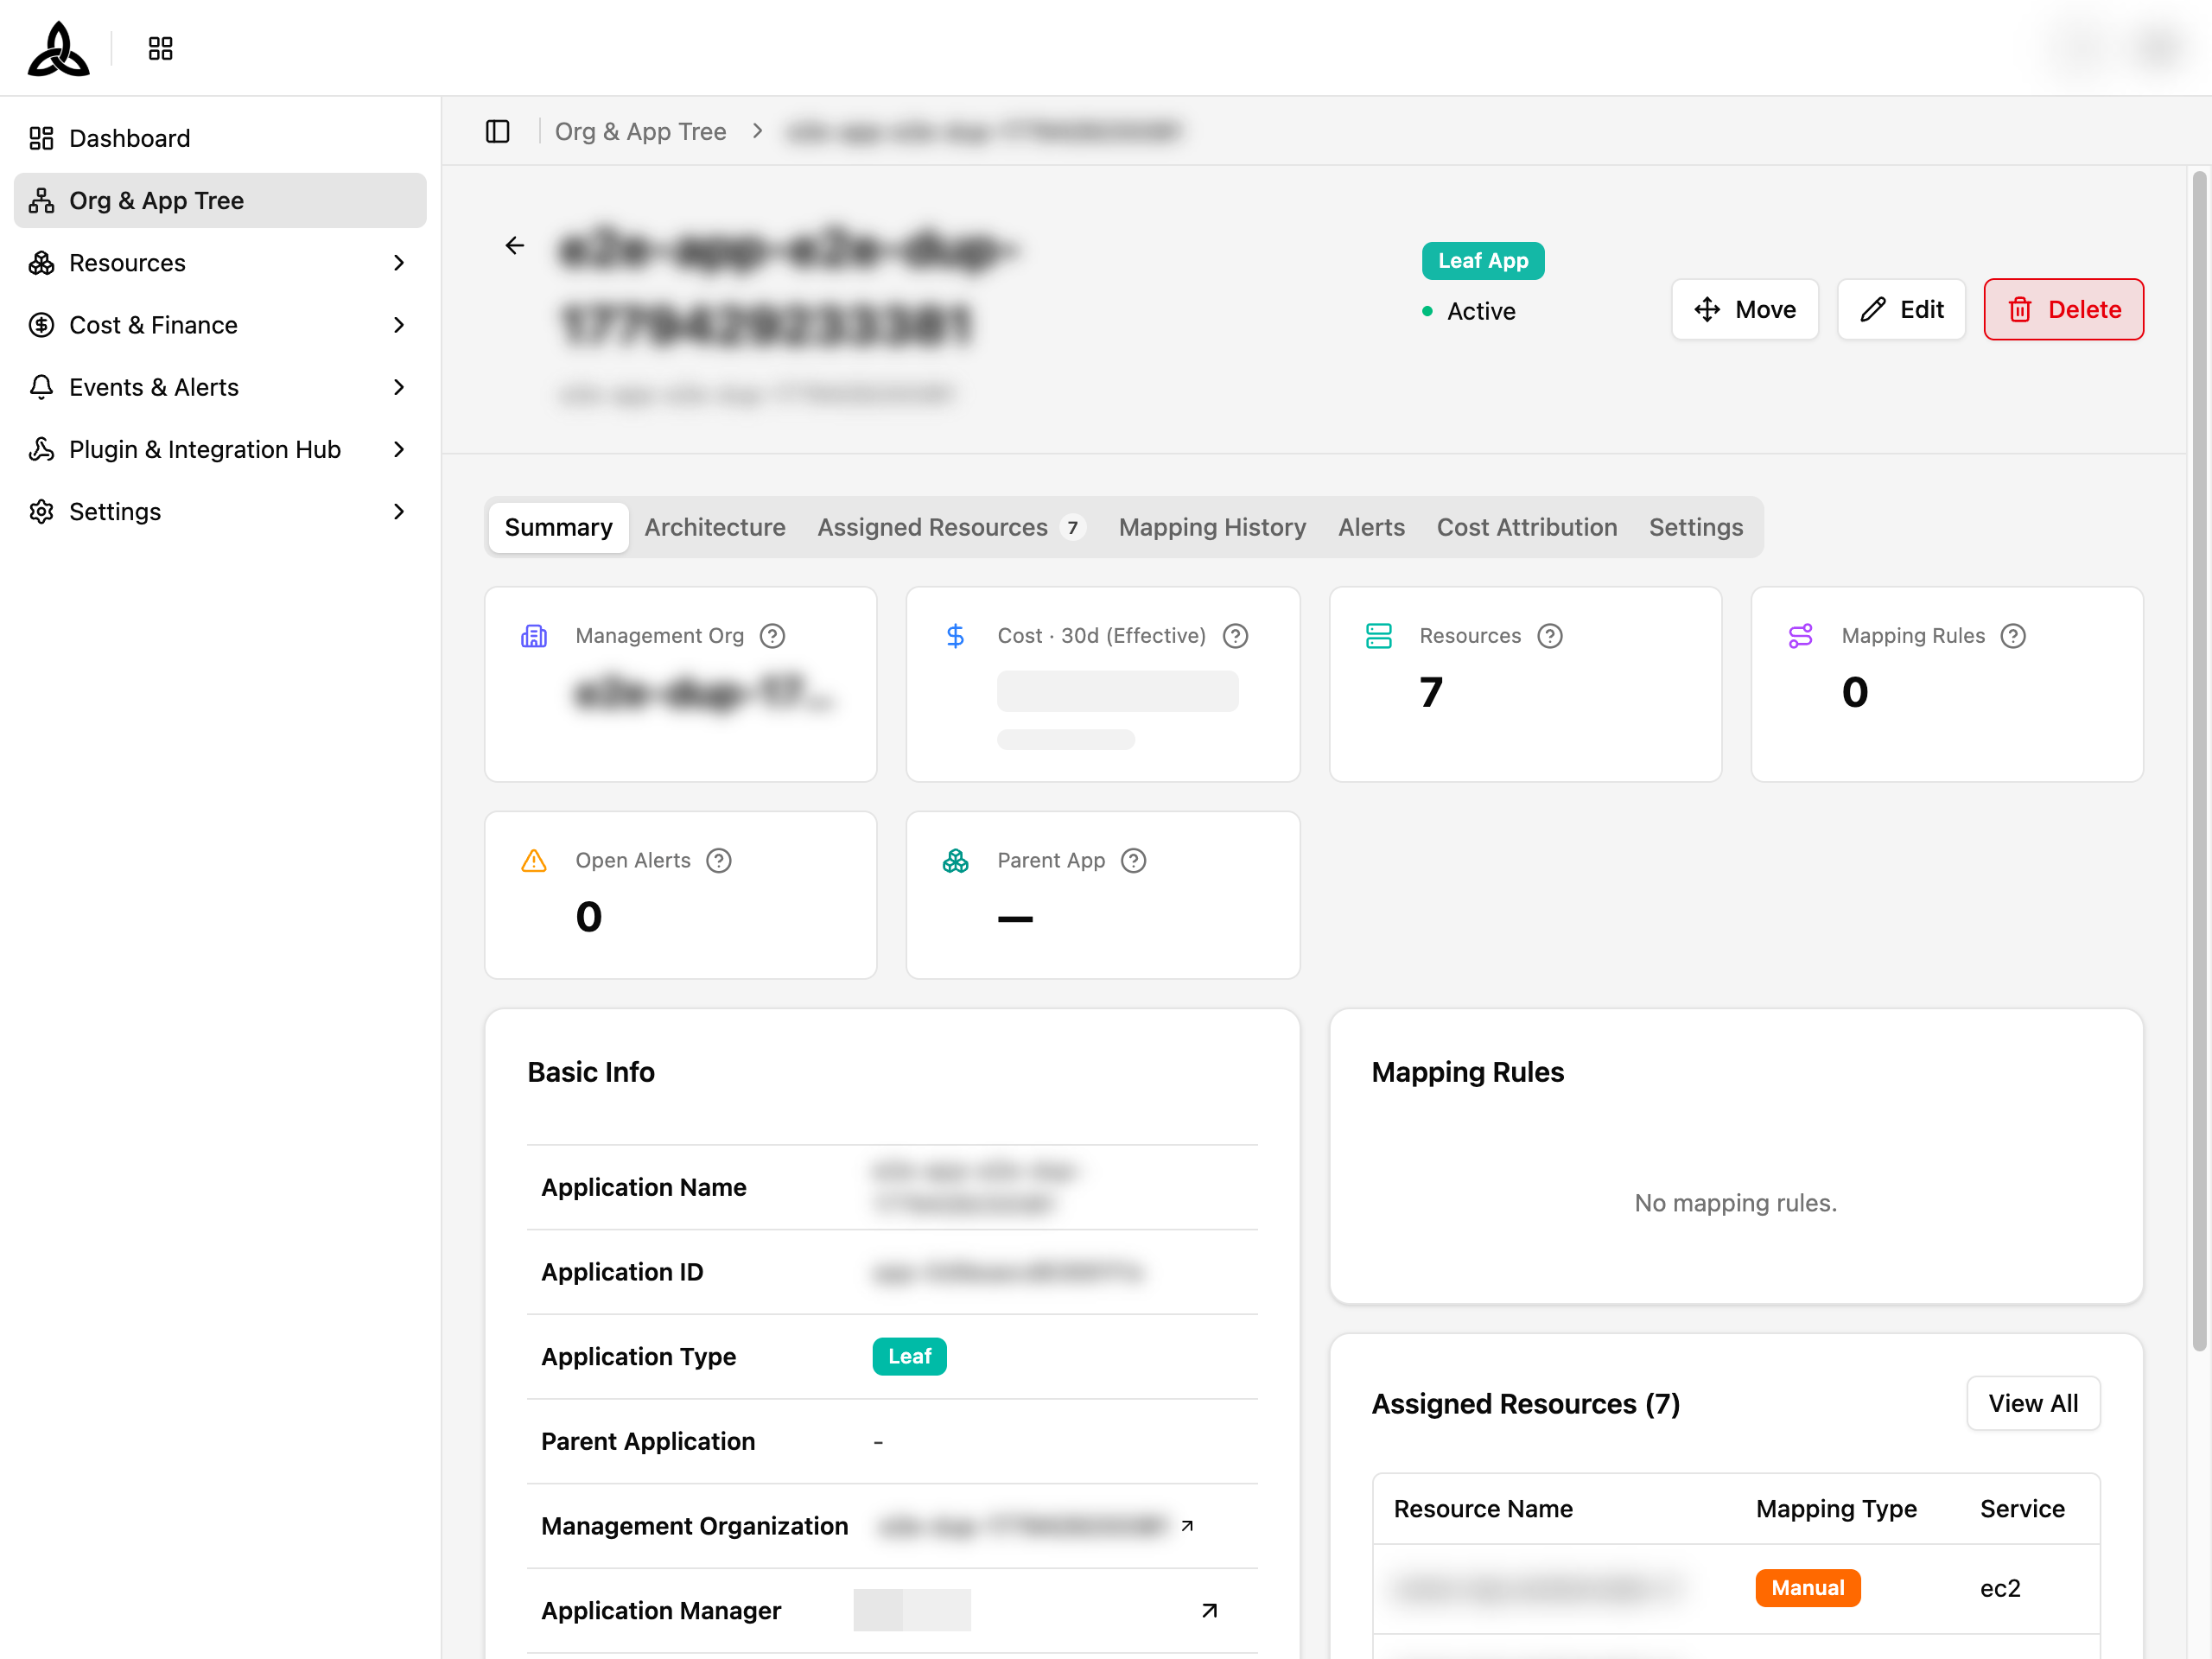
Summary
Key metrics at the top — Management Org, Cost (30d Effective), Resources, Mapping Rules, Open Alerts, Parent App. Below are three sections:
| Section | Description |
|---|---|
| Basic Info | Application Name, ID, Type (Leaf/Parent), Parent Application, Management Organization, Application Manager, Purpose |
| Mapping Rules | Active mapping rules linked to this application |
| Assigned Resources | Preview of resources mapped to this application with count |
Architecture
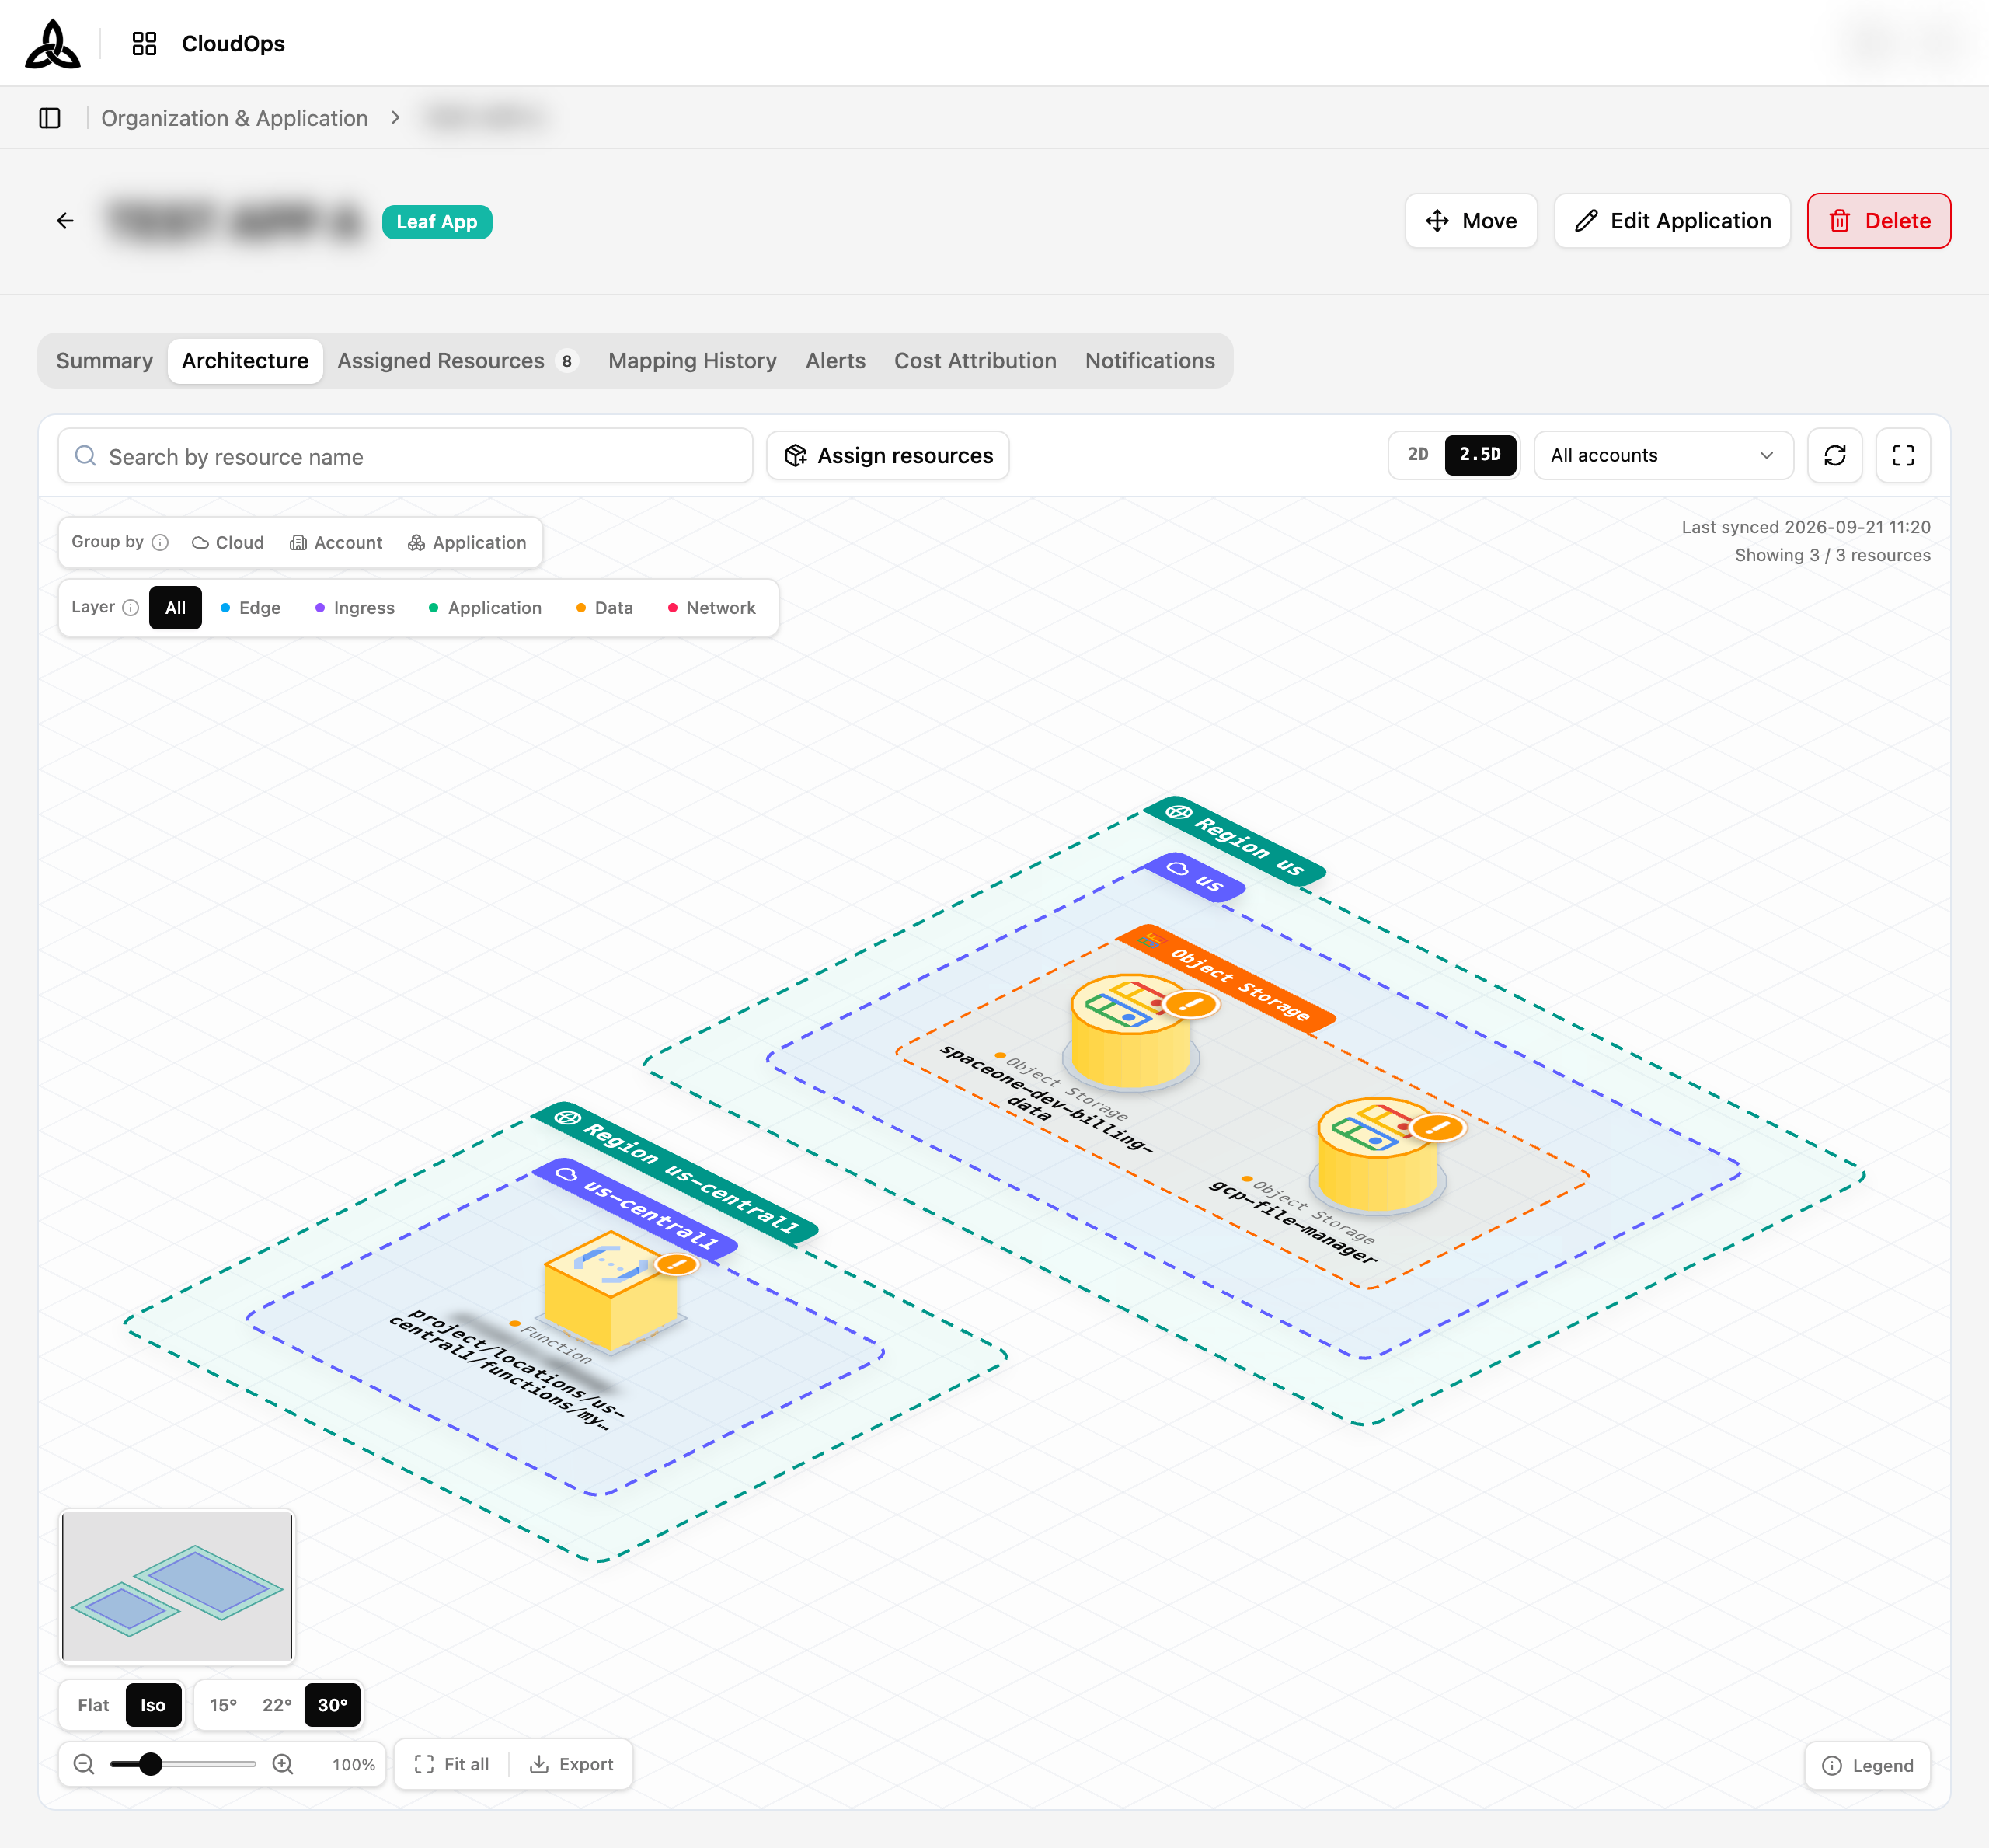
Automatically visualizes the topology of resources mapped to the Application. Nothing is drawn by hand — the diagram is built from collected resources and their relationships.
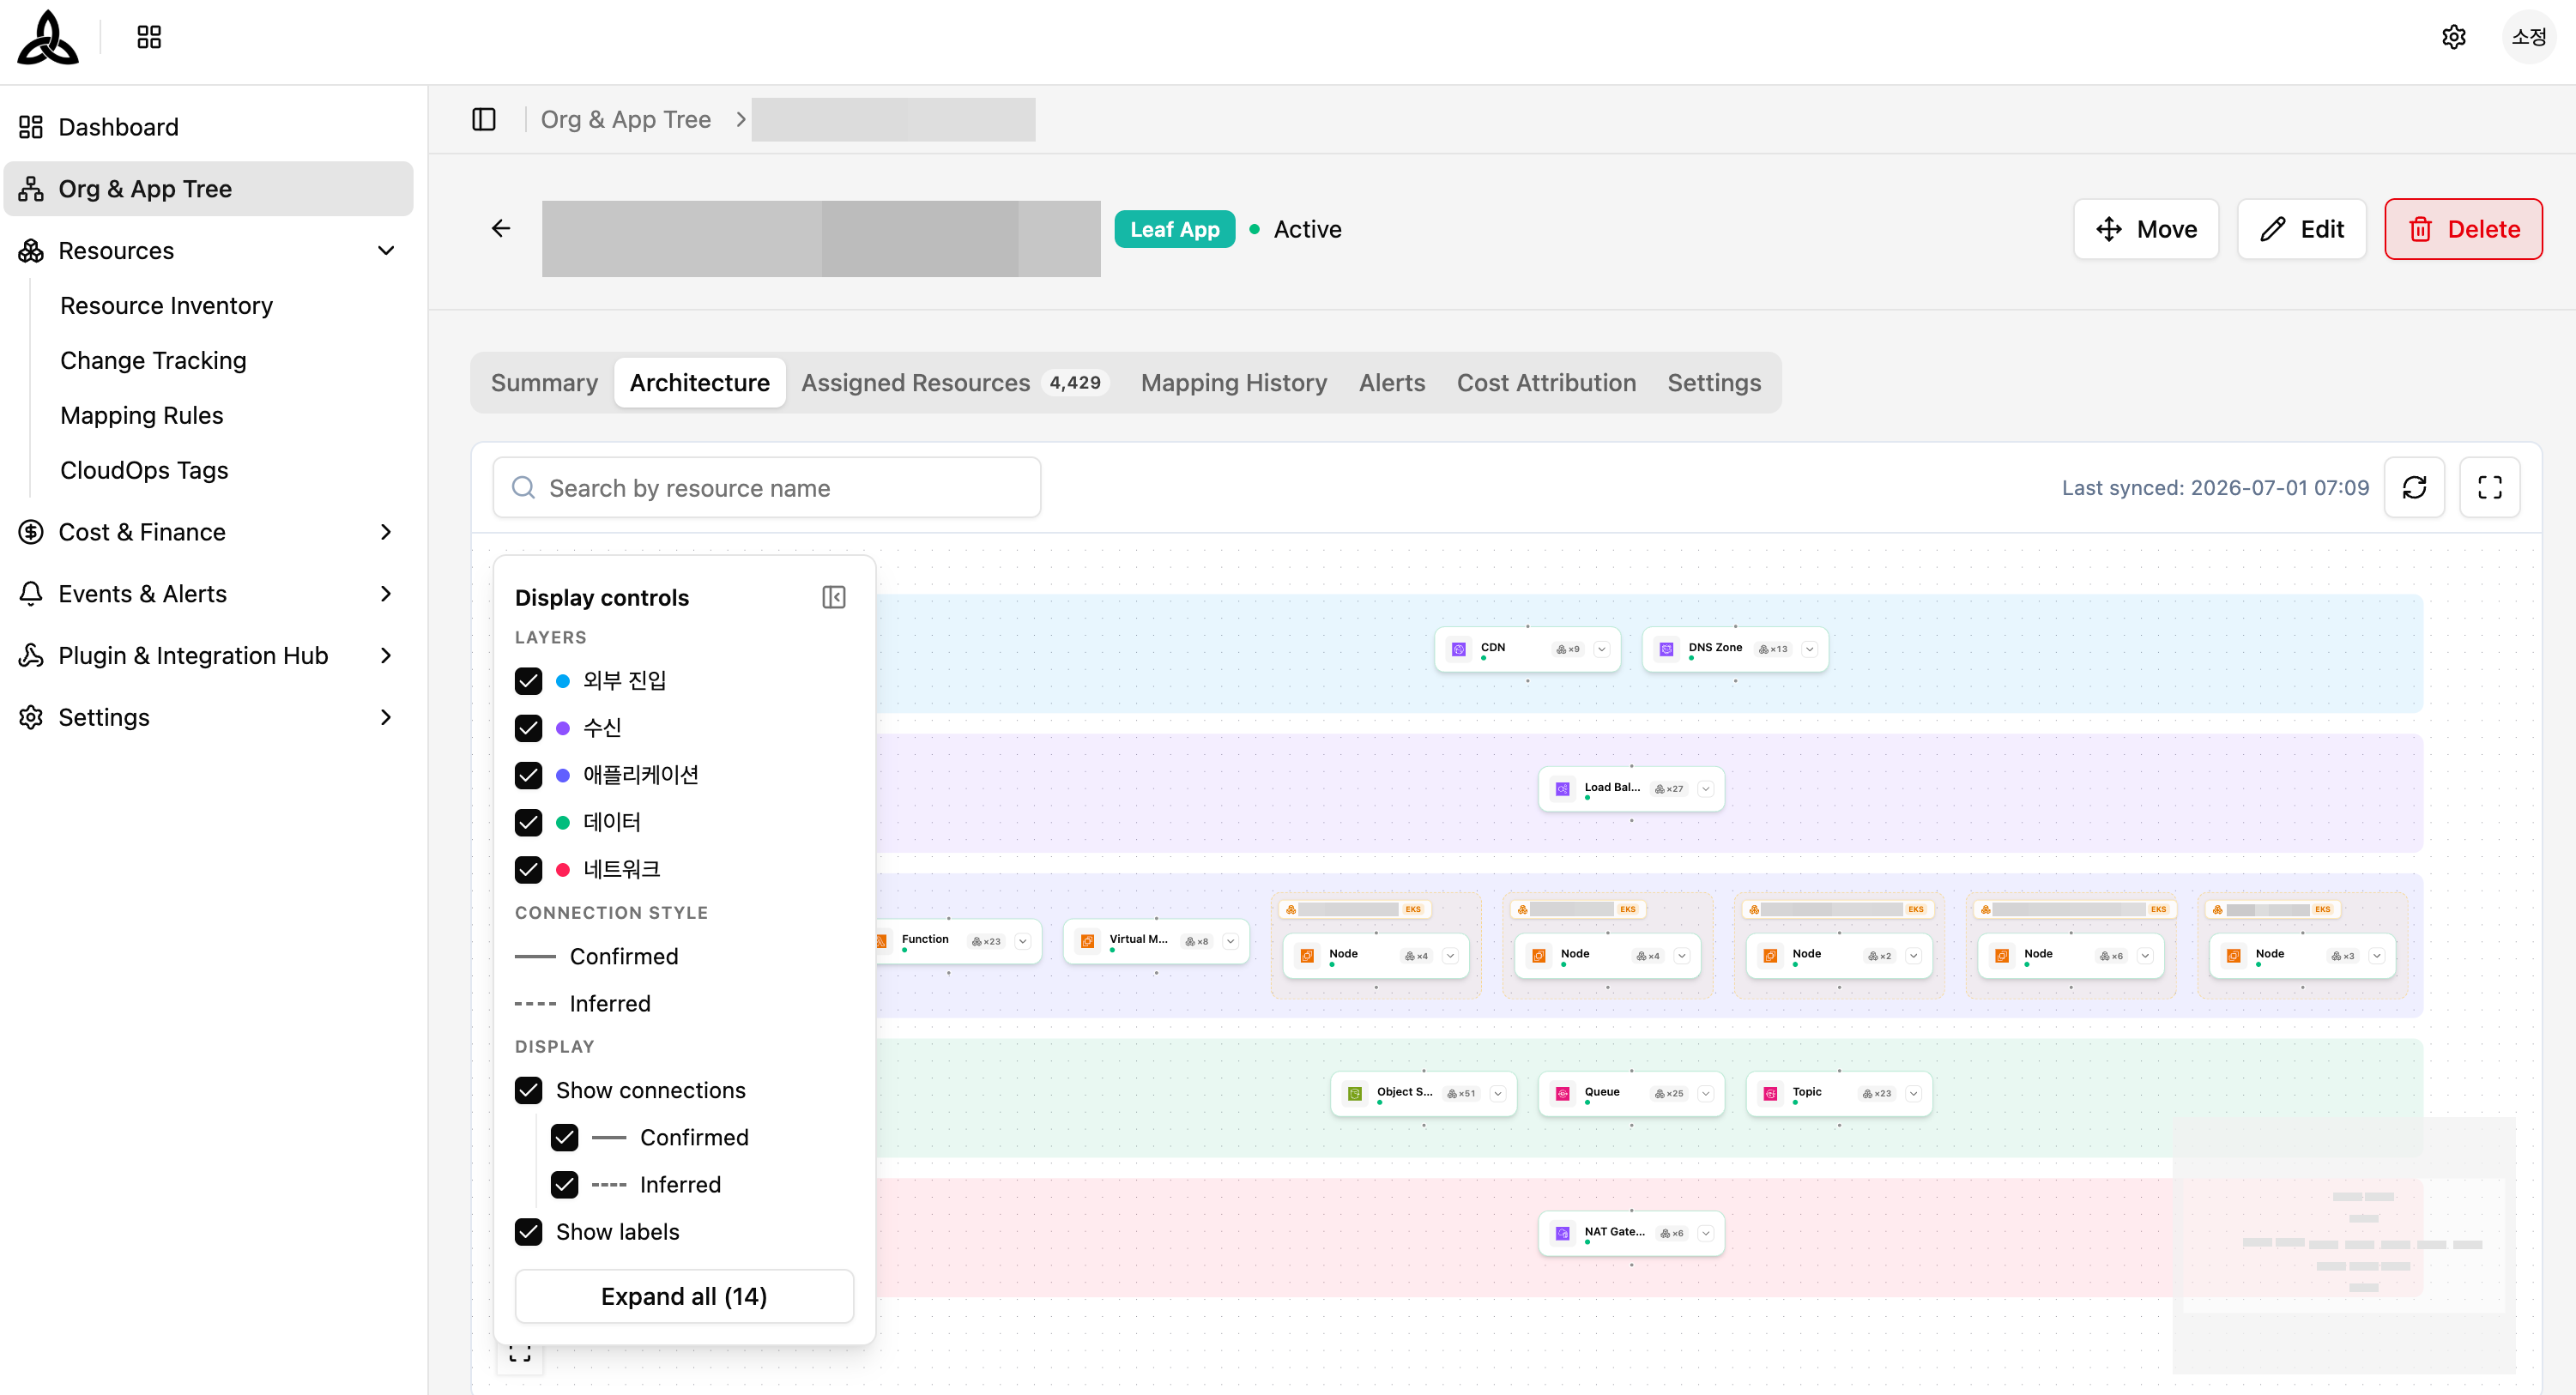
The view opens in 2.5D, an isometric projection where each grouping is a plate and resources sit on top of them as blocks. 2D flattens the same diagram to a top-down view.
Reading the canvas
| Element | What it represents |
|---|---|
| Outer plate | The grouping chosen in Group by — Cloud, Account, or Application |
| Region band | The region the resources below it belong to |
| Subnet plate | One plate is one real subnet. Plates are not colour-coded — the subnet name on the band tells them apart |
| Subnet span | A dashed box drawn around every subnet a single resource uses. One resource spanning several subnets (multi-AZ load balancers, RDS) still sits on one plate — the box marks its reach |
| Cluster | A workload boundary such as EKS, GKE, or AKS. A cluster spanning several subnets is drawn as one plate fragment per subnet |
| Status badge | Appears only on resources with critical or warning alerts |
Node Shapes
The shape of a block tells you what kind of resource it is, before you read its label.
| Shape | Resource kind | Examples |
|---|---|---|
| Box | Compute | VM, container, ASG |
| Cylinder | Storage | DB, cache, object store |
| Hexagon | Gateway · network | Load balancer, NAT |
| Small box | Serverless | Function, queue |
View Controls
| Control | Description |
|---|---|
| 2D / 2.5D | Flat top-down view, or the isometric view |
| Flat / Iso + angle | In 2.5D, the projection angle — 15°, 22°, or 30° |
| Group by | Group resources by Cloud, Account, or Application |
| Layer | Show one layer at a time, or All — Edge, Ingress, Application, Data, Network |
| All accounts | Narrow the diagram to one cloud account |
| Search by resource name | Find a resource inside the diagram |
| Zoom / Fit all | Zoom slider with a percentage readout, and a one-click fit to the whole diagram |
| Minimap | Overview with the current viewport marked — drag it to move around a large topology |
| Refresh / Full screen | Re-fetch the topology, or expand the canvas |
The header also reports Last synced and Showing n / n resources, so you can tell whether a filter is hiding part of the picture.
Canvas actions
The controls along the bottom edge of the canvas act on the diagram as a whole.

| Action | Description |
|---|---|
| Fit all | Zoom and centre so the entire diagram fits the canvas |
| Export | Save the diagram as an image file |
Selecting [Export] offers two formats.
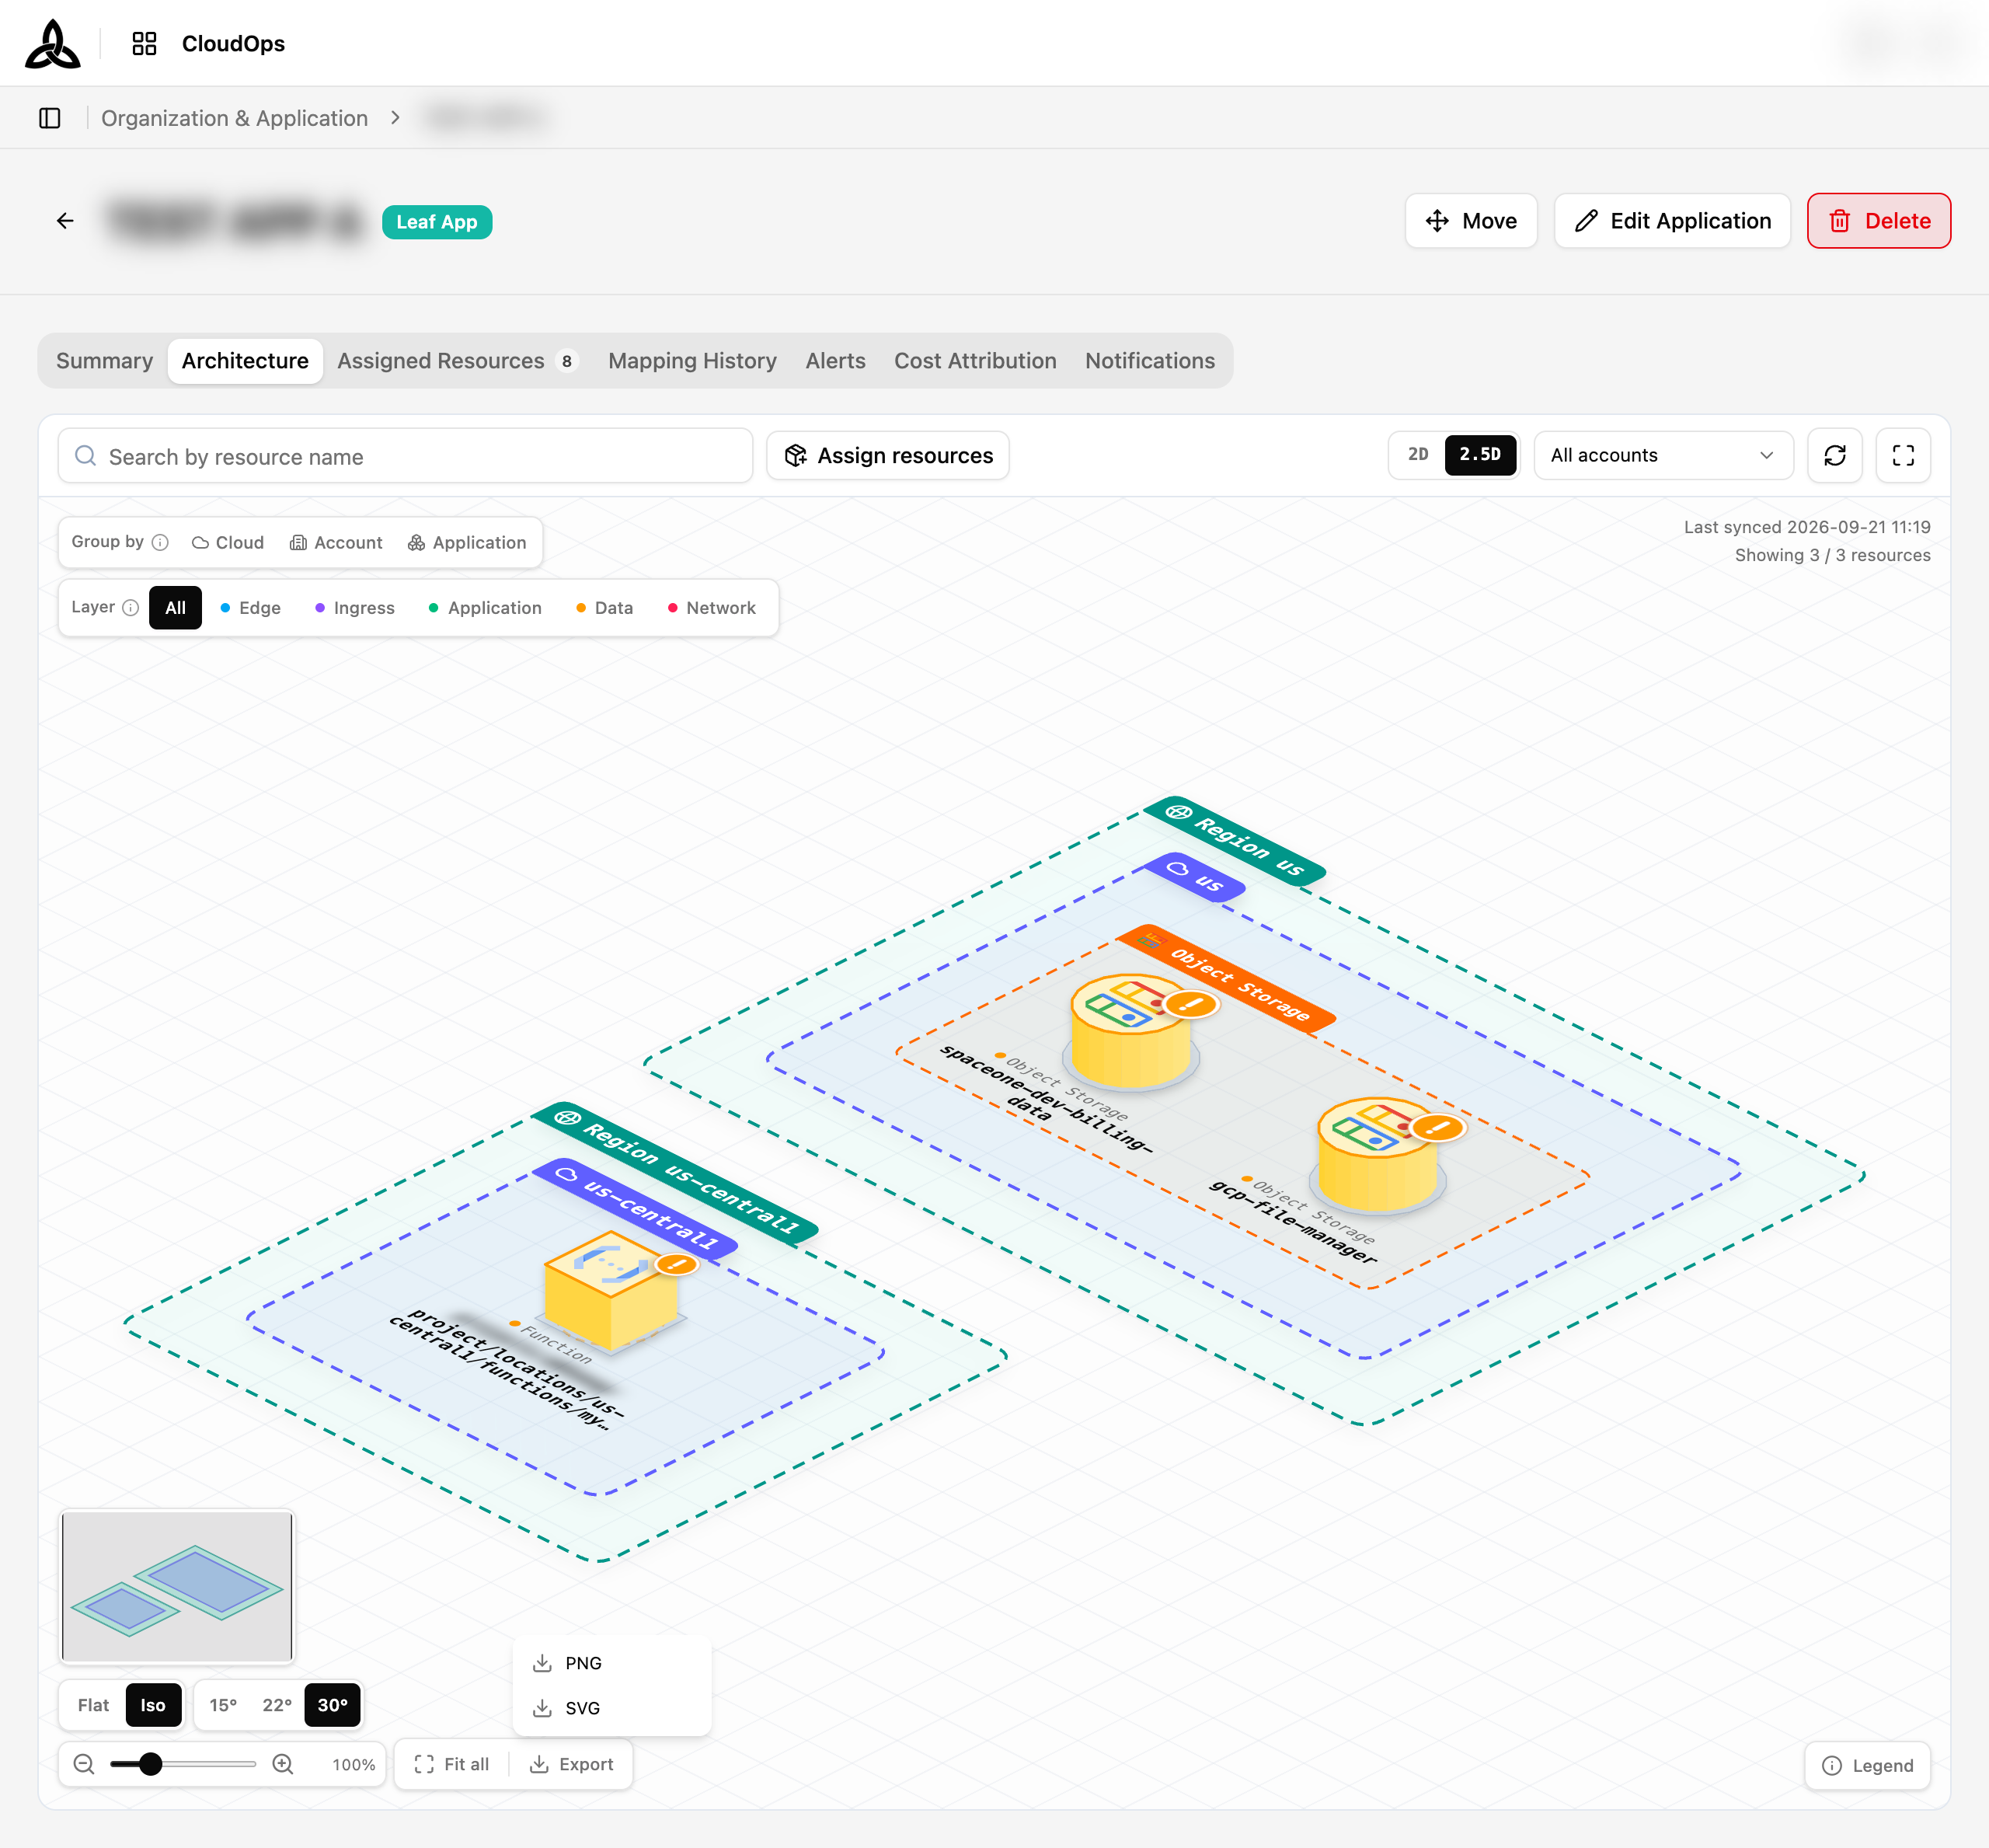
| Format | Use it for |
|---|---|
| PNG | Dropping the diagram into a document or a chat |
| SVG | Keeping it sharp at any size, or editing it in a vector tool |
The trigger stays locked while the file is being produced.
Legend & display
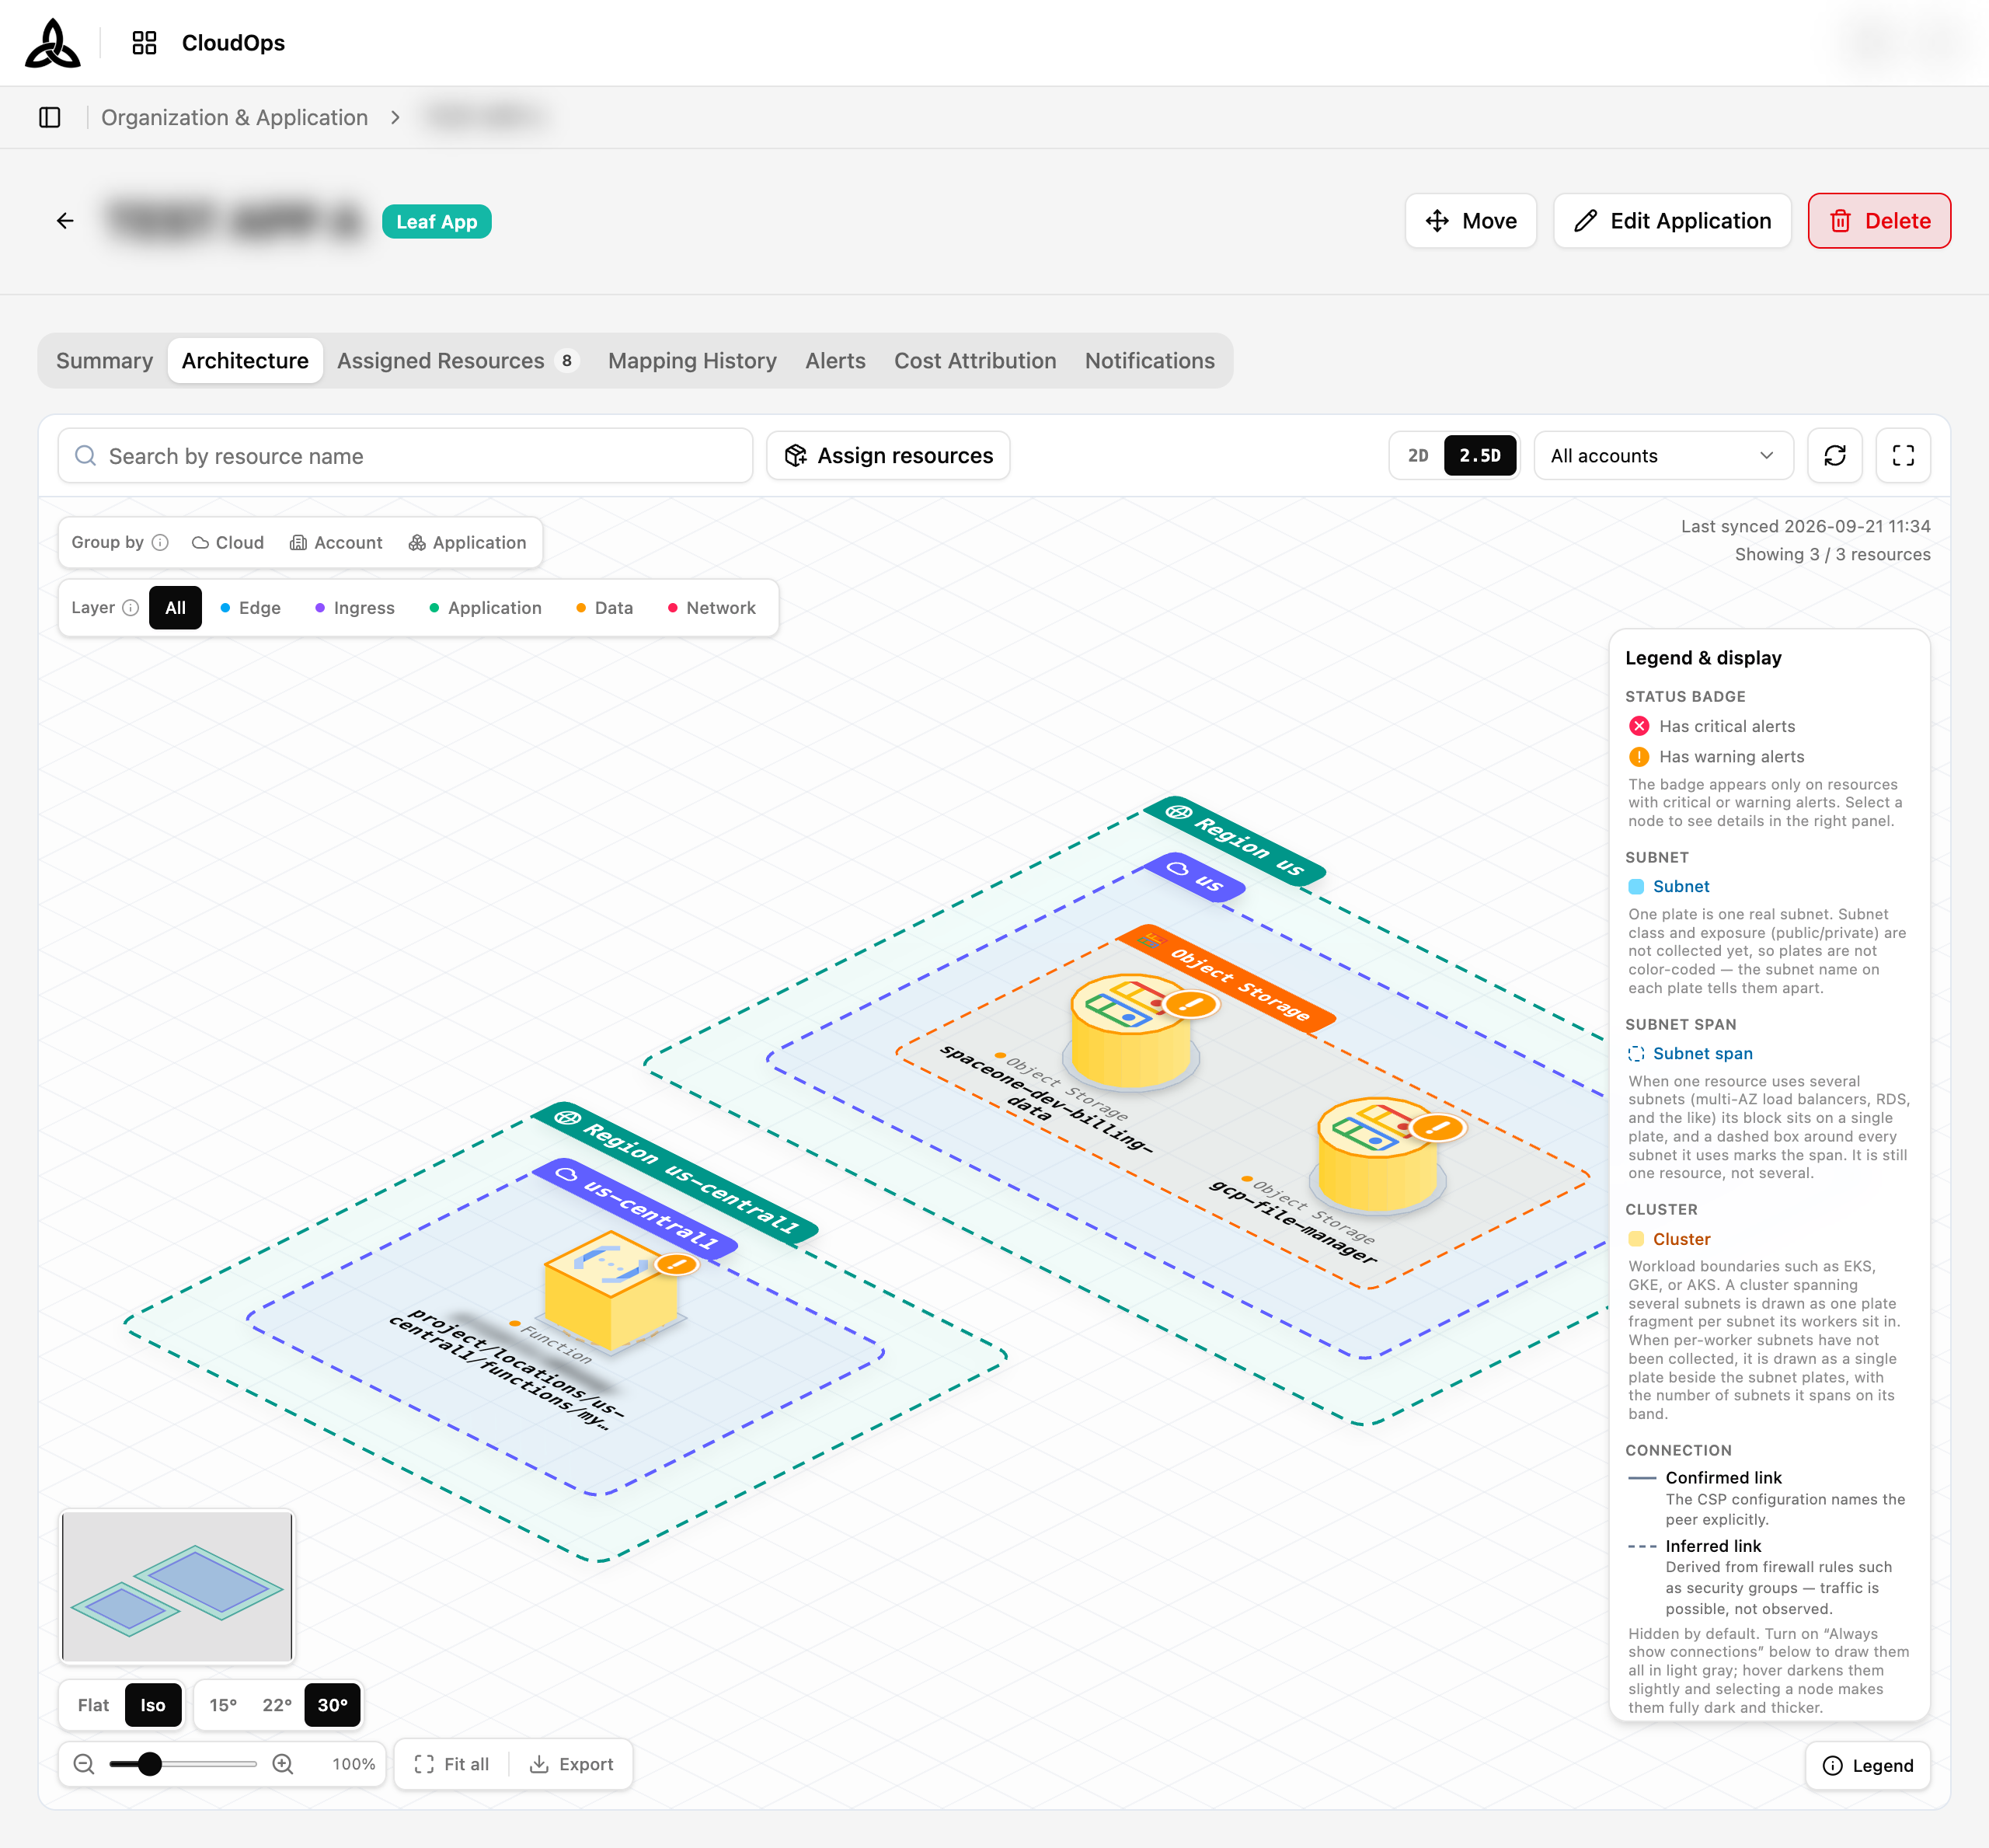
Legend at the bottom-right opens a panel that both explains every symbol above and holds the display switches.
| Section | Contents |
|---|---|
| Connection | Traffic and Association line styles |
| Detail | Auto · Expanded · Collapsed — how stacked blocks are shown |
| Display | Always show connections, and whether to include Non-VPC resources |
Stacked blocks
A stacked block stands for several resources of the same kind grouped together. Click it to expand just that group, or use Detail in the legend panel to set the behaviour for the whole canvas — Auto decides per group, while Expanded and Collapsed force it one way.
Node Selection
Clicking a node opens a detail panel on the right and makes its connections stand out, so the impact range is easy to trace. Resources carrying critical or warning alerts show a status badge on the block itself.
| Section | Contents |
|---|---|
| Issues | Open findings on this resource, counted by severity, with a link through to them |
| Cost | What the resource costs, or a note that no cost data has arrived |
| Collection | When the resource was last collected, the state of any re-collection, and [Re-collect] |
| Resource info | Type, resource group, resource type, provider, region, account, exposure, and the provider’s own identifier |
[Open resource detail] at the bottom leaves the diagram for the resource’s own page.
Collection
[Re-collect] asks CloudOps to read this one resource from the provider again, without waiting for the next scheduled collection. The panel shows Last collected, and the state of the most recent re-collection beside the Collection heading — No re-collection yet until you run one.
A request is marked as in progress as soon as it is accepted, so you get feedback before the collection finishes — the progress you see is the server’s view of the run, not a guess the screen makes locally. When it completes and the resource has changed, the diagram and the panel are both re-read, so a new relationship or a removed resource shows up on the canvas rather than only in the panel.
Assigning resources from the diagram
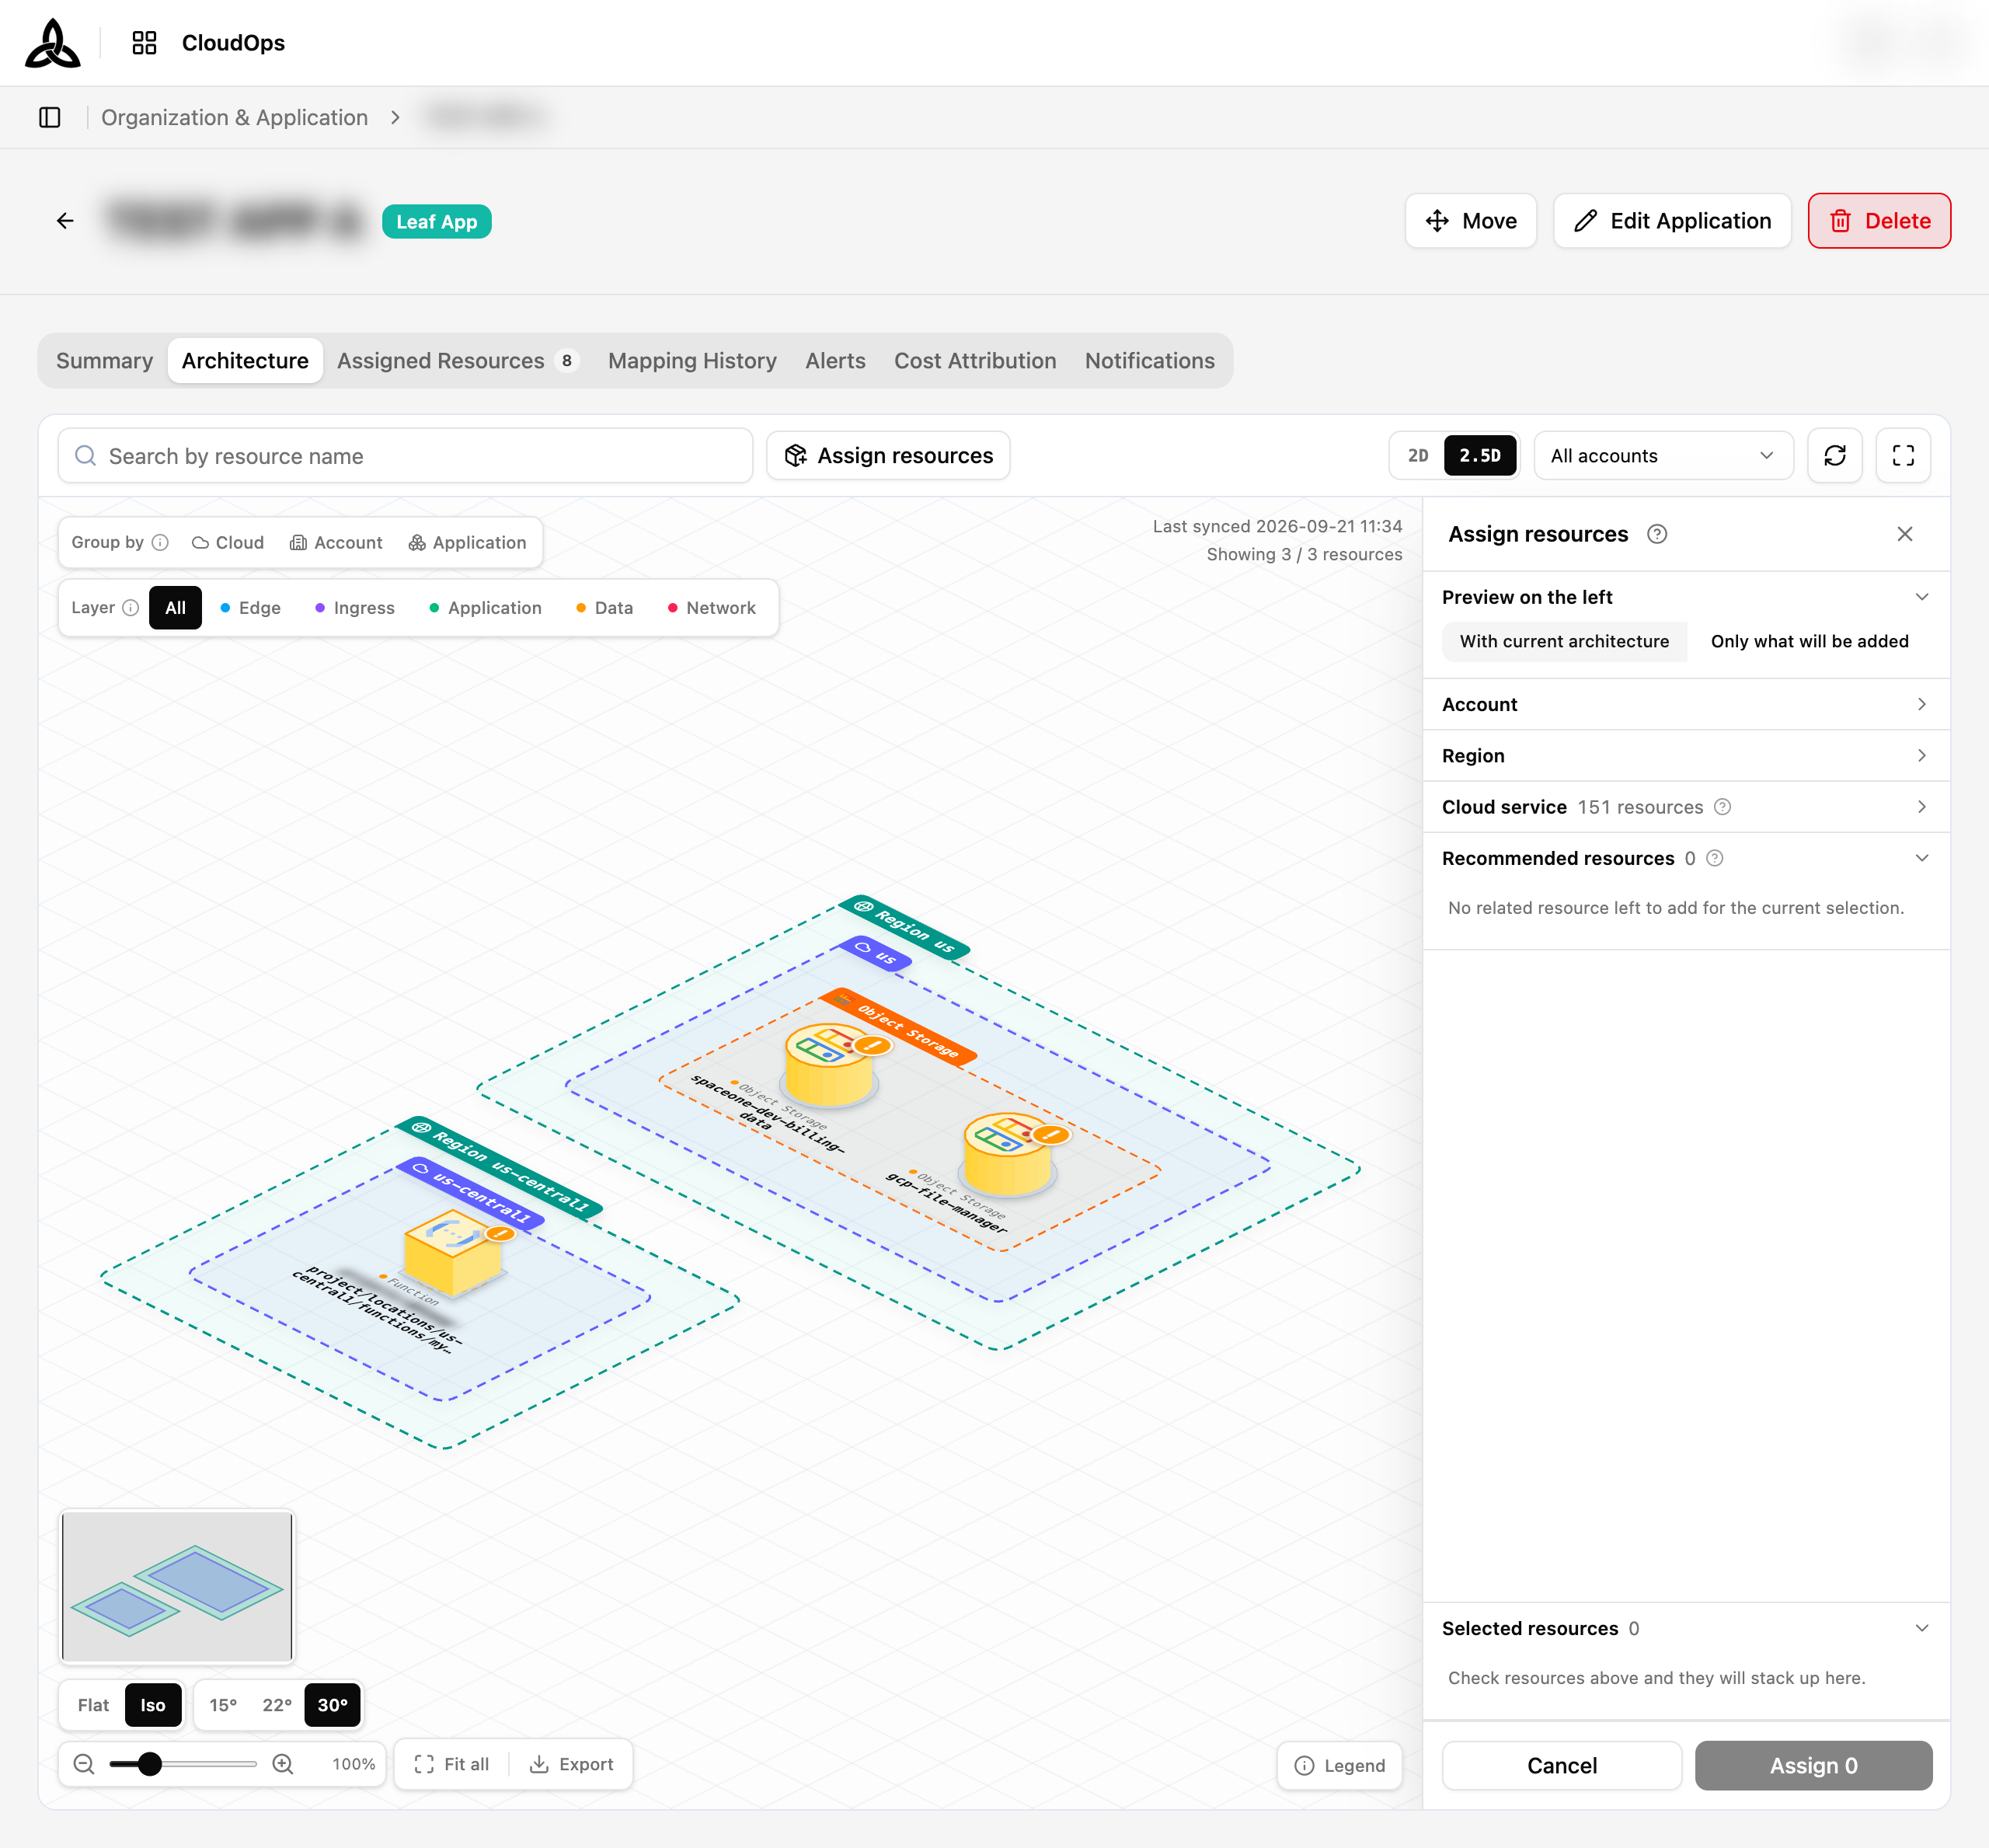
Assign resources opens a drawer beside the diagram, so resources can be added without leaving the architecture view.
| Control | Purpose |
|---|---|
| Preview on the left | With current architecture draws the additions into the existing diagram; Only what will be added shows just the new resources |
| Account / Region | Narrow the candidate list |
| Cloud service | Browse grouped by service type, each with a count, and expand a group to reach individual resources |
| Recommended resources | Resources one step away from what you have already selected — see below |
| Selected resources | What you have picked so far, removable one by one |
| Assign n | Applies the assignment, with the count on the button |
Recommended resources
Selecting a resource surfaces others related to it. The recommendations are split into two groups by a single question — if I add this, what appears on the diagram?
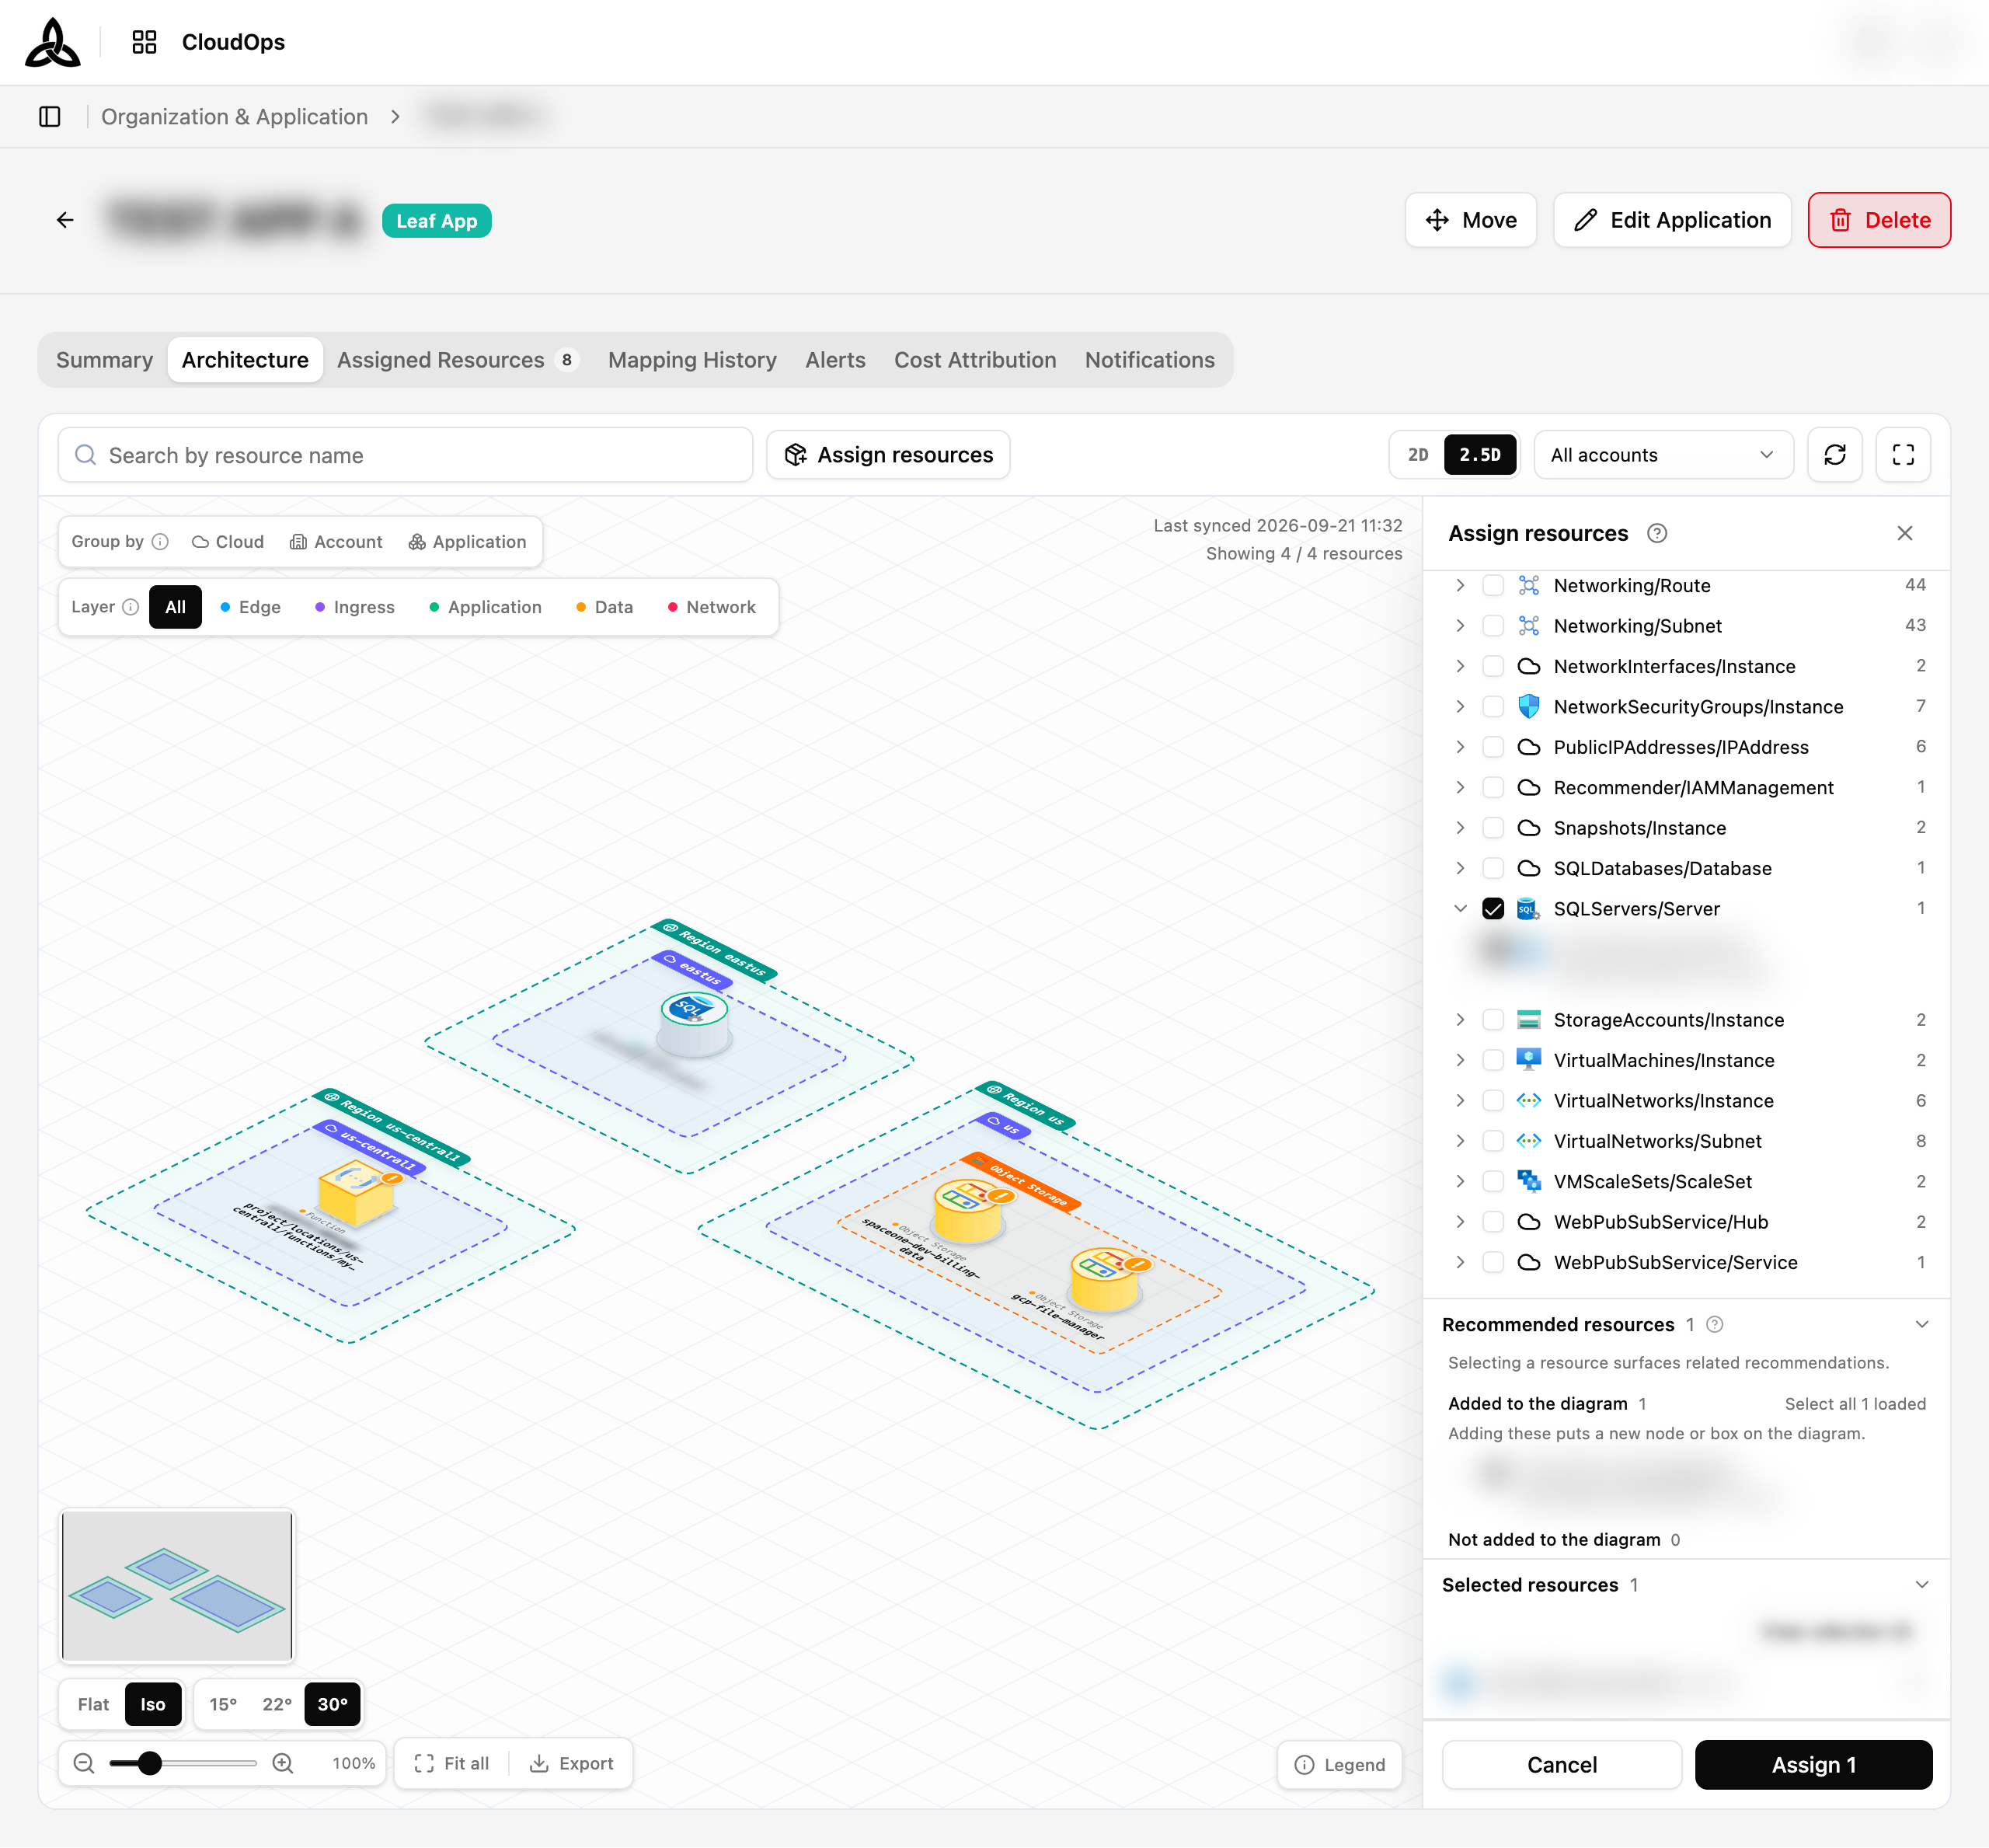
| Group | What adding one does |
|---|---|
| Added to the diagram | Puts a new node or box on the diagram |
| Not added to the diagram | Leaves the diagram exactly as it is |
Each row can carry a short reason: Not structural for a resource that is never drawn as a node, and No place to draw for a type that is normally drawn but has nowhere to sit in the current architecture. Rows that do add something say which — Adds a node or Adds a box.
Both group headings stay on screen even when one of them is empty, so a group never appears or disappears depending on the response. Groups are collapsed by service, and each group remembers its own expanded state, because the same service can appear on both sides.
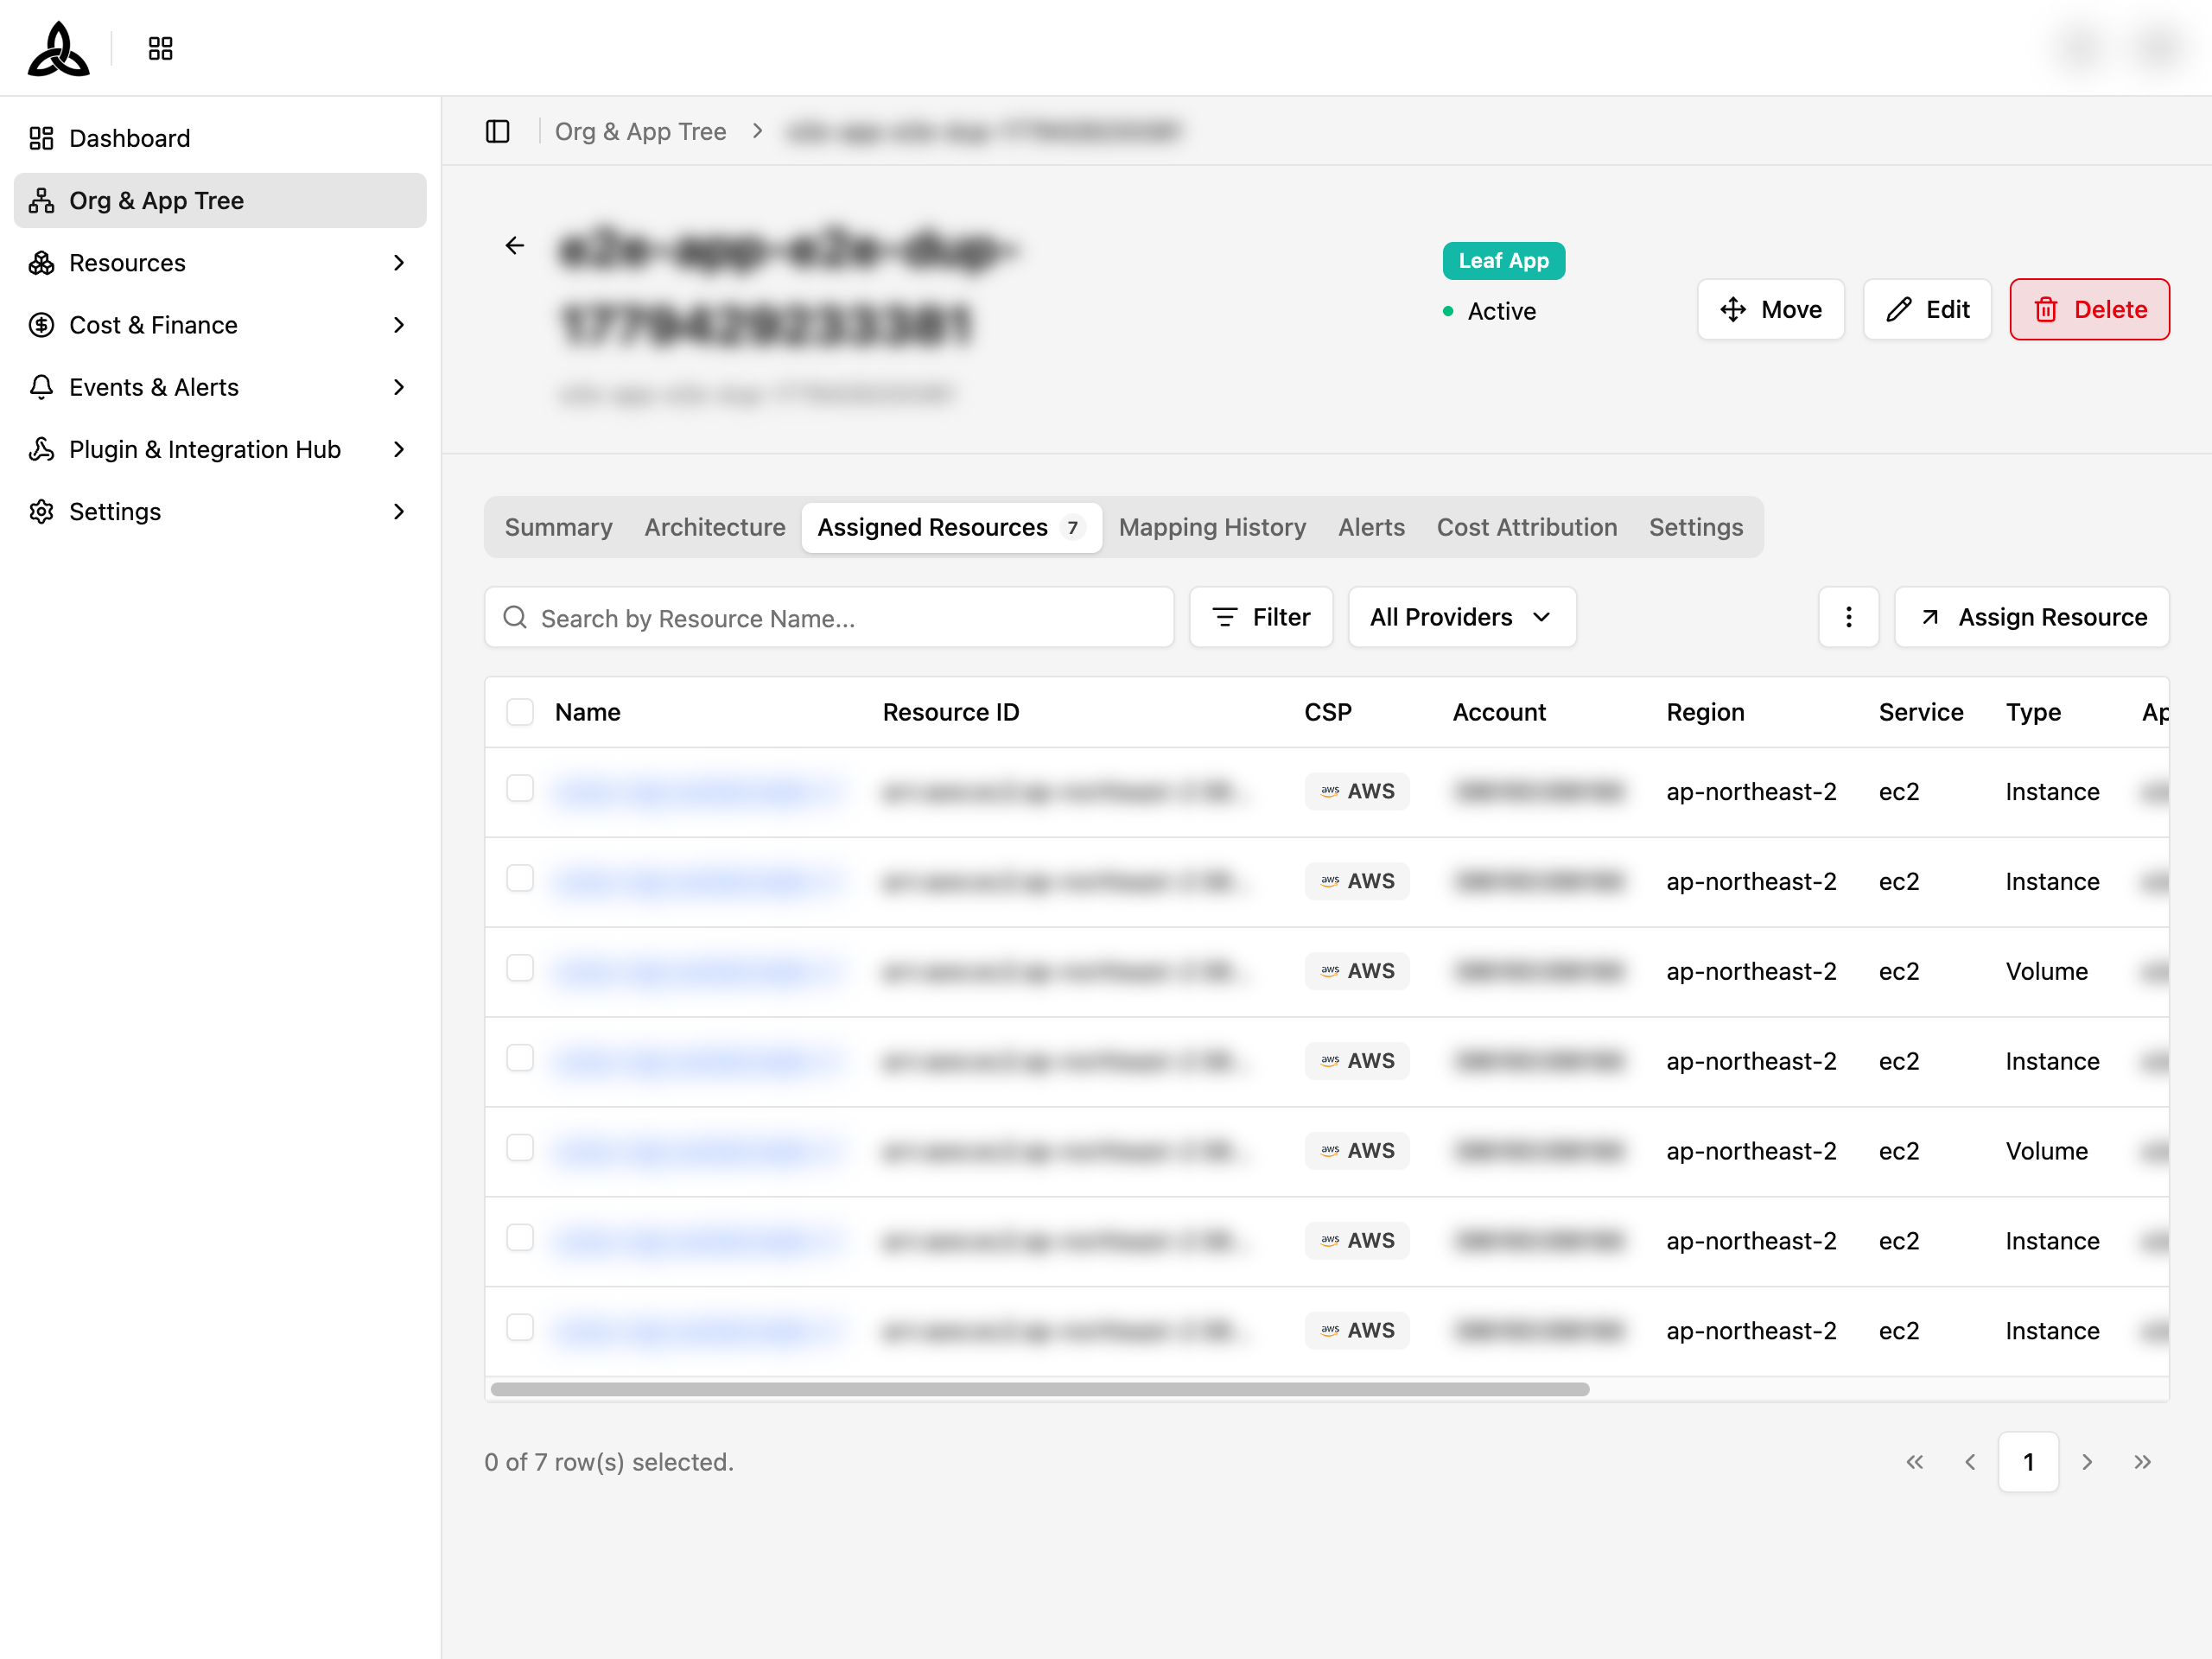
Assigned Resources
Full table of resources mapped to this application. Search by resource name, filter by provider, and manage assignments.
Mapping History
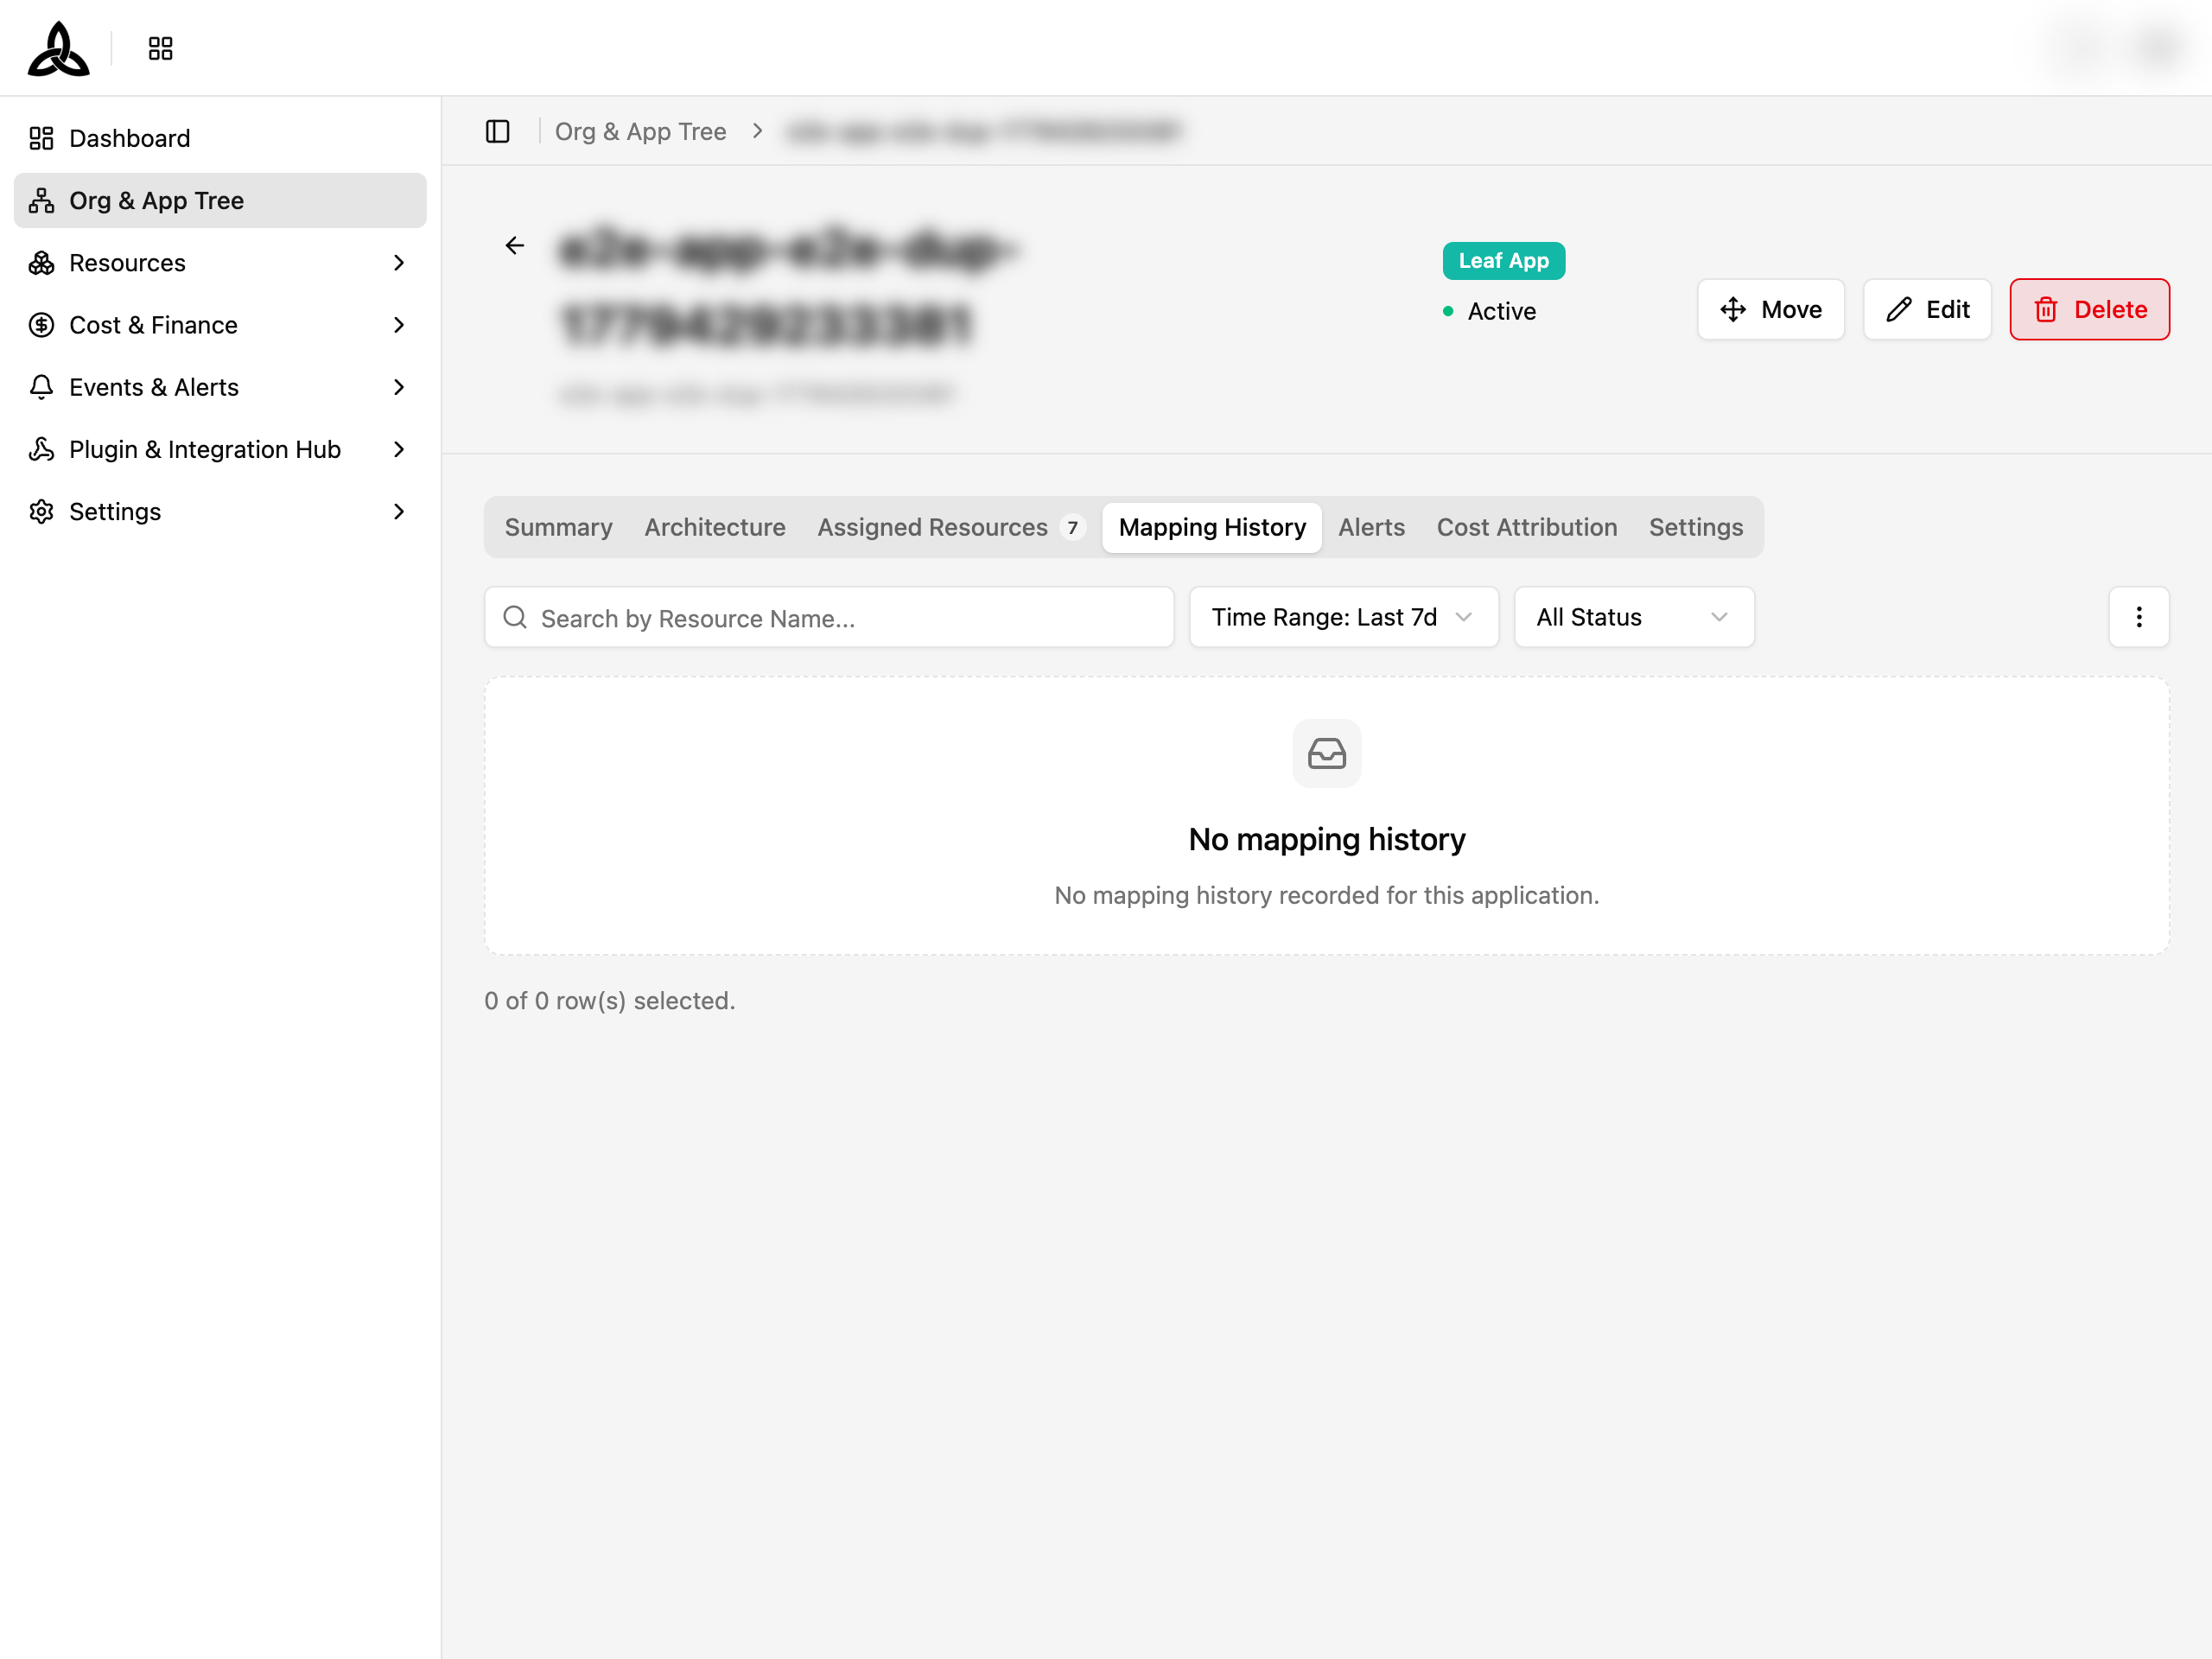
History of resource mapping changes — shows when resources were assigned or unassigned, by which rule, and the result.
| Column | Description |
|---|---|
| Executed At | Timestamp of the mapping action |
| Mapping Type | Source of the mapping — Rule (automatic) or Manual |
| Rule Name | Name of the mapping rule (for Rule type) |
| Resource Name | Affected resource |
| Status | Result — Success or Fail |
| Reason / Error | Failure reason (if applicable) |
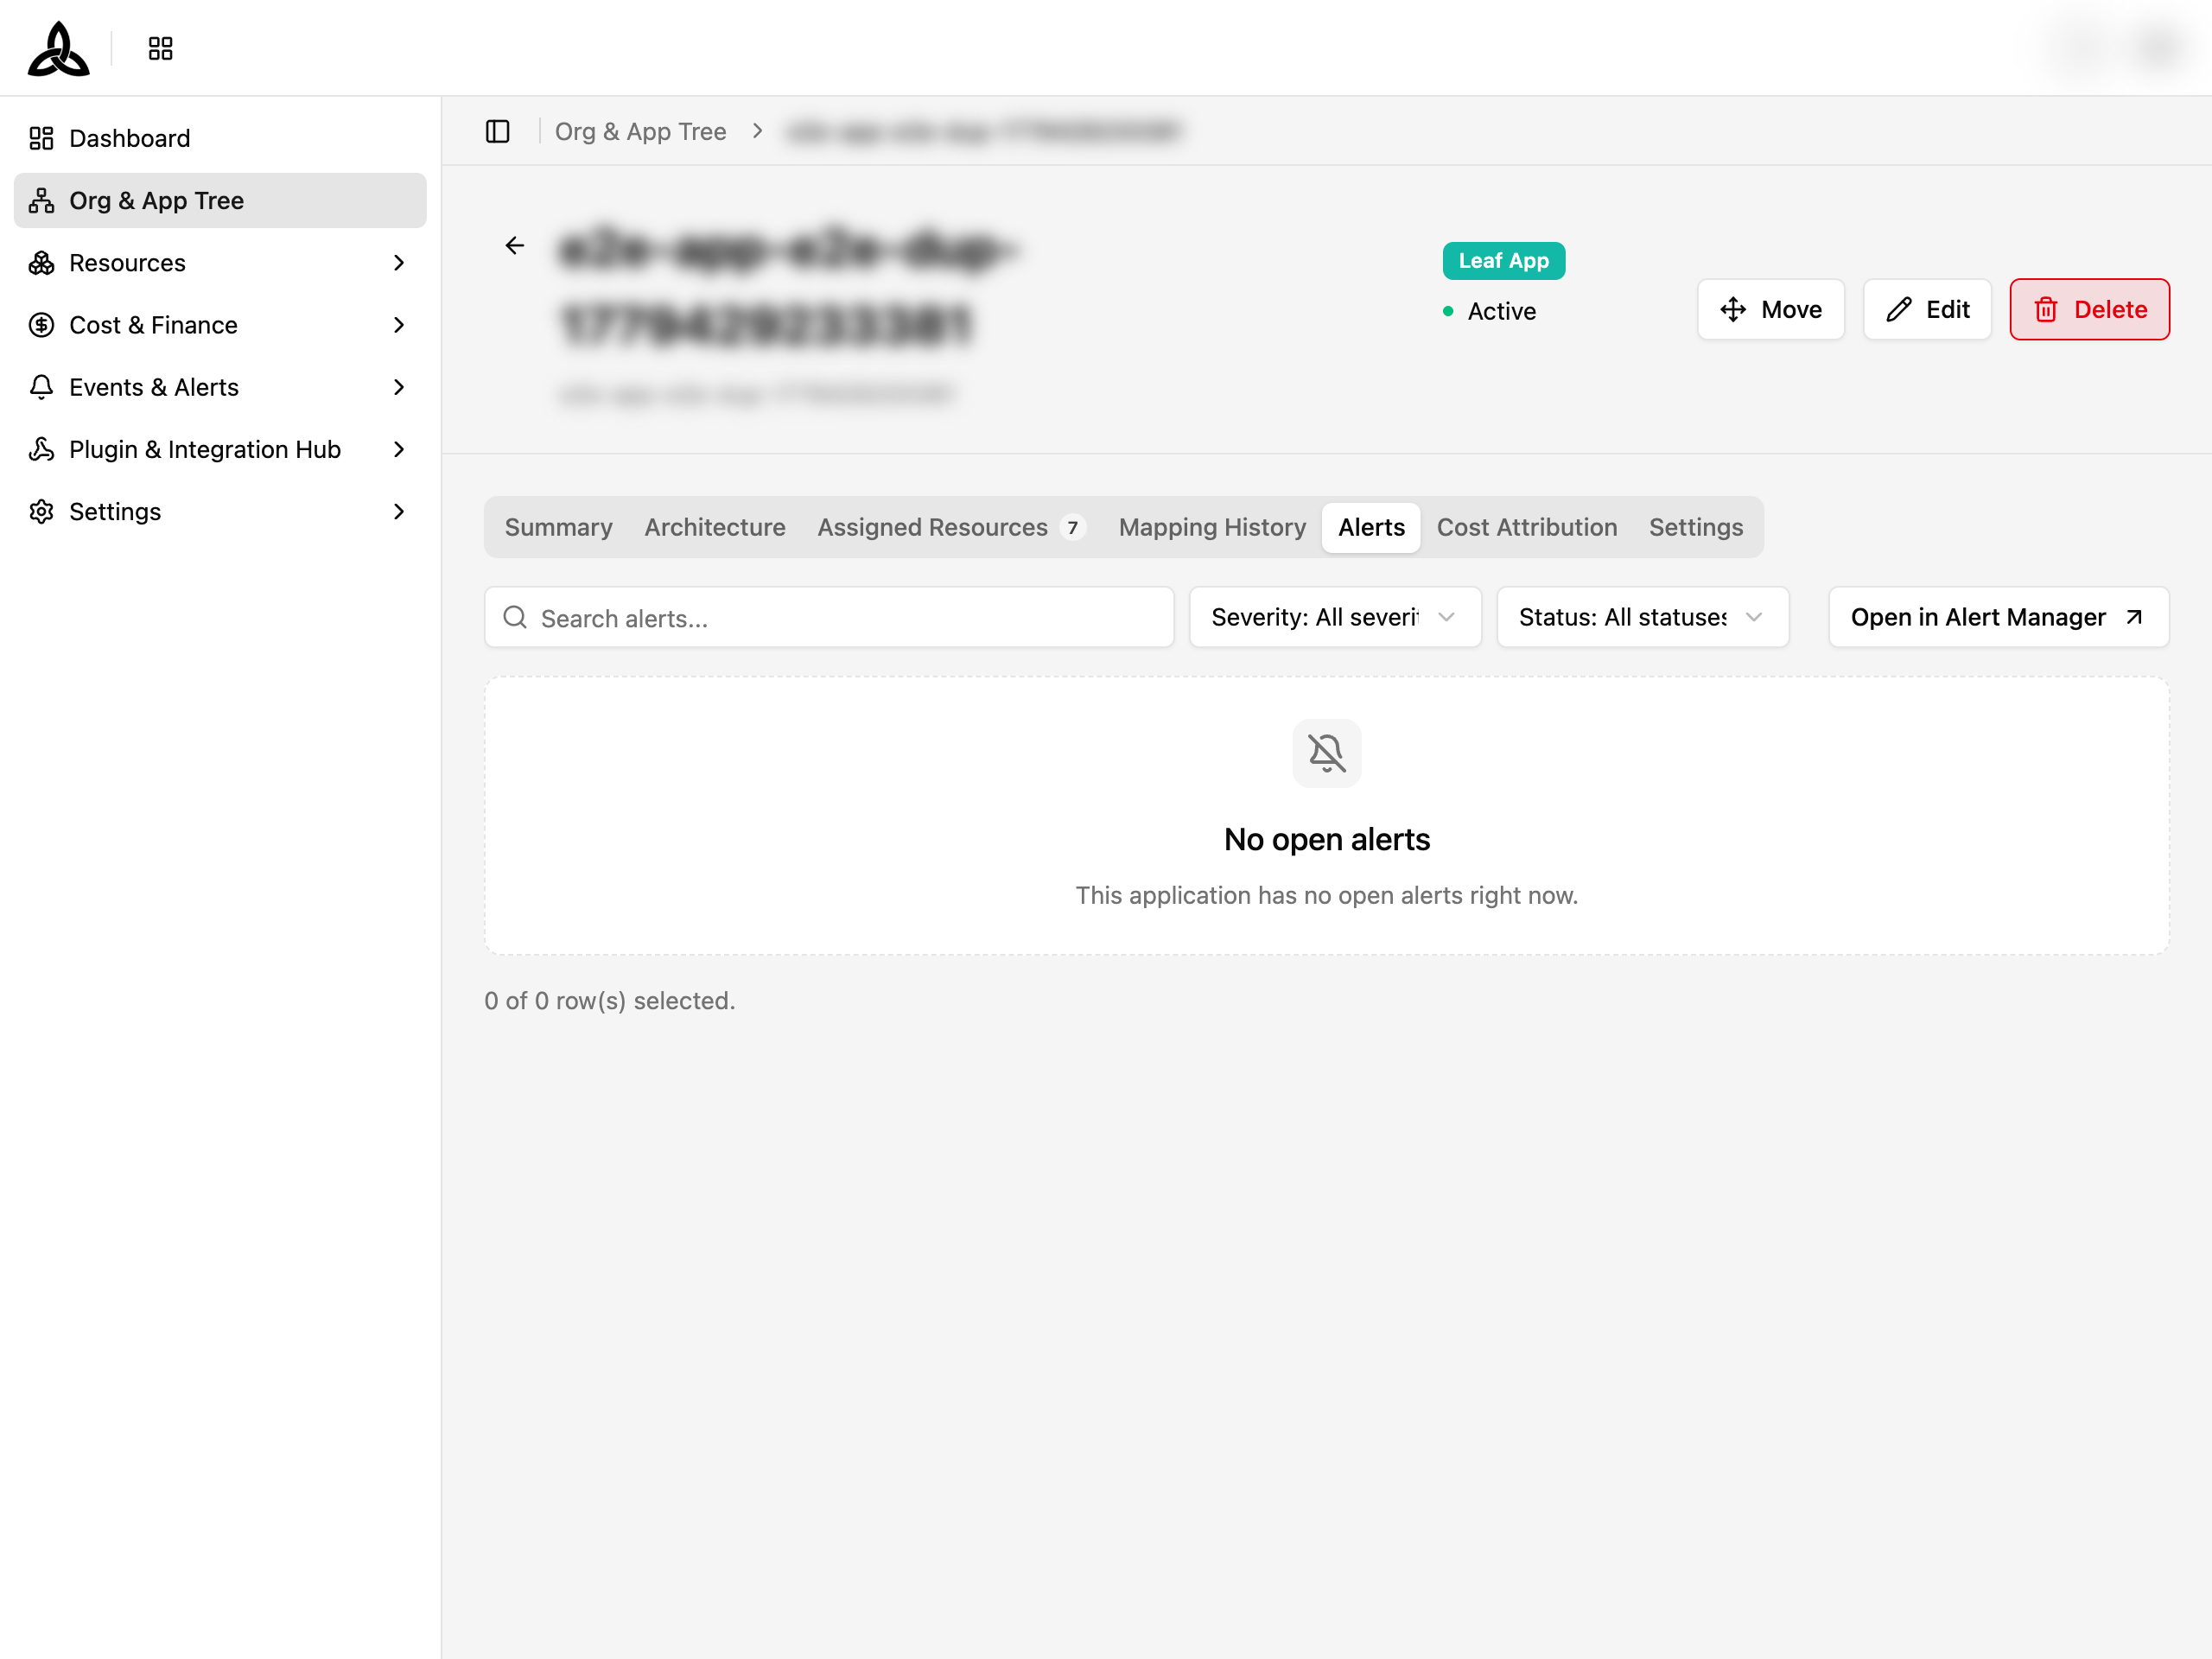
Alerts
Active alerts related to resources in this application.
Cost Attribution
Cost attributed to this application, in Effective, Billed, and List terms.
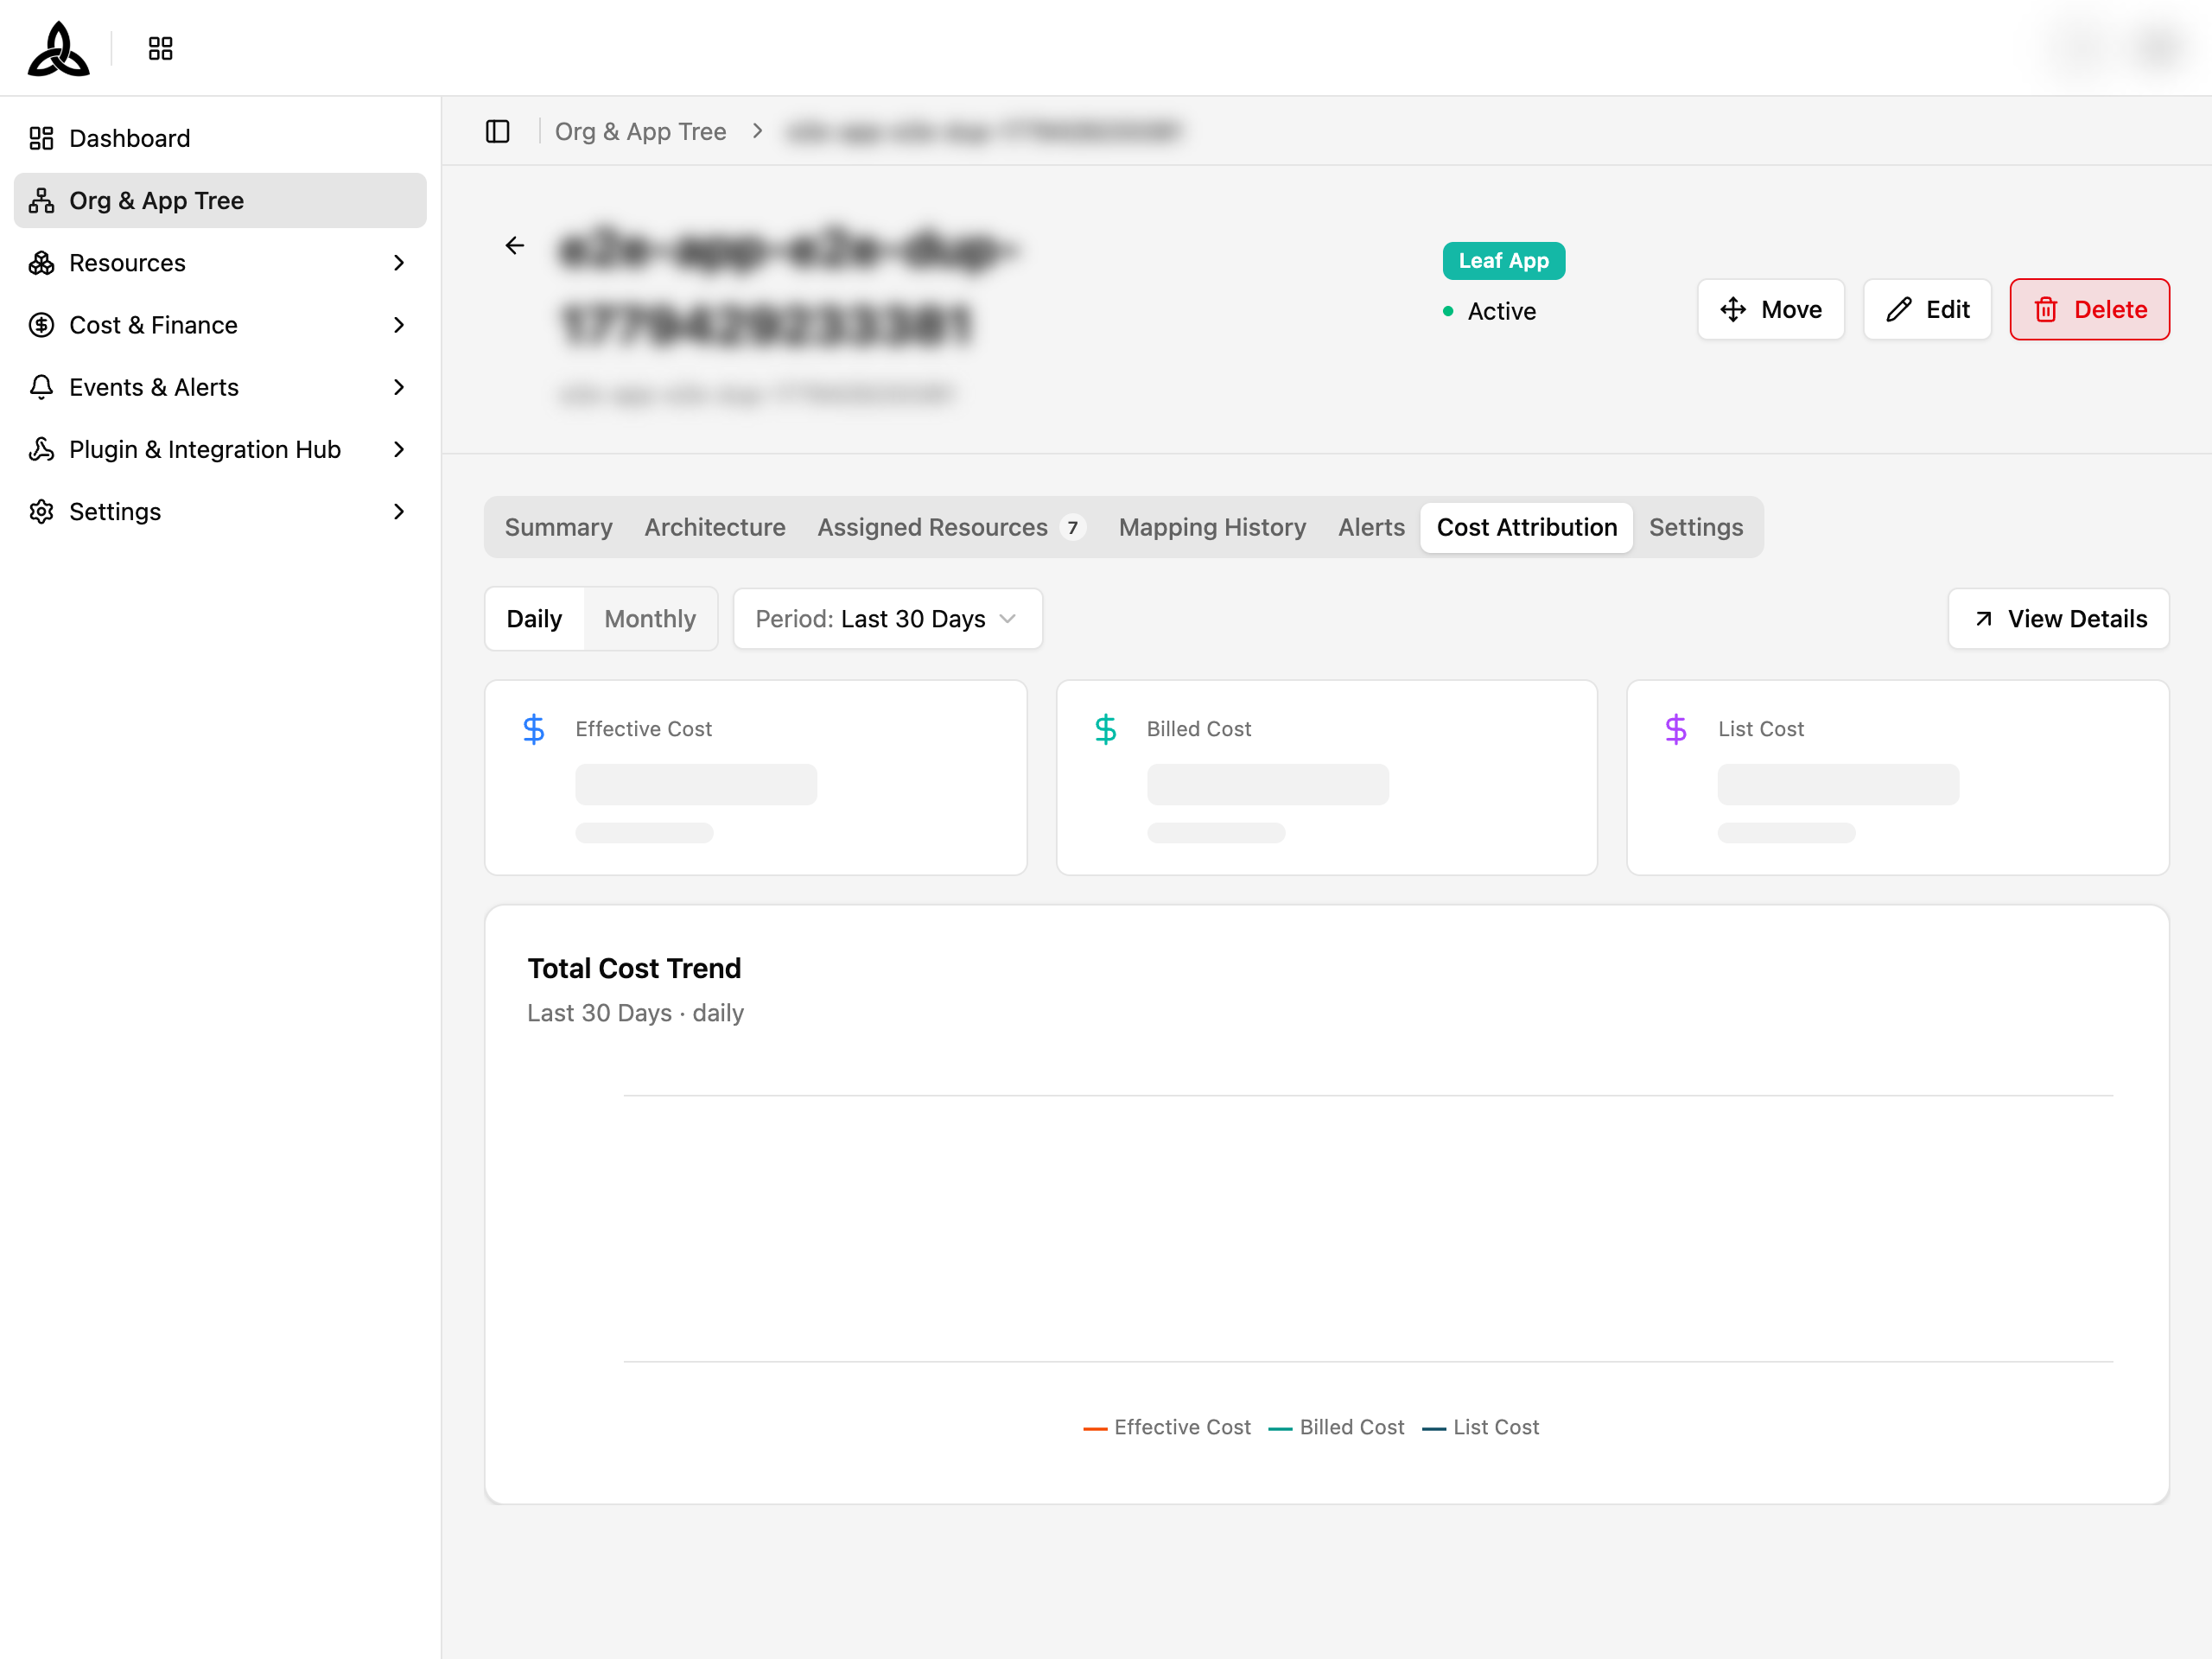
| Control | What it changes |
|---|---|
| Daily / Monthly | The bucket size of the chart |
| Period | How far back to look |
| Trend / Cumulative | Whether the chart shows cost per bucket or a running total |
| View Details | Opens the same scope in Cost Analysis |
A dotted divider separates Billed from Estimated, so the point where settled cost ends is visible on the chart itself.
Notifications
Application notification settings — manage the application manager and configure notification recipients.
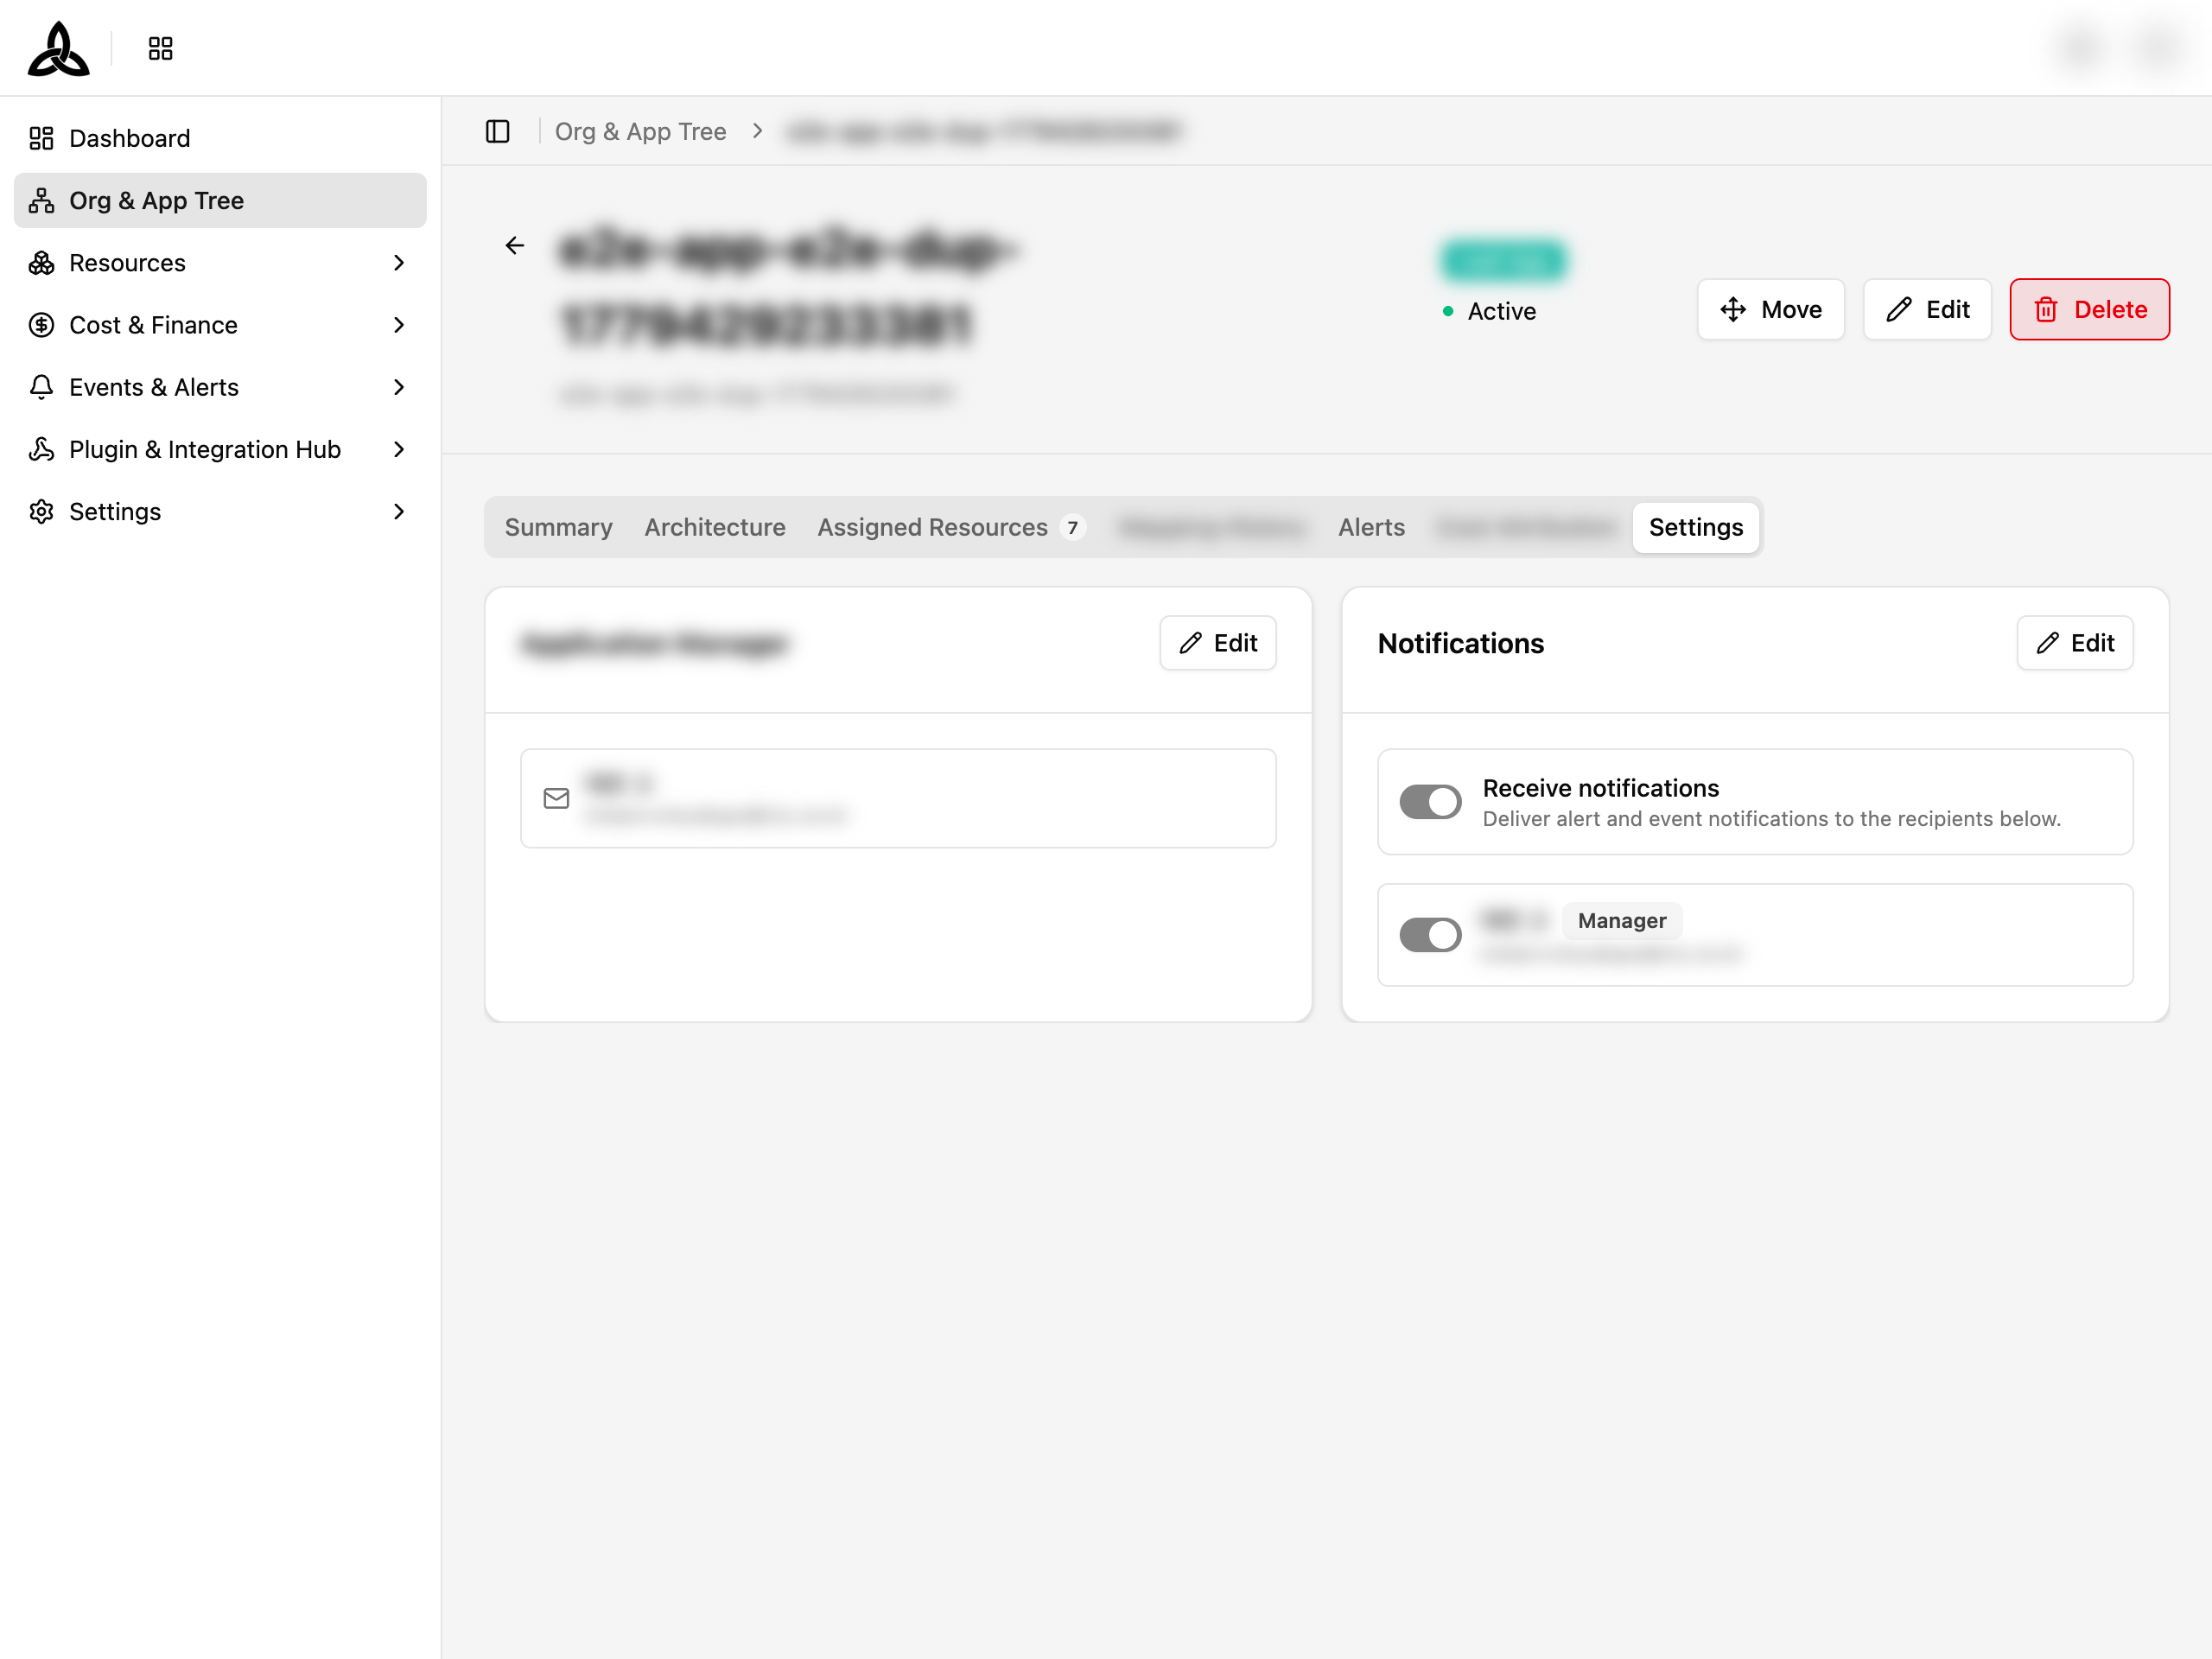
| Section | Description |
|---|---|
| Application Manager | Assign a manager for this application (leaf apps only) |
| Notifications | Toggle Receive notifications to deliver alert and event notifications to listed recipients |