Home
The Home page is the landing page of your workspace. It provides key workspace metrics in a dashboard format.
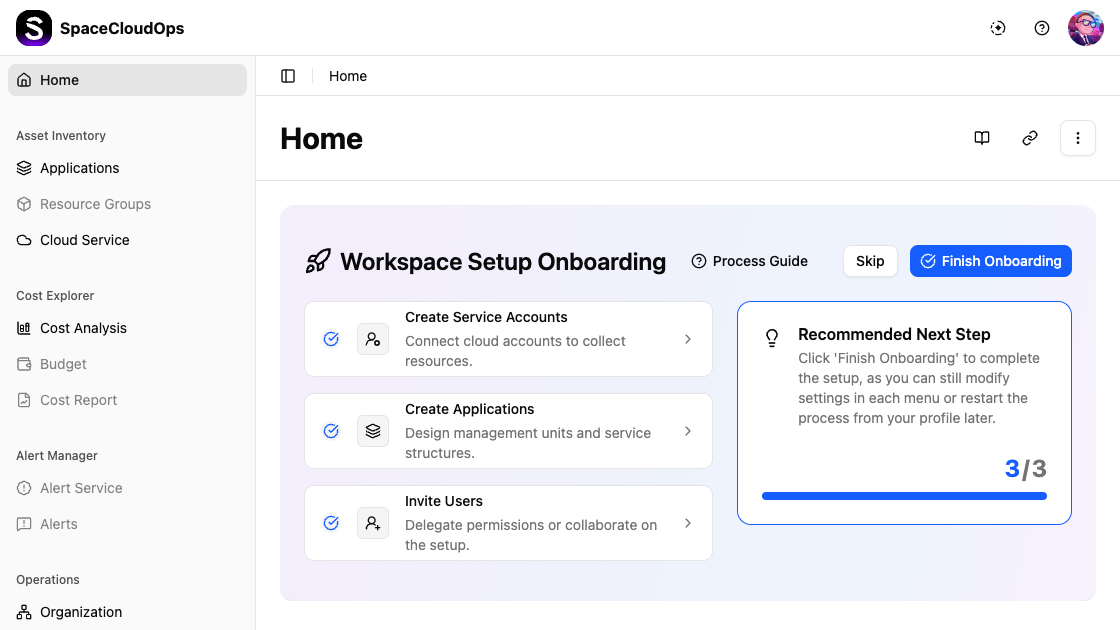
Page Actions
The top-right corner of the Home page provides quick access buttons:

| Button | Description |
|---|---|
| Documentation | Opens the SpaceCloudOps documentation site |
| API Guide | Opens the API reference guide |
| More actions (⋮) | Additional options such as restarting the onboarding setup |
Dashboard
The Home page displays summary widgets showing key metrics of your workspace.
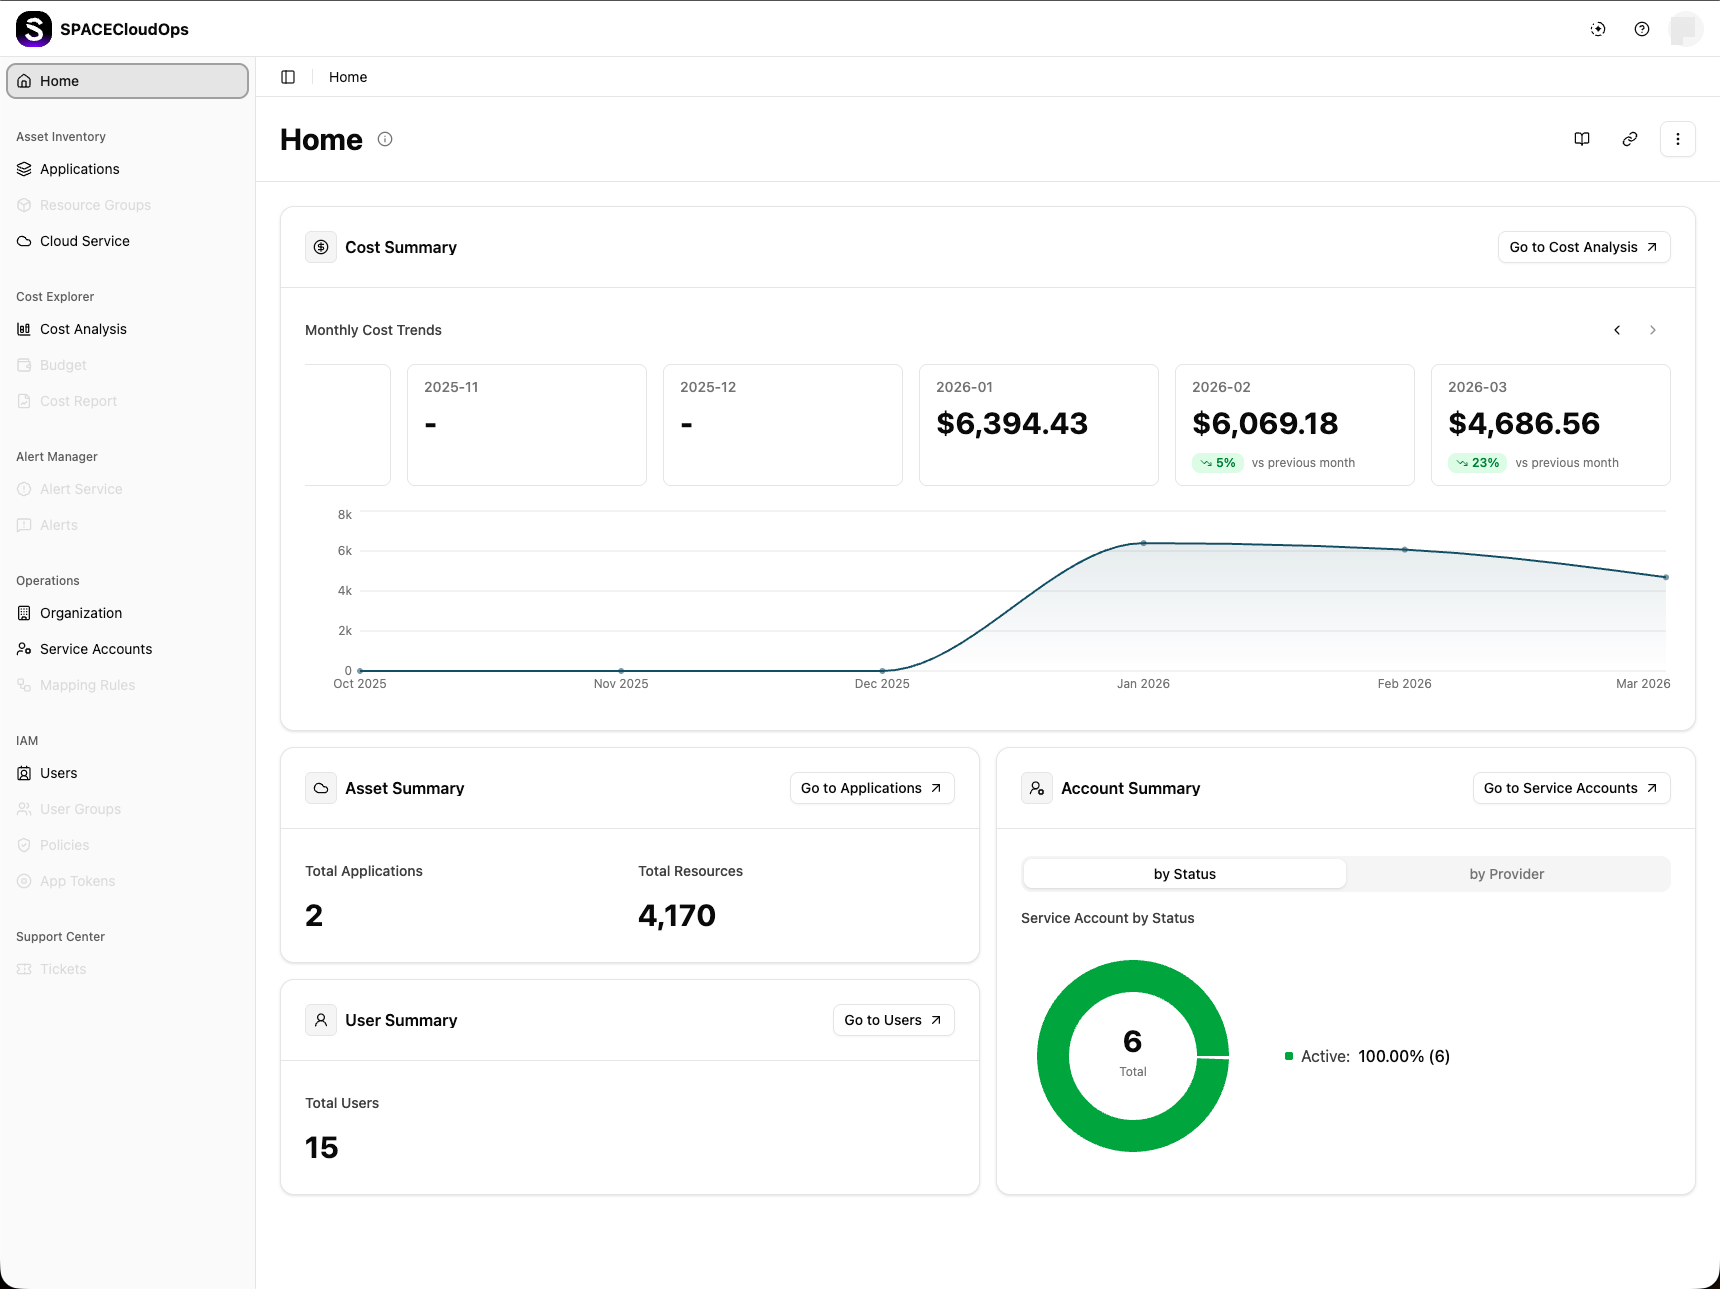
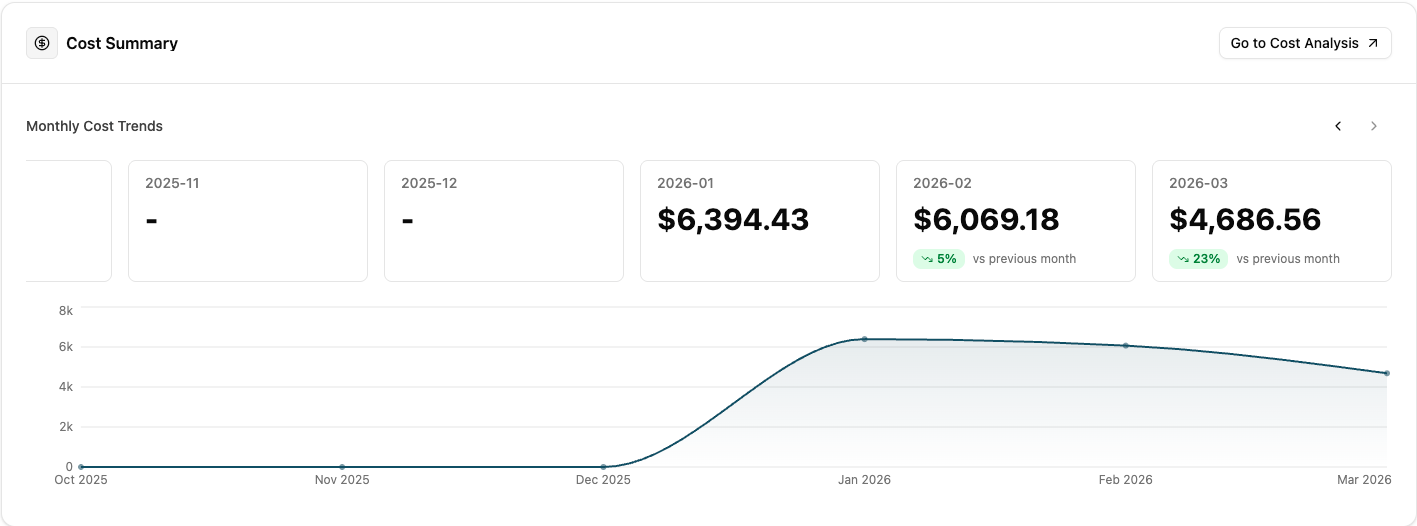
Cost Summary
The Cost Summary widget shows monthly cost trends for the last 6 months.
Monthly Cost Cards — Each card displays:
| Element | Description |
|---|---|
| Month | The billing period in YYYY-MM format |
| Cost | The total cost for that month in USD. Shows - if no data is available |
| Trend | Percentage change compared to the previous month (up/down/unchanged) |
Use the ← and → arrow buttons to scroll through month cards. Click the ⓘ icon next to “Monthly Cost Trends” to view status descriptions.
Below the month cards, a Cost Trend Chart visualizes the 6-month cost trend as an area chart. The X-axis shows months and the Y-axis shows cost amounts.
Asset Summary
The Asset Summary widget displays:
| Metric | Description |
|---|---|
| Total Applications | The number of applications registered in the workspace |
| Total Resources | The total count of cloud resources across all applications |
User Summary
The User Summary widget provides an overview of users in the workspace, showing the total user count.
Account Summary
The Account Summary widget shows service account statistics with two views:
| View | Description |
|---|---|
| by Status | A donut chart showing the distribution of service accounts by their status (Active, Inactive, etc.) |
| by Provider | A breakdown of service accounts by cloud provider |