Flow Studio
On the [Flow Studio] page, you can see how your service actually flows — from account connection through applications, events, and cost — on one canvas. Every other menu shows you its own list; this page shows the connections between them, so you can spot where the flow broke and jump straight to the menu that fixes it.
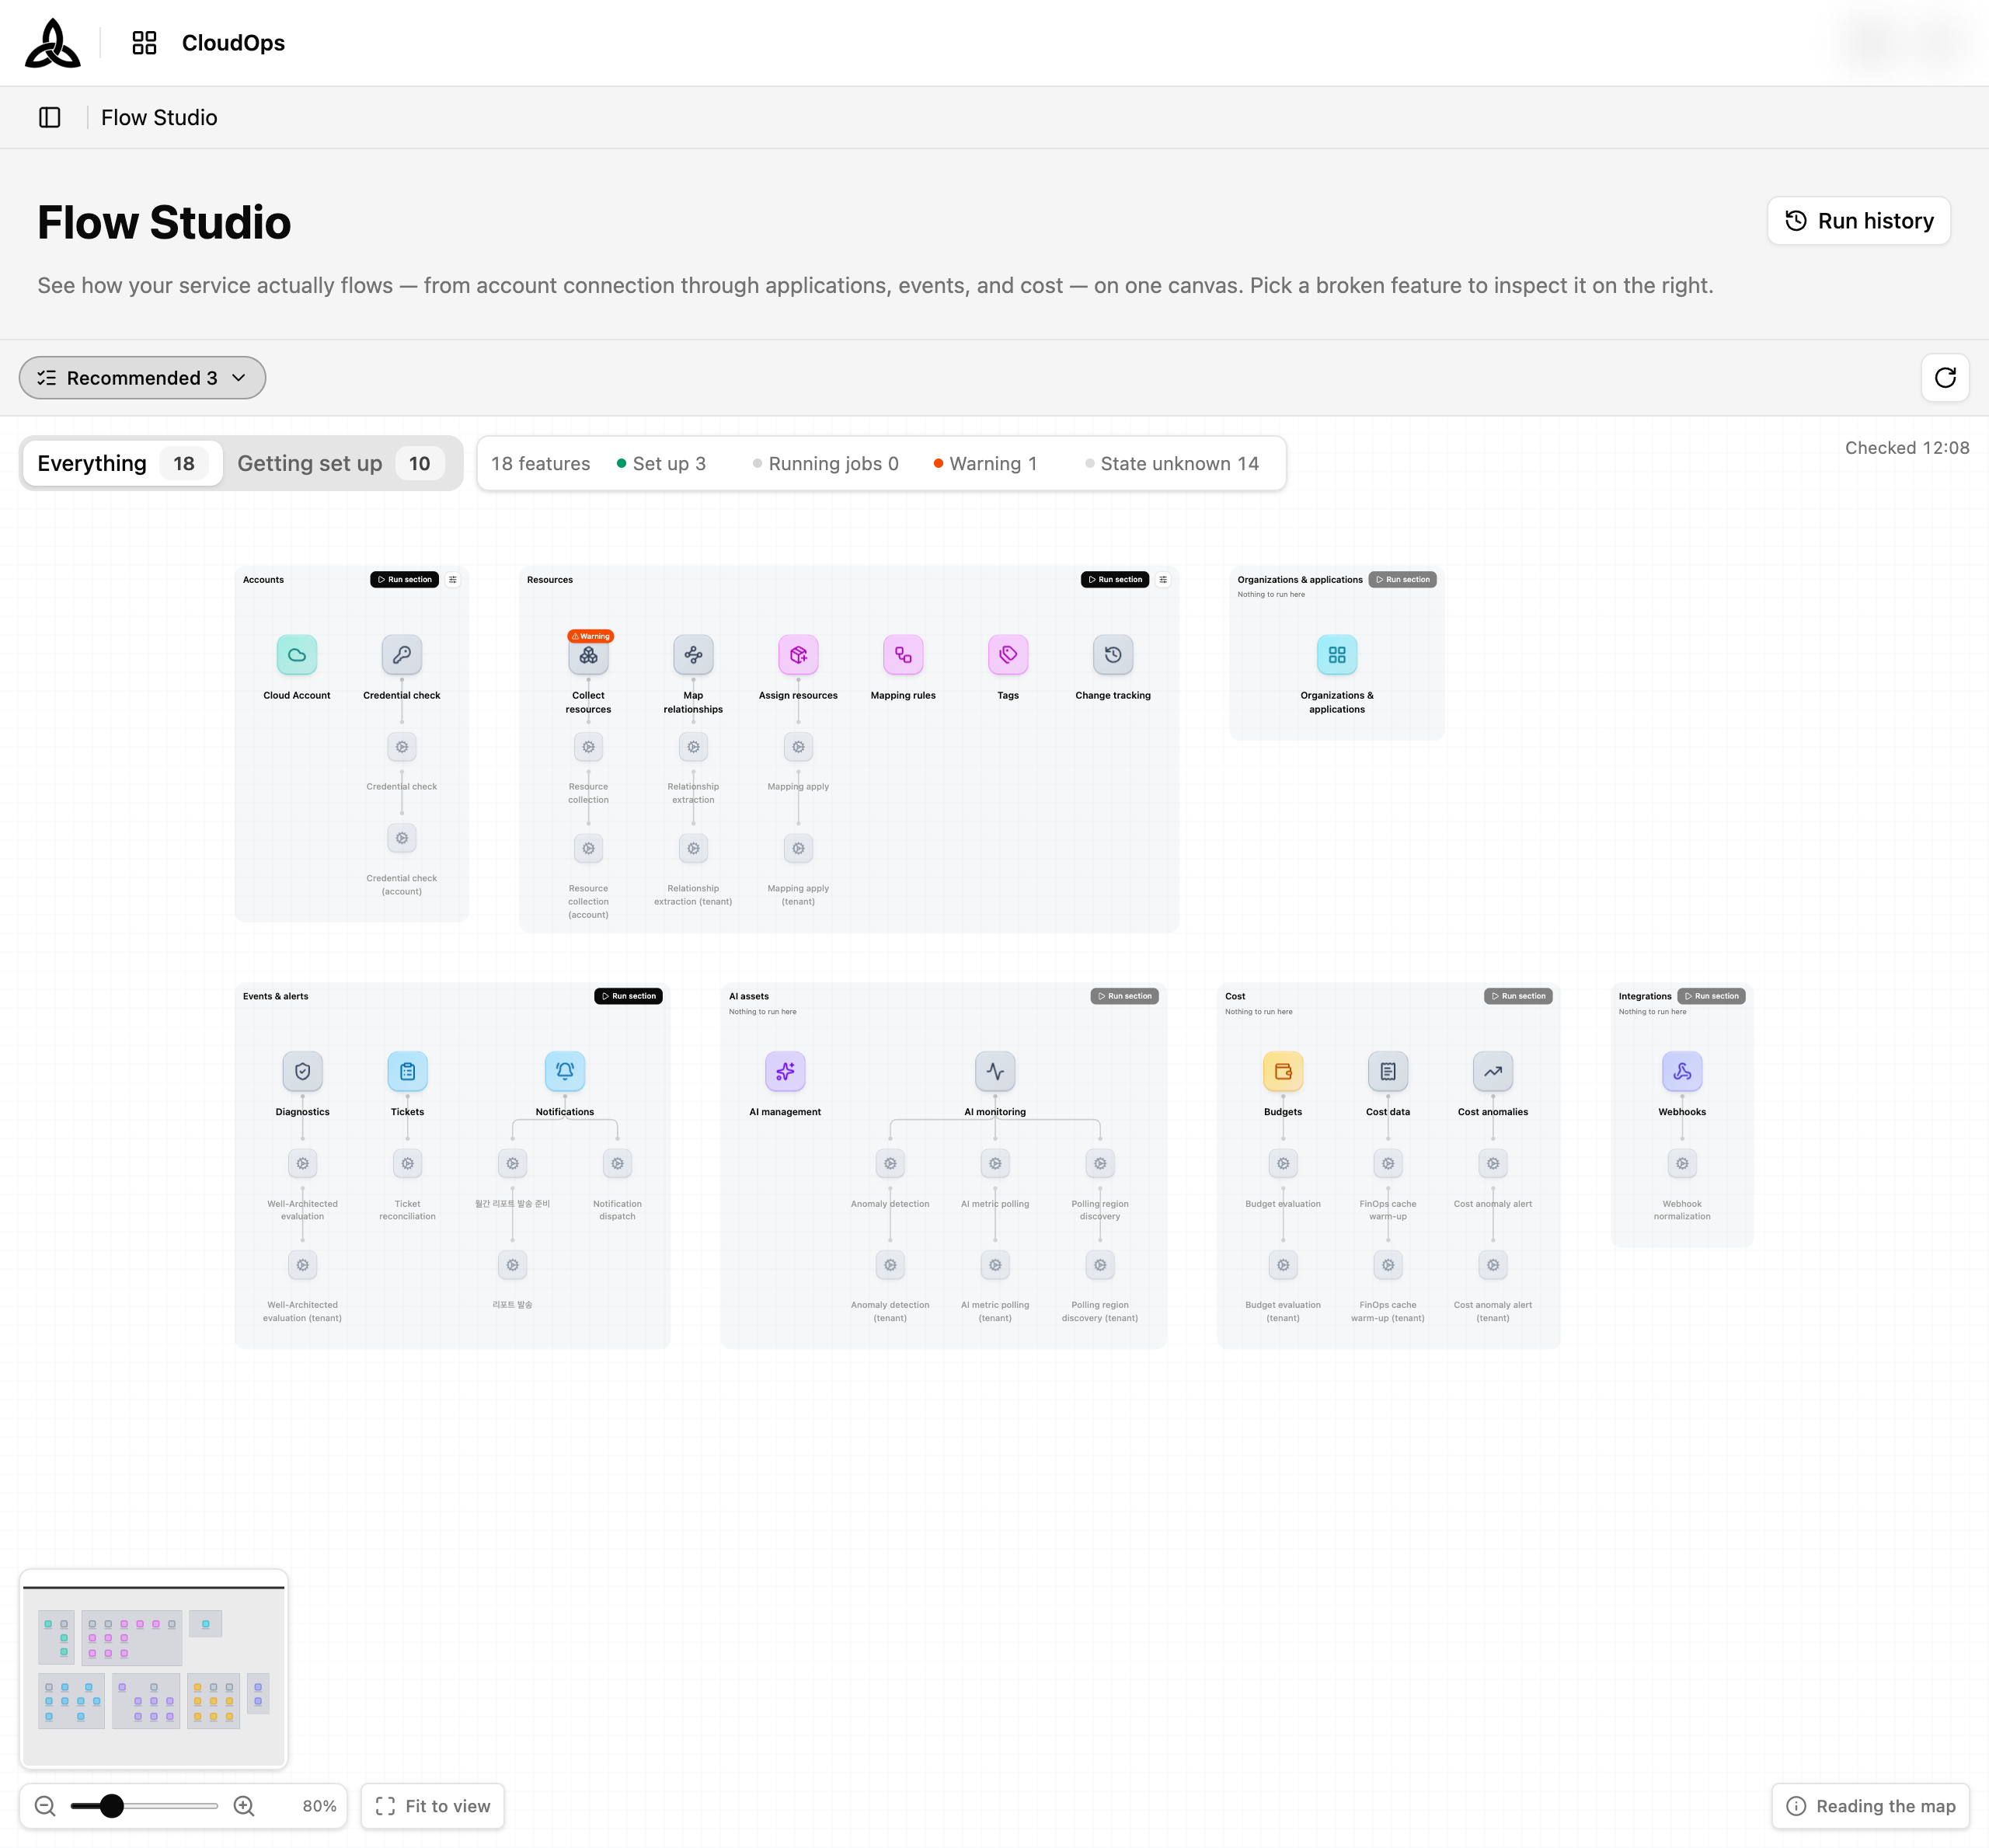
Page Layout
The page has three layers, stacked top to bottom.
| Area | Description |
|---|---|
| Header | The page title and the [Run history] button, which opens the run-history screen |
| Bars | Two rows — a guidance row (what to do next, when the data was last checked, [Refresh]) and a status row (the view switch and status chips) |
| Map | The canvas itself — features grouped into sections, with the connections between them |
Selecting a feature on the map opens a detail panel on the right. The map is a read-and-navigate surface: you inspect a feature here, then open the owning menu to make the change.
Reading the Map
Sections, features, and tasks
The map nests three levels, and the words are worth keeping straight because the screen uses them consistently:
| Level | What it is |
|---|---|
| Section | A box grouping features — Accounts, Resources, Organizations & applications, Diagnostics & improvement, AI assets, Events & alerts, Integrations, Cost. Also the unit you can run, via [Run section] on the box header |
| Feature | One node on the map. This is what you select, inspect, and open |
| Task | The individual jobs a feature runs. Hidden until you expand the feature |

Features that are not part of the required path are grouped under Optional setup, which has no section-run button.
Node states
Each feature node shows its name, a status, and a short measure of what it currently holds.
| State | Meaning |
|---|---|
Set up | The feature is satisfied |
Running jobs | A run is in progress on this feature |
Failed | The last run stopped |
Warning | The last run finished, but something in it needs a look |
Waiting | An earlier feature has not produced what this one needs |
Not set up | Nothing registered here yet |
State unknown | The map cannot tell — check the feature’s own menu |
A greyed-out node means there is nothing for you to register — it either runs once the earlier feature is in place, or its data lands from outside.
A node that is waiting says what it is waiting for in words, naming the feature: Create 「Cloud Account」 and this runs, or Once 「Resource Collection」 finishes, this runs.
The measure on a node
The number under a node’s name is labelled in the cell itself — 128 resources, 12 rules, 43 of 50 accounts, 3 running — rather than being a bare figure you have to recognise. Where a feature works through targets one by one, the node shows progress against the total, and how many of them failed or are still going.
Select the ⓘ on a node to read what that particular measure counts.
Expanding a feature
A feature that runs more than one job can be expanded to show the tasks behind it, either from the node itself or from Execution breakdown in the detail panel.
| Row | Meaning |
|---|---|
| Repeats per target | The task runs once per account or resource, not once overall |
| Last success | When that task last finished cleanly |
| Activity names | A toggle that swaps friendly task names for the internal activity names |
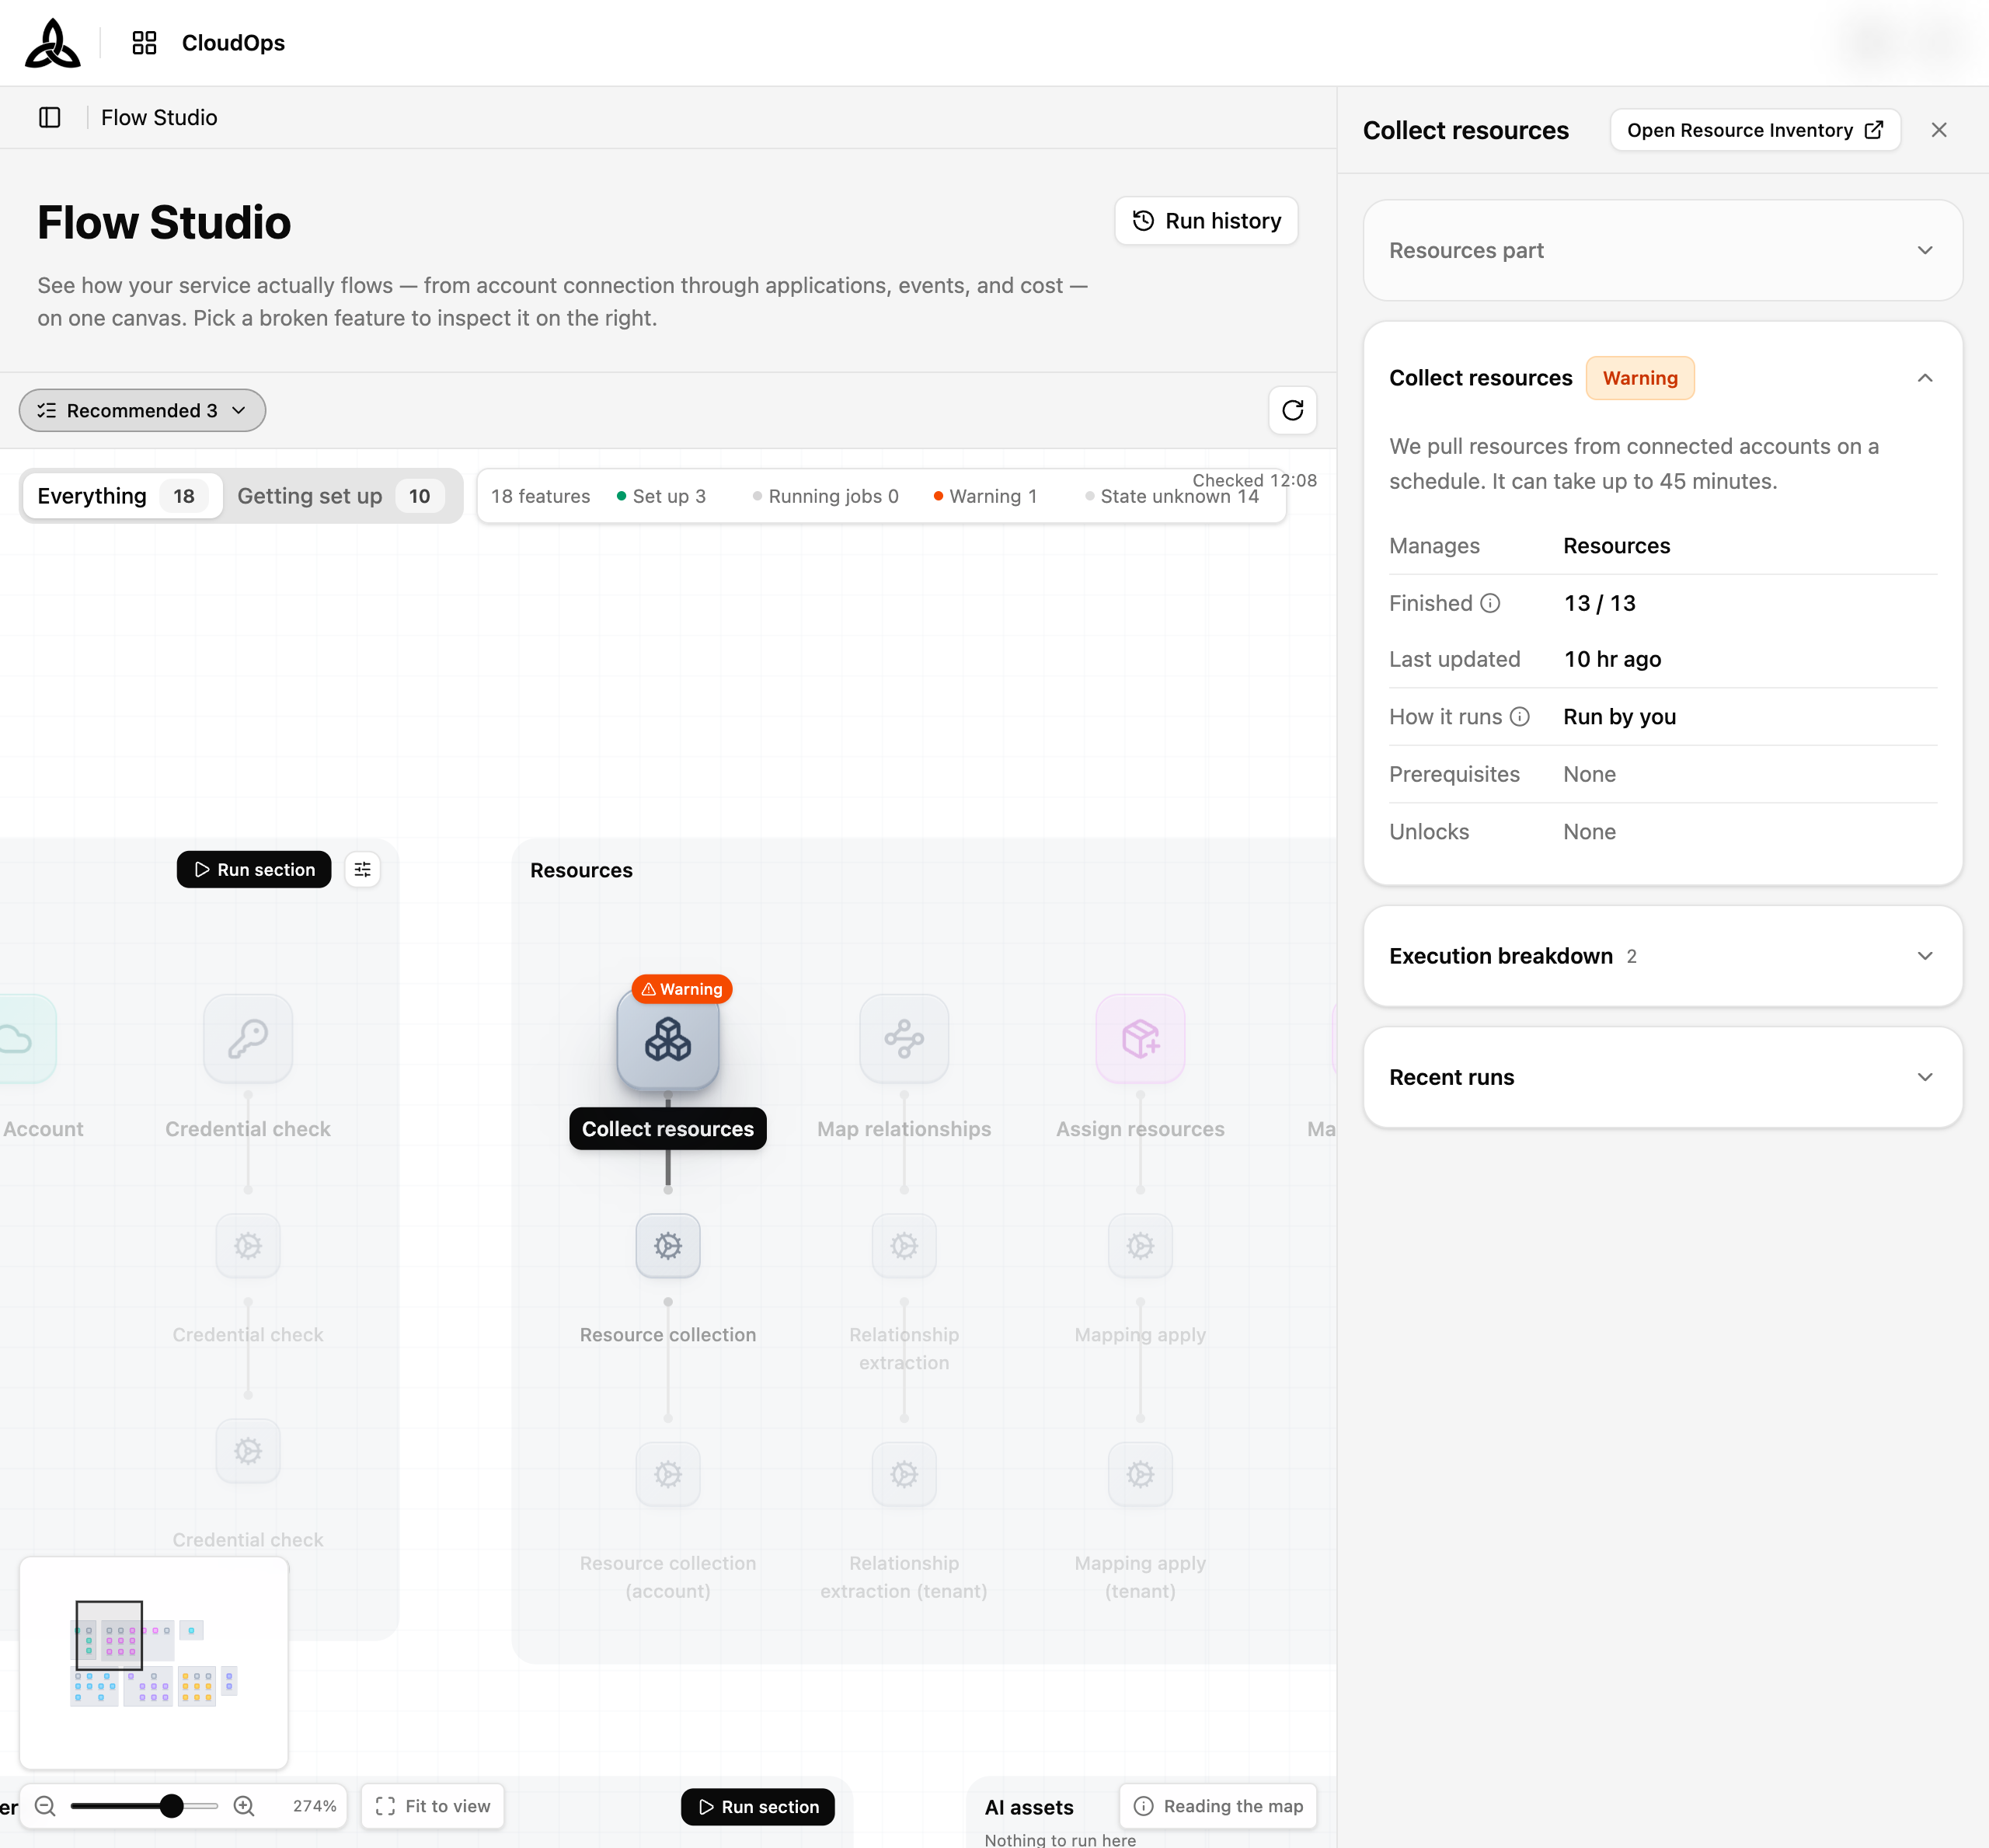
Features with nothing to expand say so — a single save or a read-only view has no tasks behind it.
Connections
Select the information icon at the bottom-left of the canvas to open Reading the map, which explains what the lines mean.
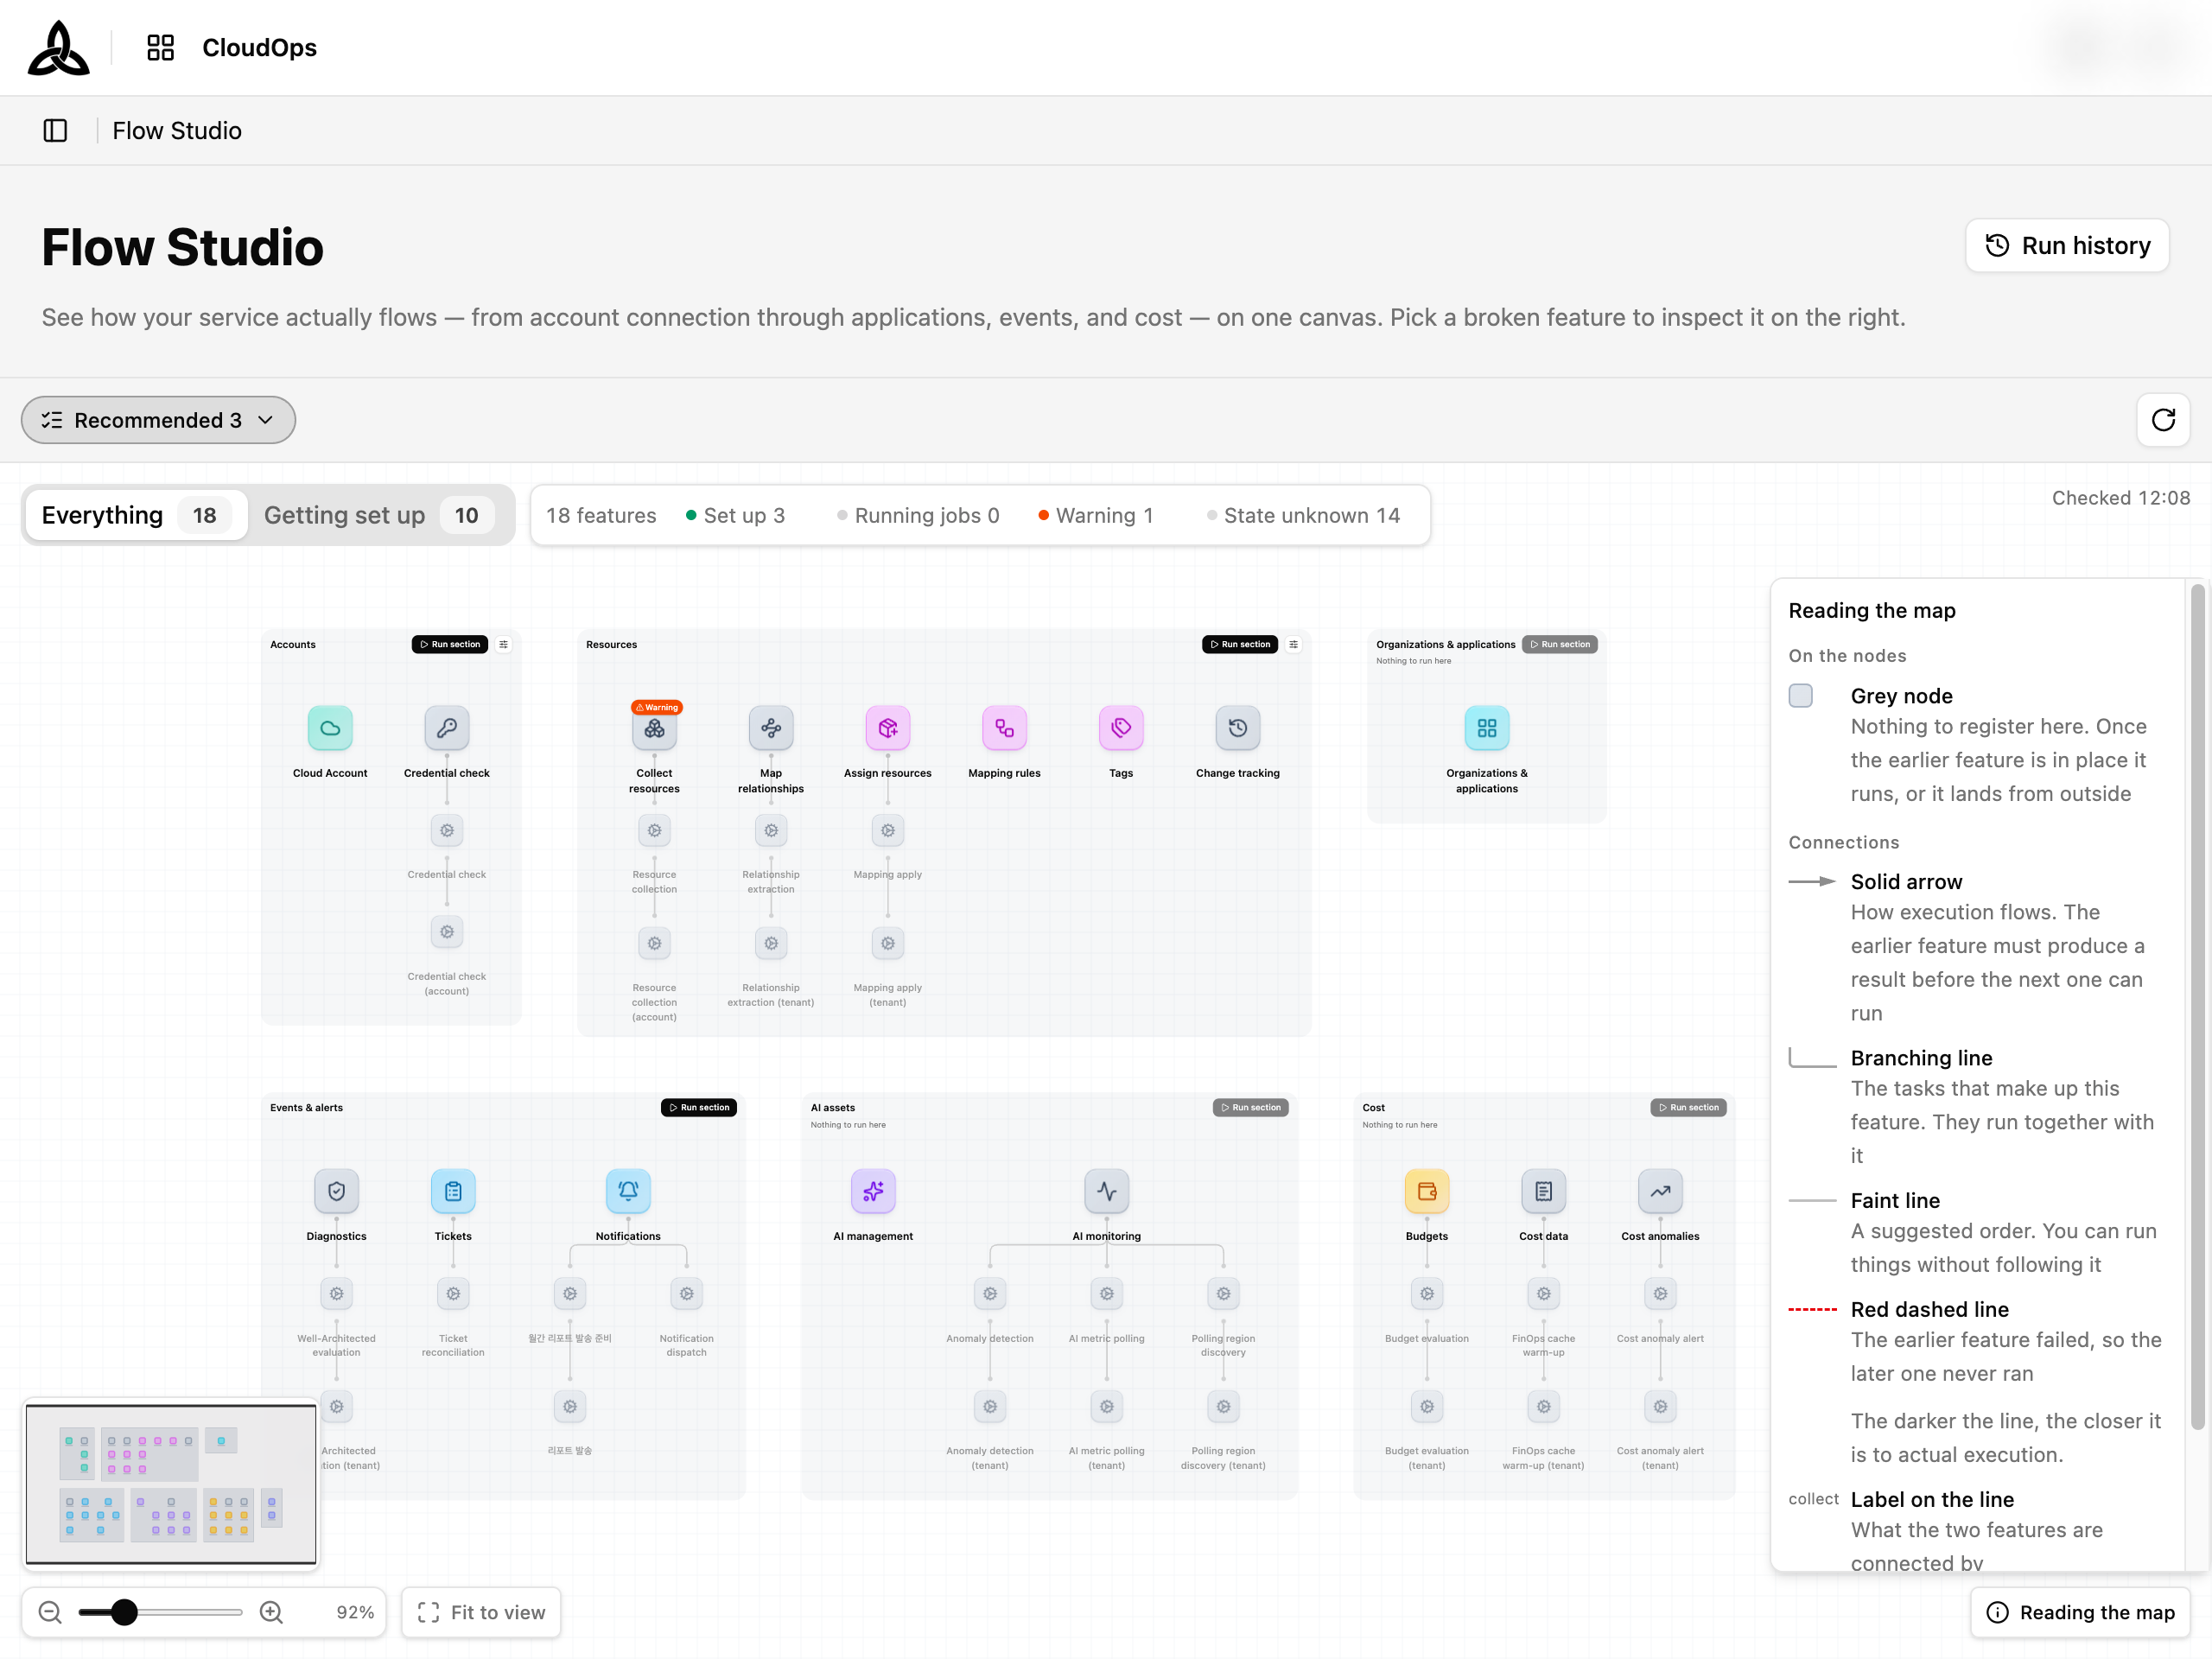
| Line | Meaning |
|---|---|
| Thick line | The recommended order. You can still run things out of order |
| Arrow | The earlier feature has to produce a result before the later one can go |
| Label on the line | What the two features are connected by |
| Red dashed line | The earlier feature failed, so the later one never ran |
Choosing What the Map Shows
The status row carries two controls. They look alike, but they act on the map in different ways, and the difference is deliberate.

Views
The view switch decides which features the map draws at all.
| View | Shows |
|---|---|
| Everything | Every feature of the journey, weighted the same |
| Getting set up | Only the features you open yourself — the screens you create, edit, or read |
Switching away from Everything removes the other features from the canvas rather than fading them, so the map genuinely gets smaller. A connection that only ran through a removed feature is folded up, joining the remaining features directly, so the flow still reads end to end instead of looking broken. Features that remain keep the position they had, so nothing has to be found again.
Status chips
The chips beside the feature count — Set up, Running jobs, Failed, Warning, Waiting, Not set up, State unknown — pick out the features in one state. Hovering a chip explains what it lights up.
Unlike the view switch, a chip dims everything else instead of removing it. The chip answers which features are in this state, and the rest of the map has to stay on screen for that answer to be readable as a part of the whole. The map also moves to the matching features, so you do not have to look for them.
| Behaviour | Detail |
|---|---|
| Counts | Each chip counts only what the current view draws, so a chip never claims something the map does not show |
| Hidden chips | A state that no feature is currently in has no chip |
| Clearing | Select the active chip again, or press Esc |
What Is Running Right Now
When runs are under way, an In progress band sits above the map and says what the map alone cannot: that work is happening, on what, and since when.
Each entry names the feature and reads out:
| Part | Example |
|---|---|
| Who started it | Started manually, <name> is running it now, or Scheduled run in progress |
| What it covers | Whole tenant, 12 accounts, or Selected accounts |
| How long it has been going | 54 min in, 2 hr in |
[Open
54 min in is not 54 min ago. The band counts up from the start of a run that is still going; the 54 min ago in a detail panel is when a finished run ended. The two sit near each other on screen, so the wording is deliberately different.The band does not refresh itself — it is as of the Checked time, same as the map. Use [Refresh] to see where a run has got to.
Feature Detail
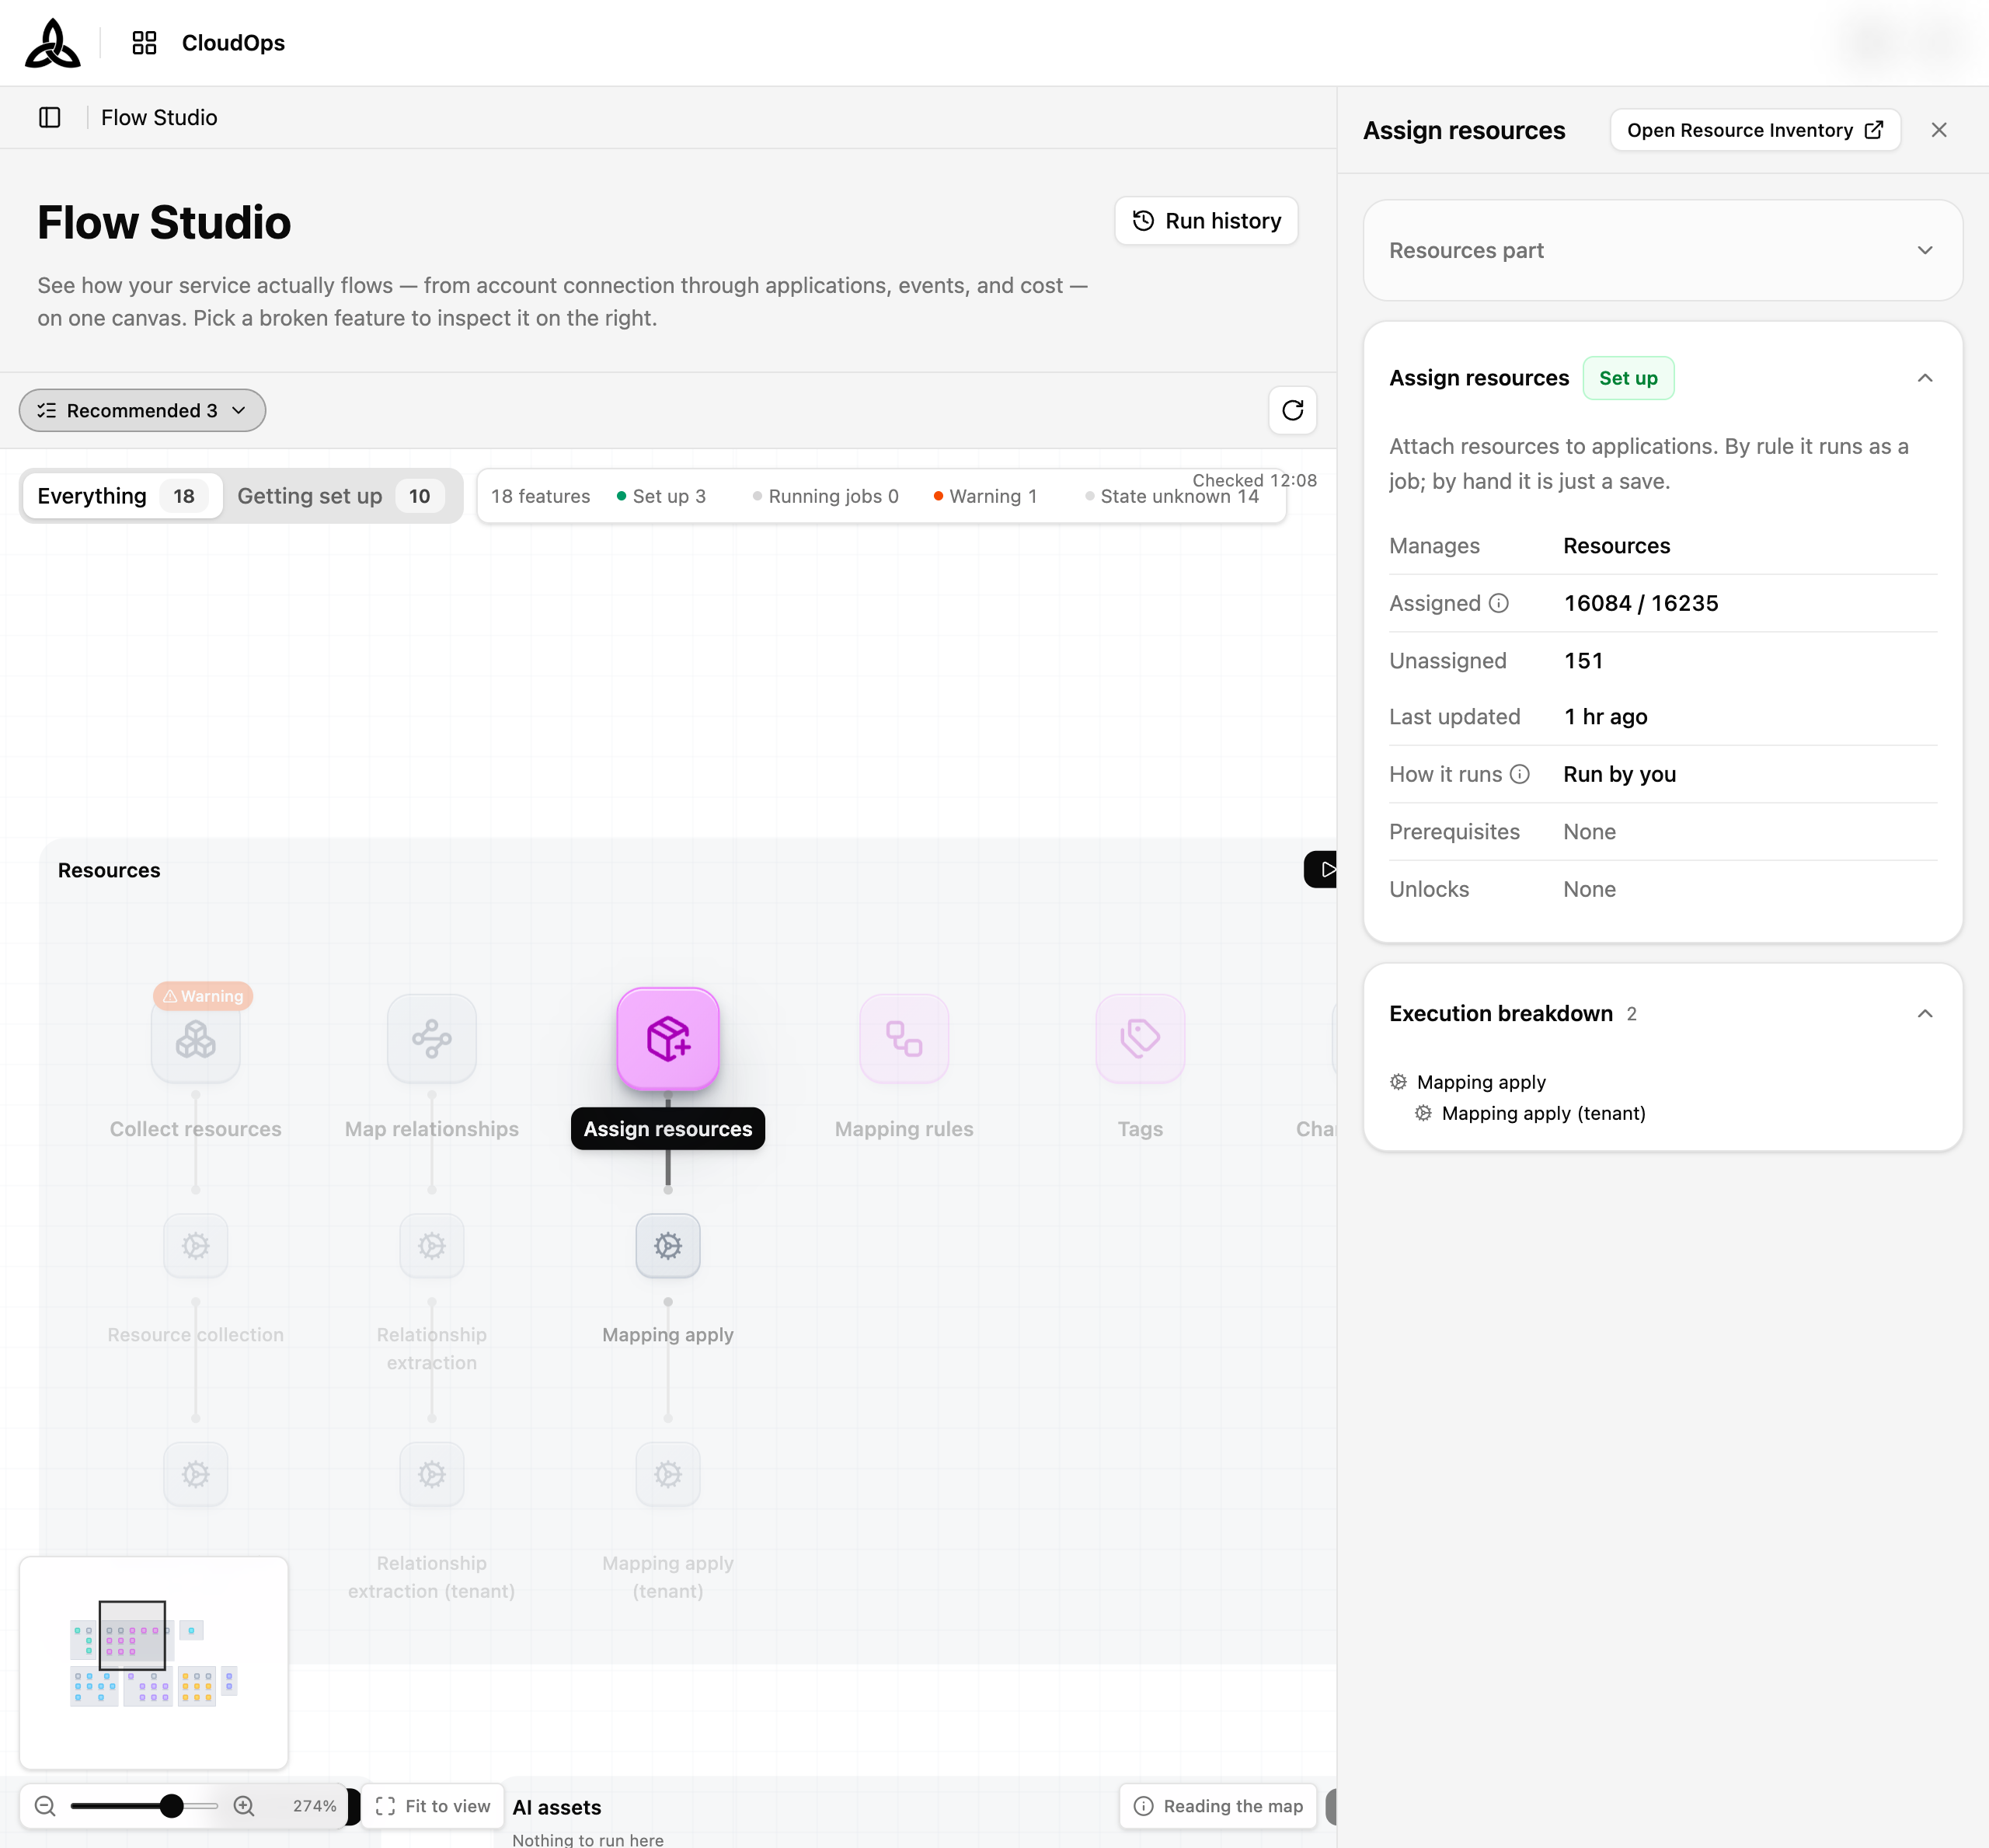
Selecting a feature opens its detail panel. Every feature uses the same five sections, so the panel reads the same way wherever you are.
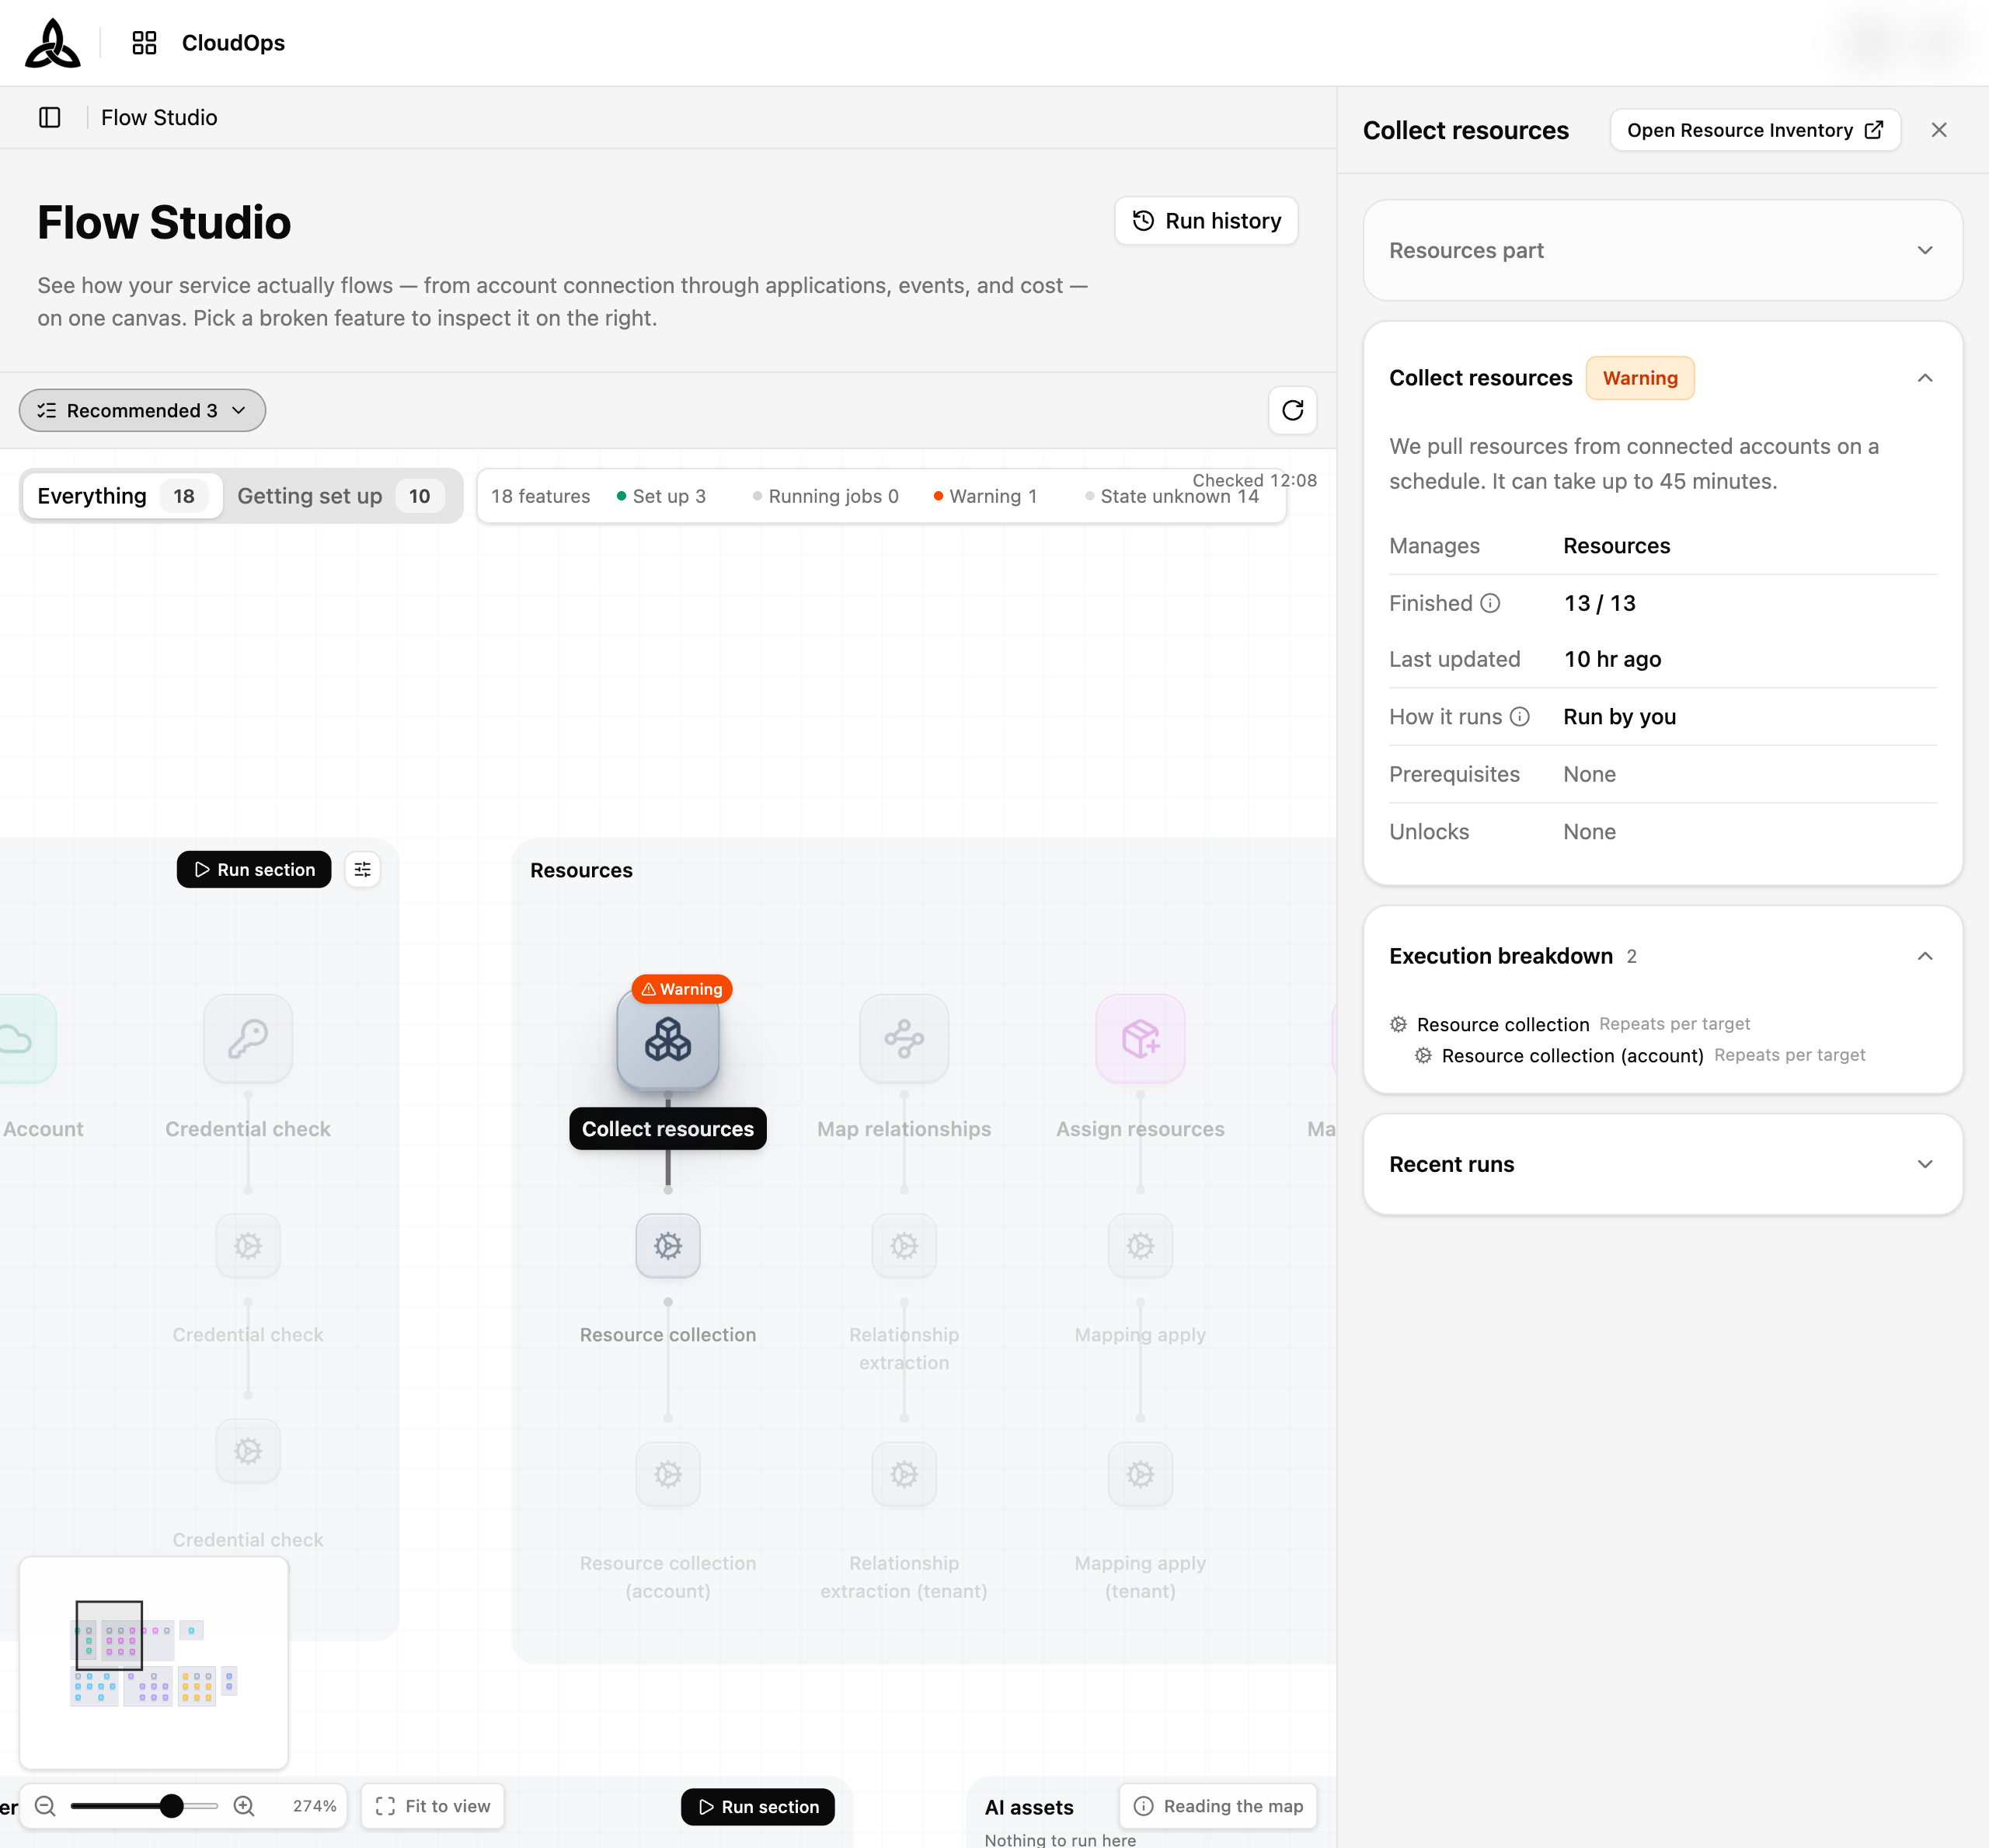
| Row | Description |
|---|---|
| (heading) | The feature’s name, its status badge, and a sentence saying what it does |
| Manages | What the feature produces — Resources, Applications, Cost, and so on |
| Finished | How much of its work is done, as a count against the total — 13 / 13 |
| Last updated | When its result was last refreshed |
| How it runs | Whether you run it, CloudOps runs it, or it arrives from outside |
| Prerequisites | Features that have to produce a result first, or None |
| Unlocks | Features this one opens up, or None |
| Execution breakdown | The tasks behind this feature — see below |
| Recent runs | The ten most recent runs, with [Open run history] for the rest |
The button at the top of the panel opens the menu that owns the results — [Open Resource Inventory] in the example above. It opens in a new tab so you keep the map. Features whose data arrives from an external pipeline have no such button.
Runs by
The Runs by row tells you what a run covers, which is not the same for every feature.
| Value | Meaning |
|---|---|
| Per account | You can narrow the run to specific accounts |
| Tenant-wide | It runs across the whole tenant and cannot be narrowed, even while you are inspecting one account |
Features that need attention
When a feature has open issues, the panel leads with them — an issue count next to the status badge and a callout above the summary.
The callout is written for the case at hand rather than being a generic warning:
| Case | What it says |
|---|---|
| Nothing registered yet | Fill this in to unlock the next step |
| The latest run failed | Check where it stopped, then run it again |
| Some targets need a look | Check the targets that failed or ended with a warning |
| Some targets have not been processed | Run the remaining targets to fill in the results |
| These results are out of date | Run it again to refresh them |
Where several accounts failed for different reasons, it says so and sends you into the feature rather than guessing a single cause.
Running
Running a section
Selecting [Run section] on a section header runs that whole section and opens the detail panel of the first feature that actually runs, so you can watch it start.
Where the section can be narrowed, the button offers both: [Run all] takes the whole scope, [Run selected] opens the scope picker below. The button also states the scope it is about to take — Run the Resources section · 12 accounts, Run the Cost section · whole tenant — so you can read what will happen before selecting it.
A section with nothing runnable in it says Nothing to run here rather than offering a button that would do nothing.
Choosing what a run covers
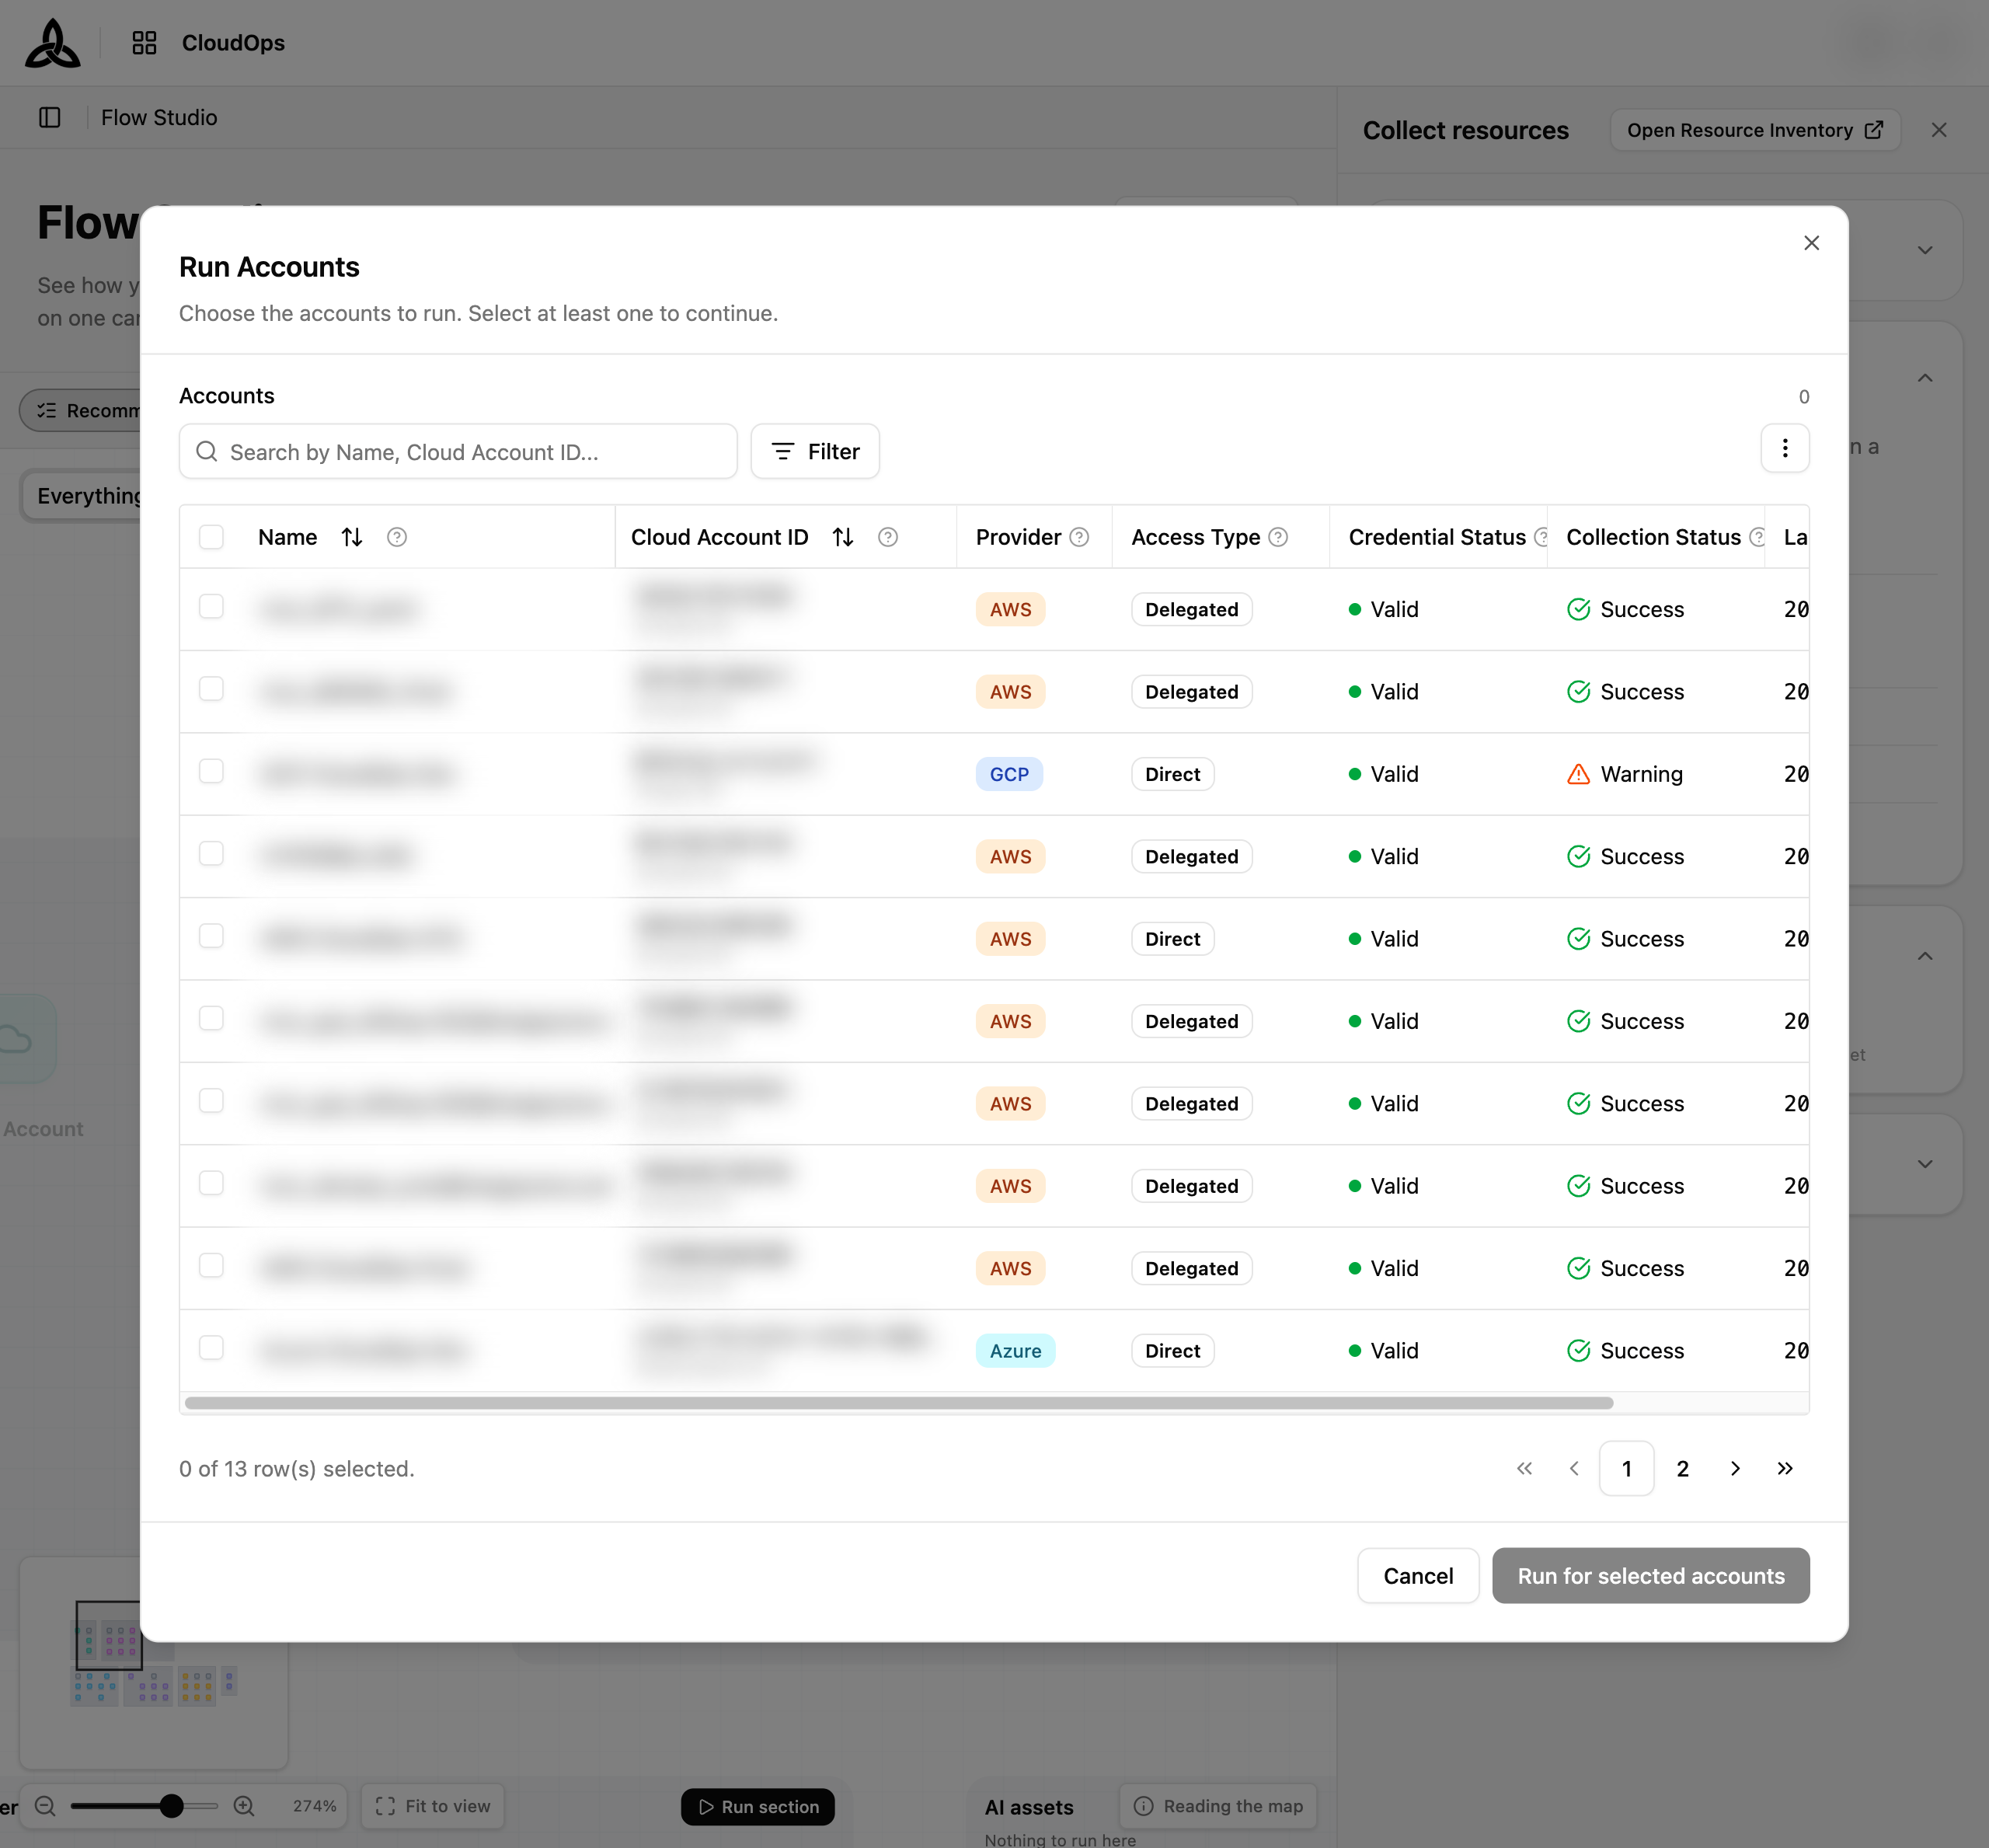
[Run selected] opens a dialog listing what the run can be narrowed to. It comes in two forms, depending on what is being run.
Most sections open Run Accounts — a table of accounts with their provider, access type, credential status, and collection status, and a count of what you have selected. Collection opens the fuller form below, which adds two more steps.
Accounts
Pick the accounts to run. Selecting the page’s rows offers Select all N matching so you can take the whole filtered set rather than a page of it.
Accounts that are already running cannot be selected — their rows are locked, and hovering one says whether it is a manual or a scheduled run holding it. They free up when that run finishes.
Collection scope
Narrow by Region and Resource, or leave both at All.
Specific resources
Search and pick individual resources.
Resources can only be picked once a collection has run — before that the step says so rather than showing an empty list.
There is a cap on how many accounts one run can take. Past it the dialog selects the first N and tells you the limit rather than silently truncating.
Running a single feature
The detail panel’s Running section runs the feature on its own. Features that follow it will not run — and where those are known, the panel names them.
Long-running features estimate the wait (About 12 min) and, past a threshold, suggest you start it and leave the page.
If the flow definition changed while you had the page open, the run is not started against the stale version — the page reloads the current definition and asks you to run it again.
Run History
Select [Run history] in the header to open the run-history screen. Use the back arrow next to the title to return to the map.
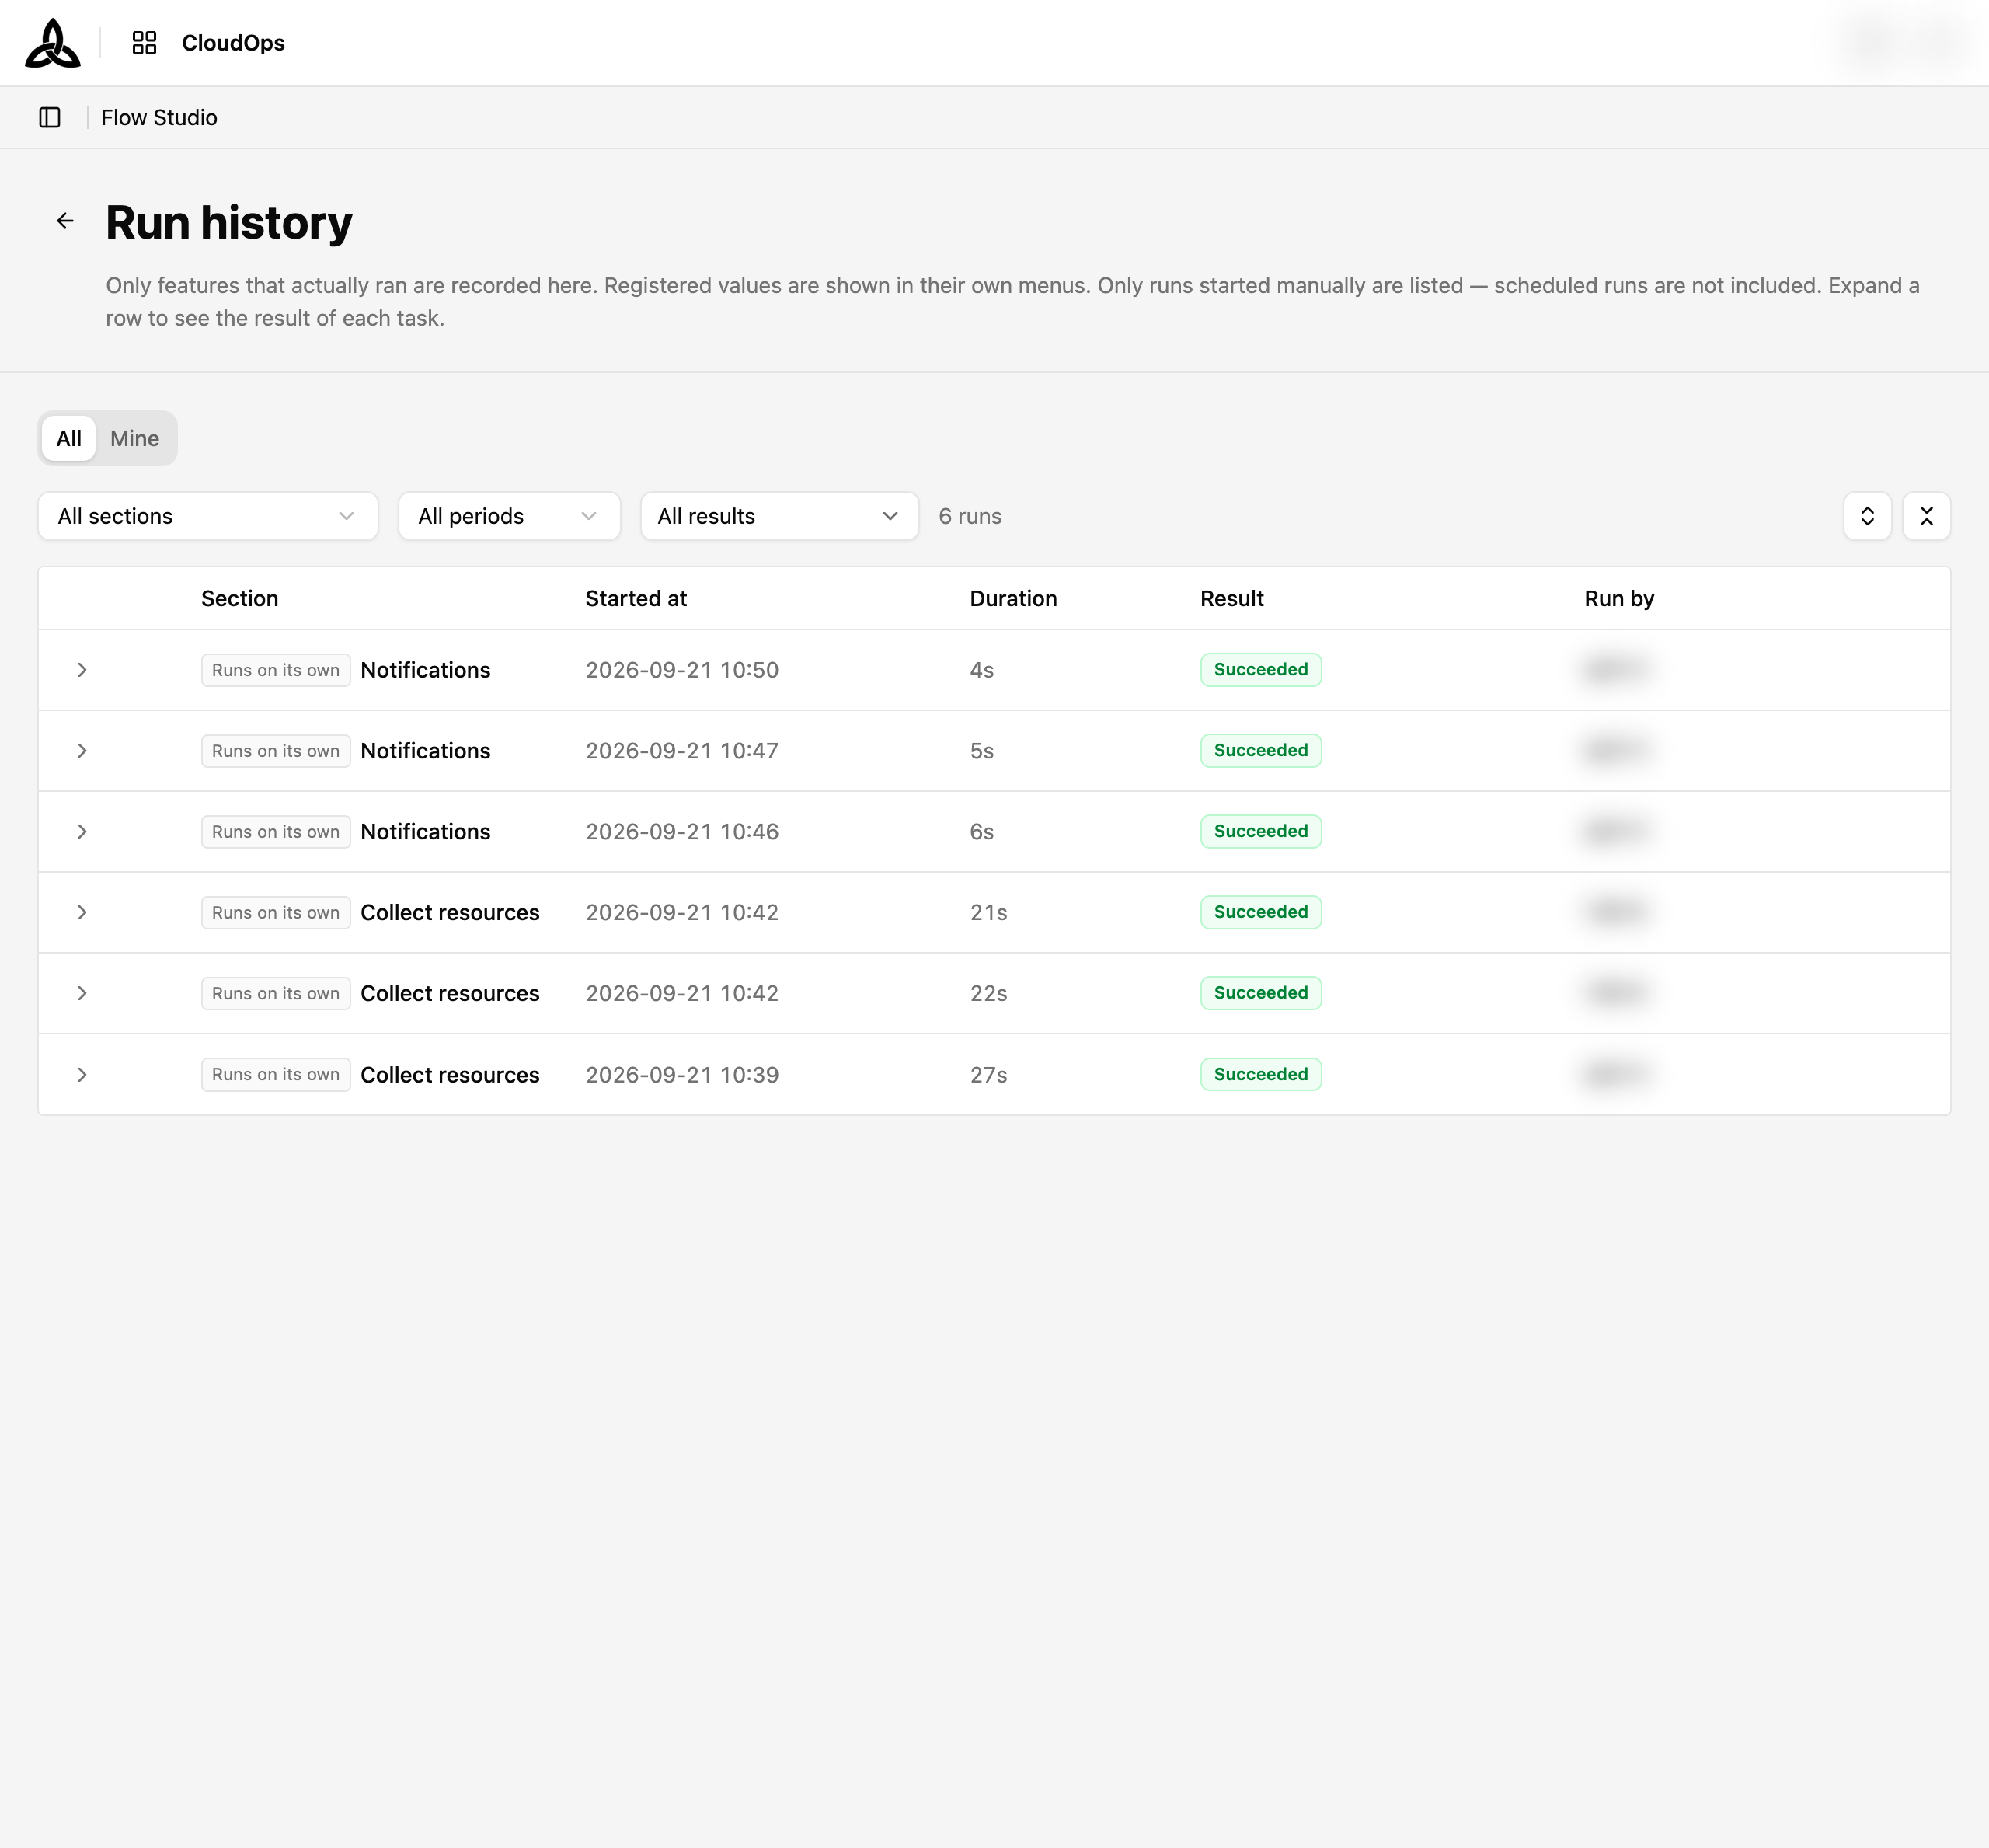
| Column | Description |
|---|---|
| Section | The section the run belongs to, and the features it walked |
| Started at | When the run started |
| Duration | How long it took |
| Result | See the table below |
| Run by | Who started it |
Use the buttons on the right to expand or collapse every row at once.
Results
| Result | Meaning |
|---|---|
Pending | Accepted, not started yet |
Running | Still going |
Succeeded | Everything finished cleanly |
Needs a look | Finished, but something in it warrants checking |
Partially failed | Some targets finished, others did not |
Failed | The run stopped |
Canceled | Someone stopped it |
Timed out | It ran past its limit |
Partially failed and Needs a look are outcomes in their own right, not rounded to pass or fail. A run across 50 accounts where 3 failed is neither a success nor a failure, and the list says which it was rather than picking one.Narrowing the list
Two rows of controls sit above the list, and they work on different axes.
Tabs — All and Mine — split by who ran it. Filters — Filter by section, Period (last 24 hours / 7 days / 30 days), and Result — narrow which runs. [Clear filters] resets the filter row.
Task results
Expanding a row shows the result of each task in that run, plus a re-run button.
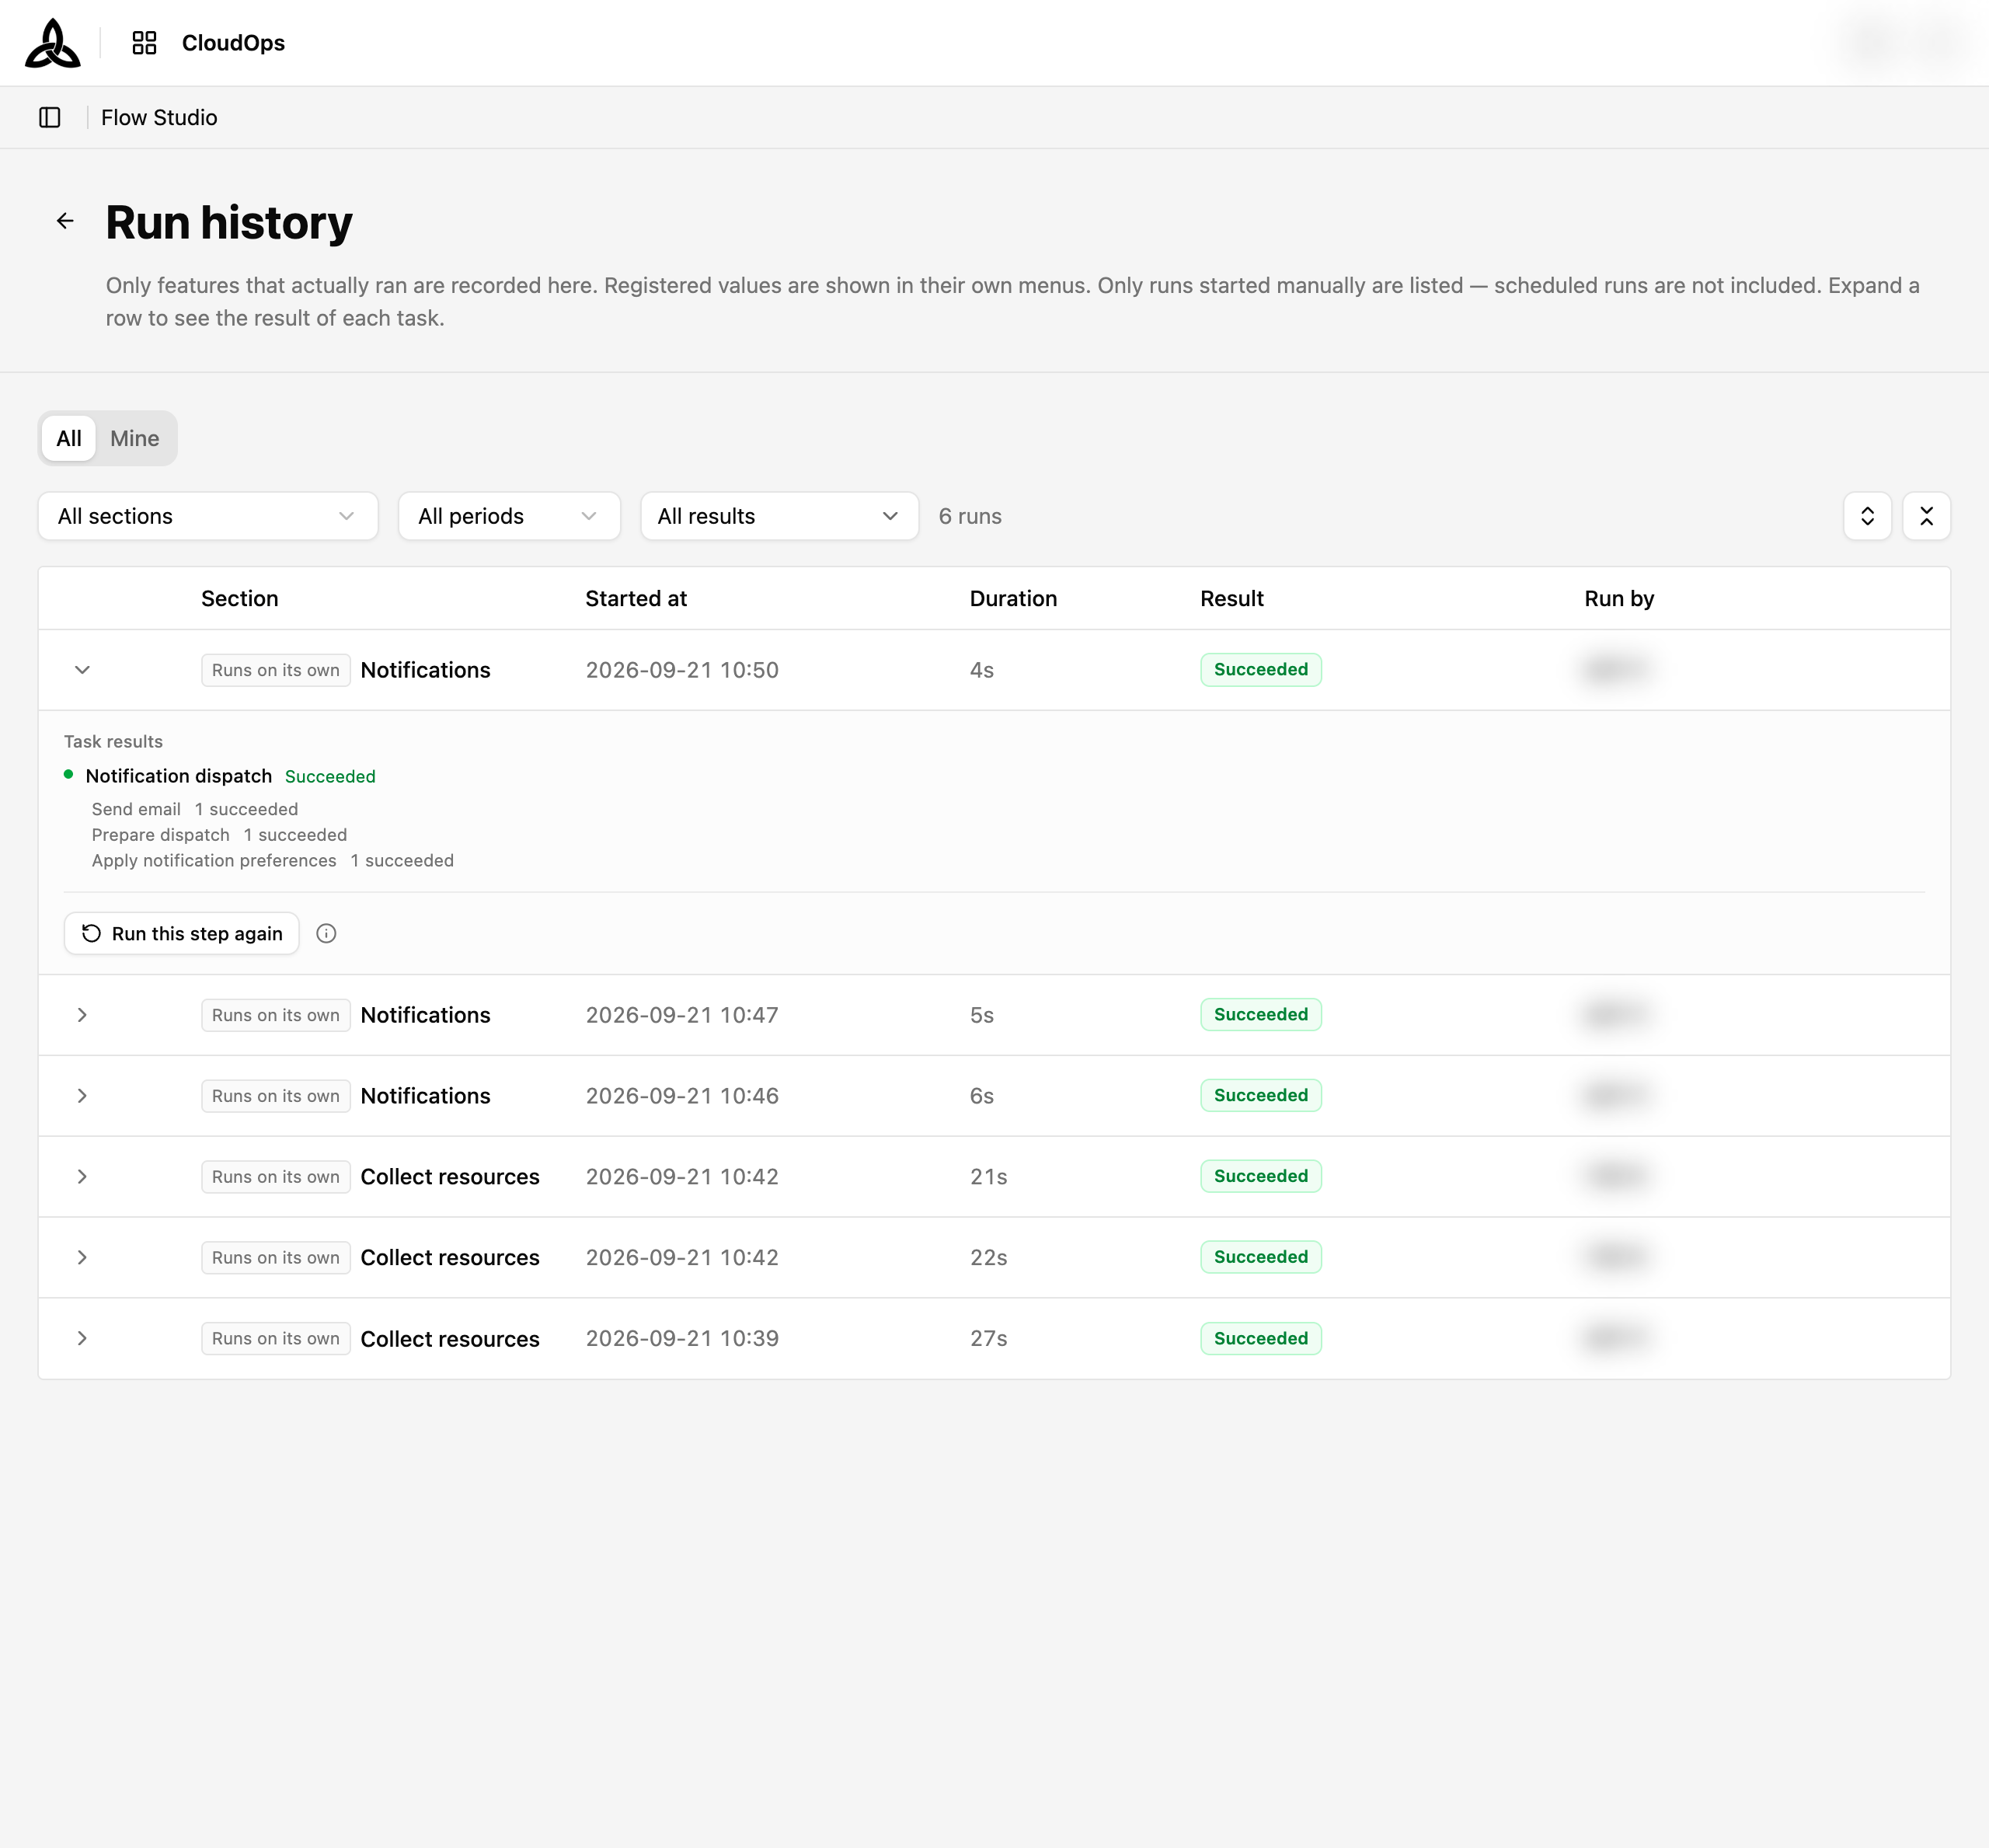
Each task reports Succeeded, Failed, Needs a look, Running, or Waiting, with counts where it worked through targets — 8 of 50 targets failed. [Show technical details] reveals the raw error for a failure whose cause could not be named.
The button matches what there is to re-run: [Re-run this part] for a section, [Re-run N accounts] where the run covered accounts, and [Run this step again] for a standalone feature run. While that section is still running, the button is disabled until it finishes.
Related
Connecting a cloud account and collecting its resources are the first features of this flow. To register or repair an account, see Cloud Account.