Well-Architected
On the [Events & Alerts > Well-Architected] page, you can see how well your cloud environment scores against the five Well-Architected pillars, and which applications are dragging that score down.
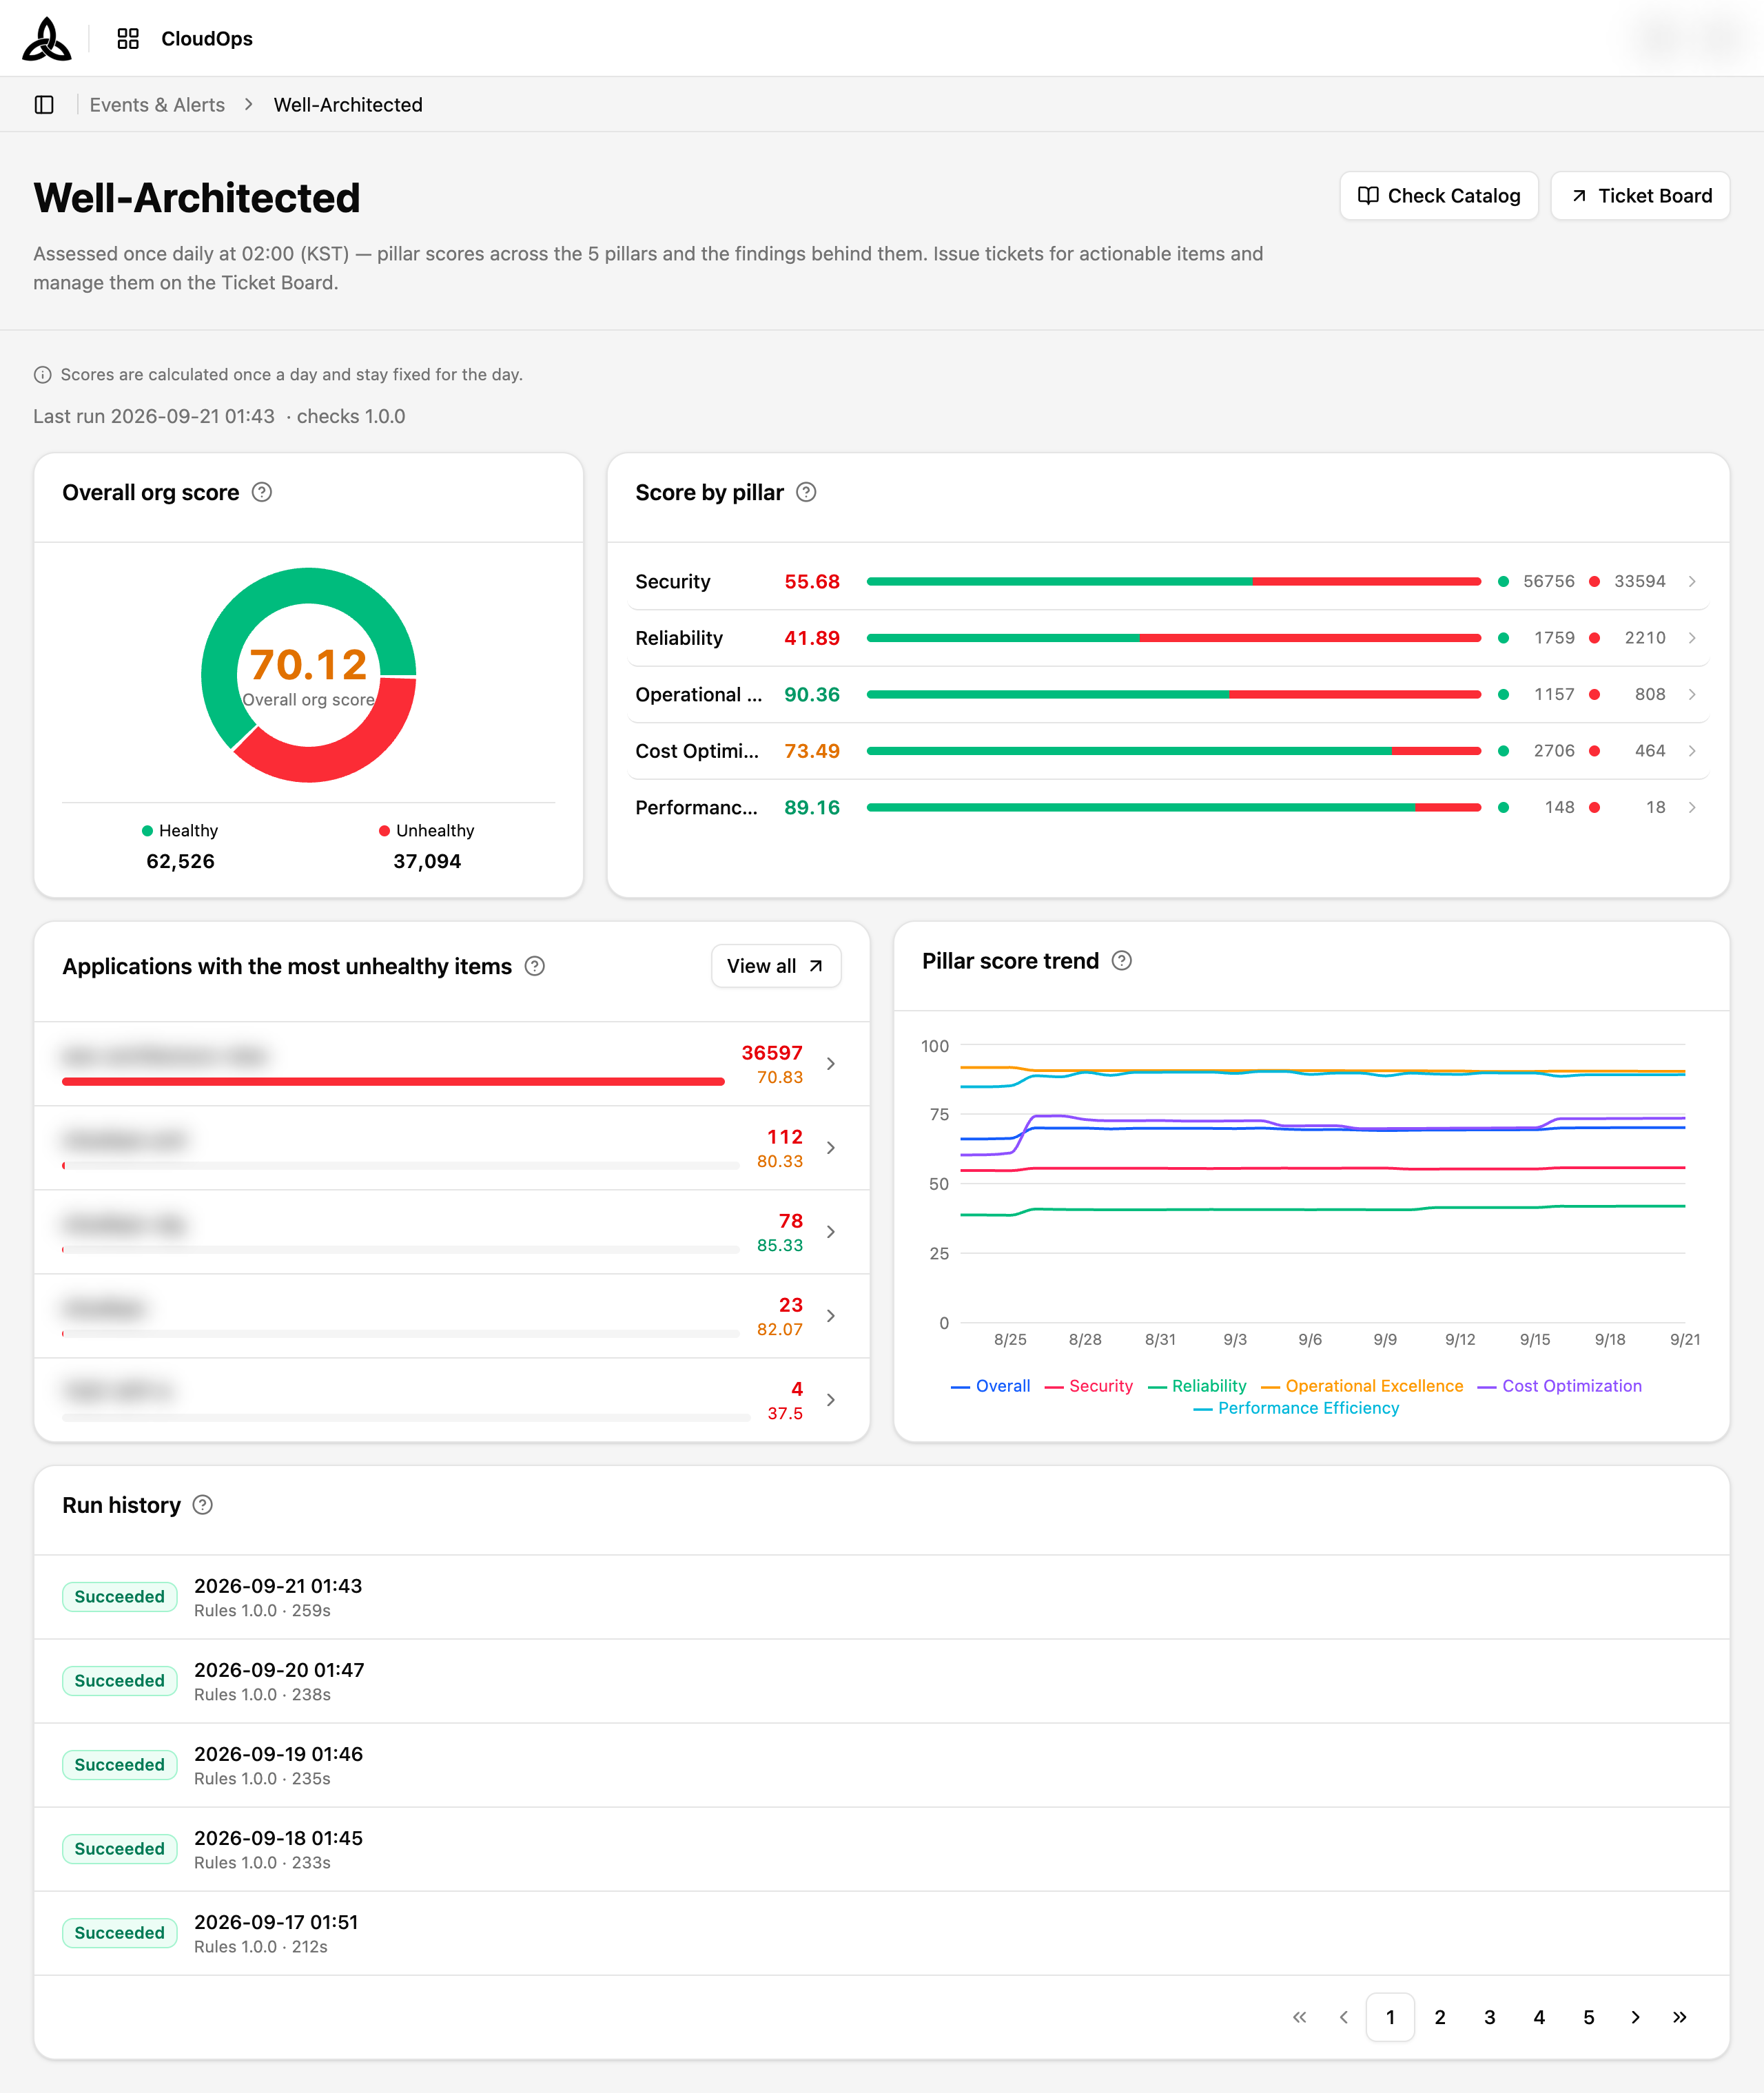
Page Layout
| Section | Purpose |
|---|---|
| Overall org score | A single score for the whole organization |
| Score by pillar | The five pillar scores, with the healthy / unhealthy split behind each |
| Applications with the most unhealthy items | Which applications hold the most findings |
| Pillar score trend | How the scores have moved over the last 30 days |
| Run history | Every assessment run and whether it succeeded |
The [Ticket Board] button at the top-right opens the Ticket Board filtered to Well-Architected tickets.
Overall org score
The donut shows the share of checked items in the organization that passed. Items that could not be judged are excluded from the calculation, and the numbers under the donut are the raw Healthy and Unhealthy counts.
Score by pillar
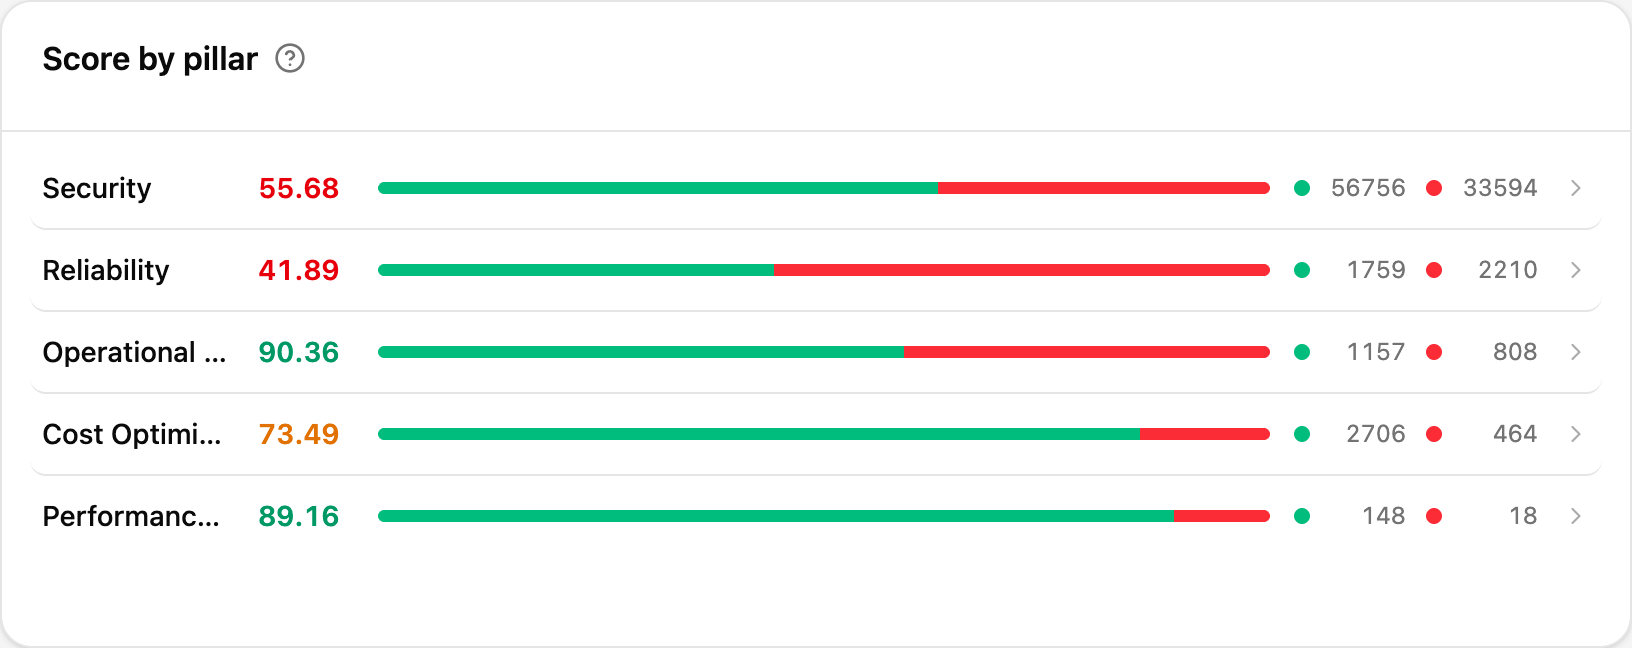
Each row is one of the five pillars — Security, Reliability, Operational Excellence, Cost Optimization, and Performance Efficiency.
| Element | Description |
|---|---|
| Score | The pillar score, coloured by how healthy it is |
| Bar | The healthy (green) versus unhealthy (red) split for that pillar |
| Counts | Healthy count and unhealthy count |
| Row click | Opens that pillar’s findings in a side sheet |
Findings sheet
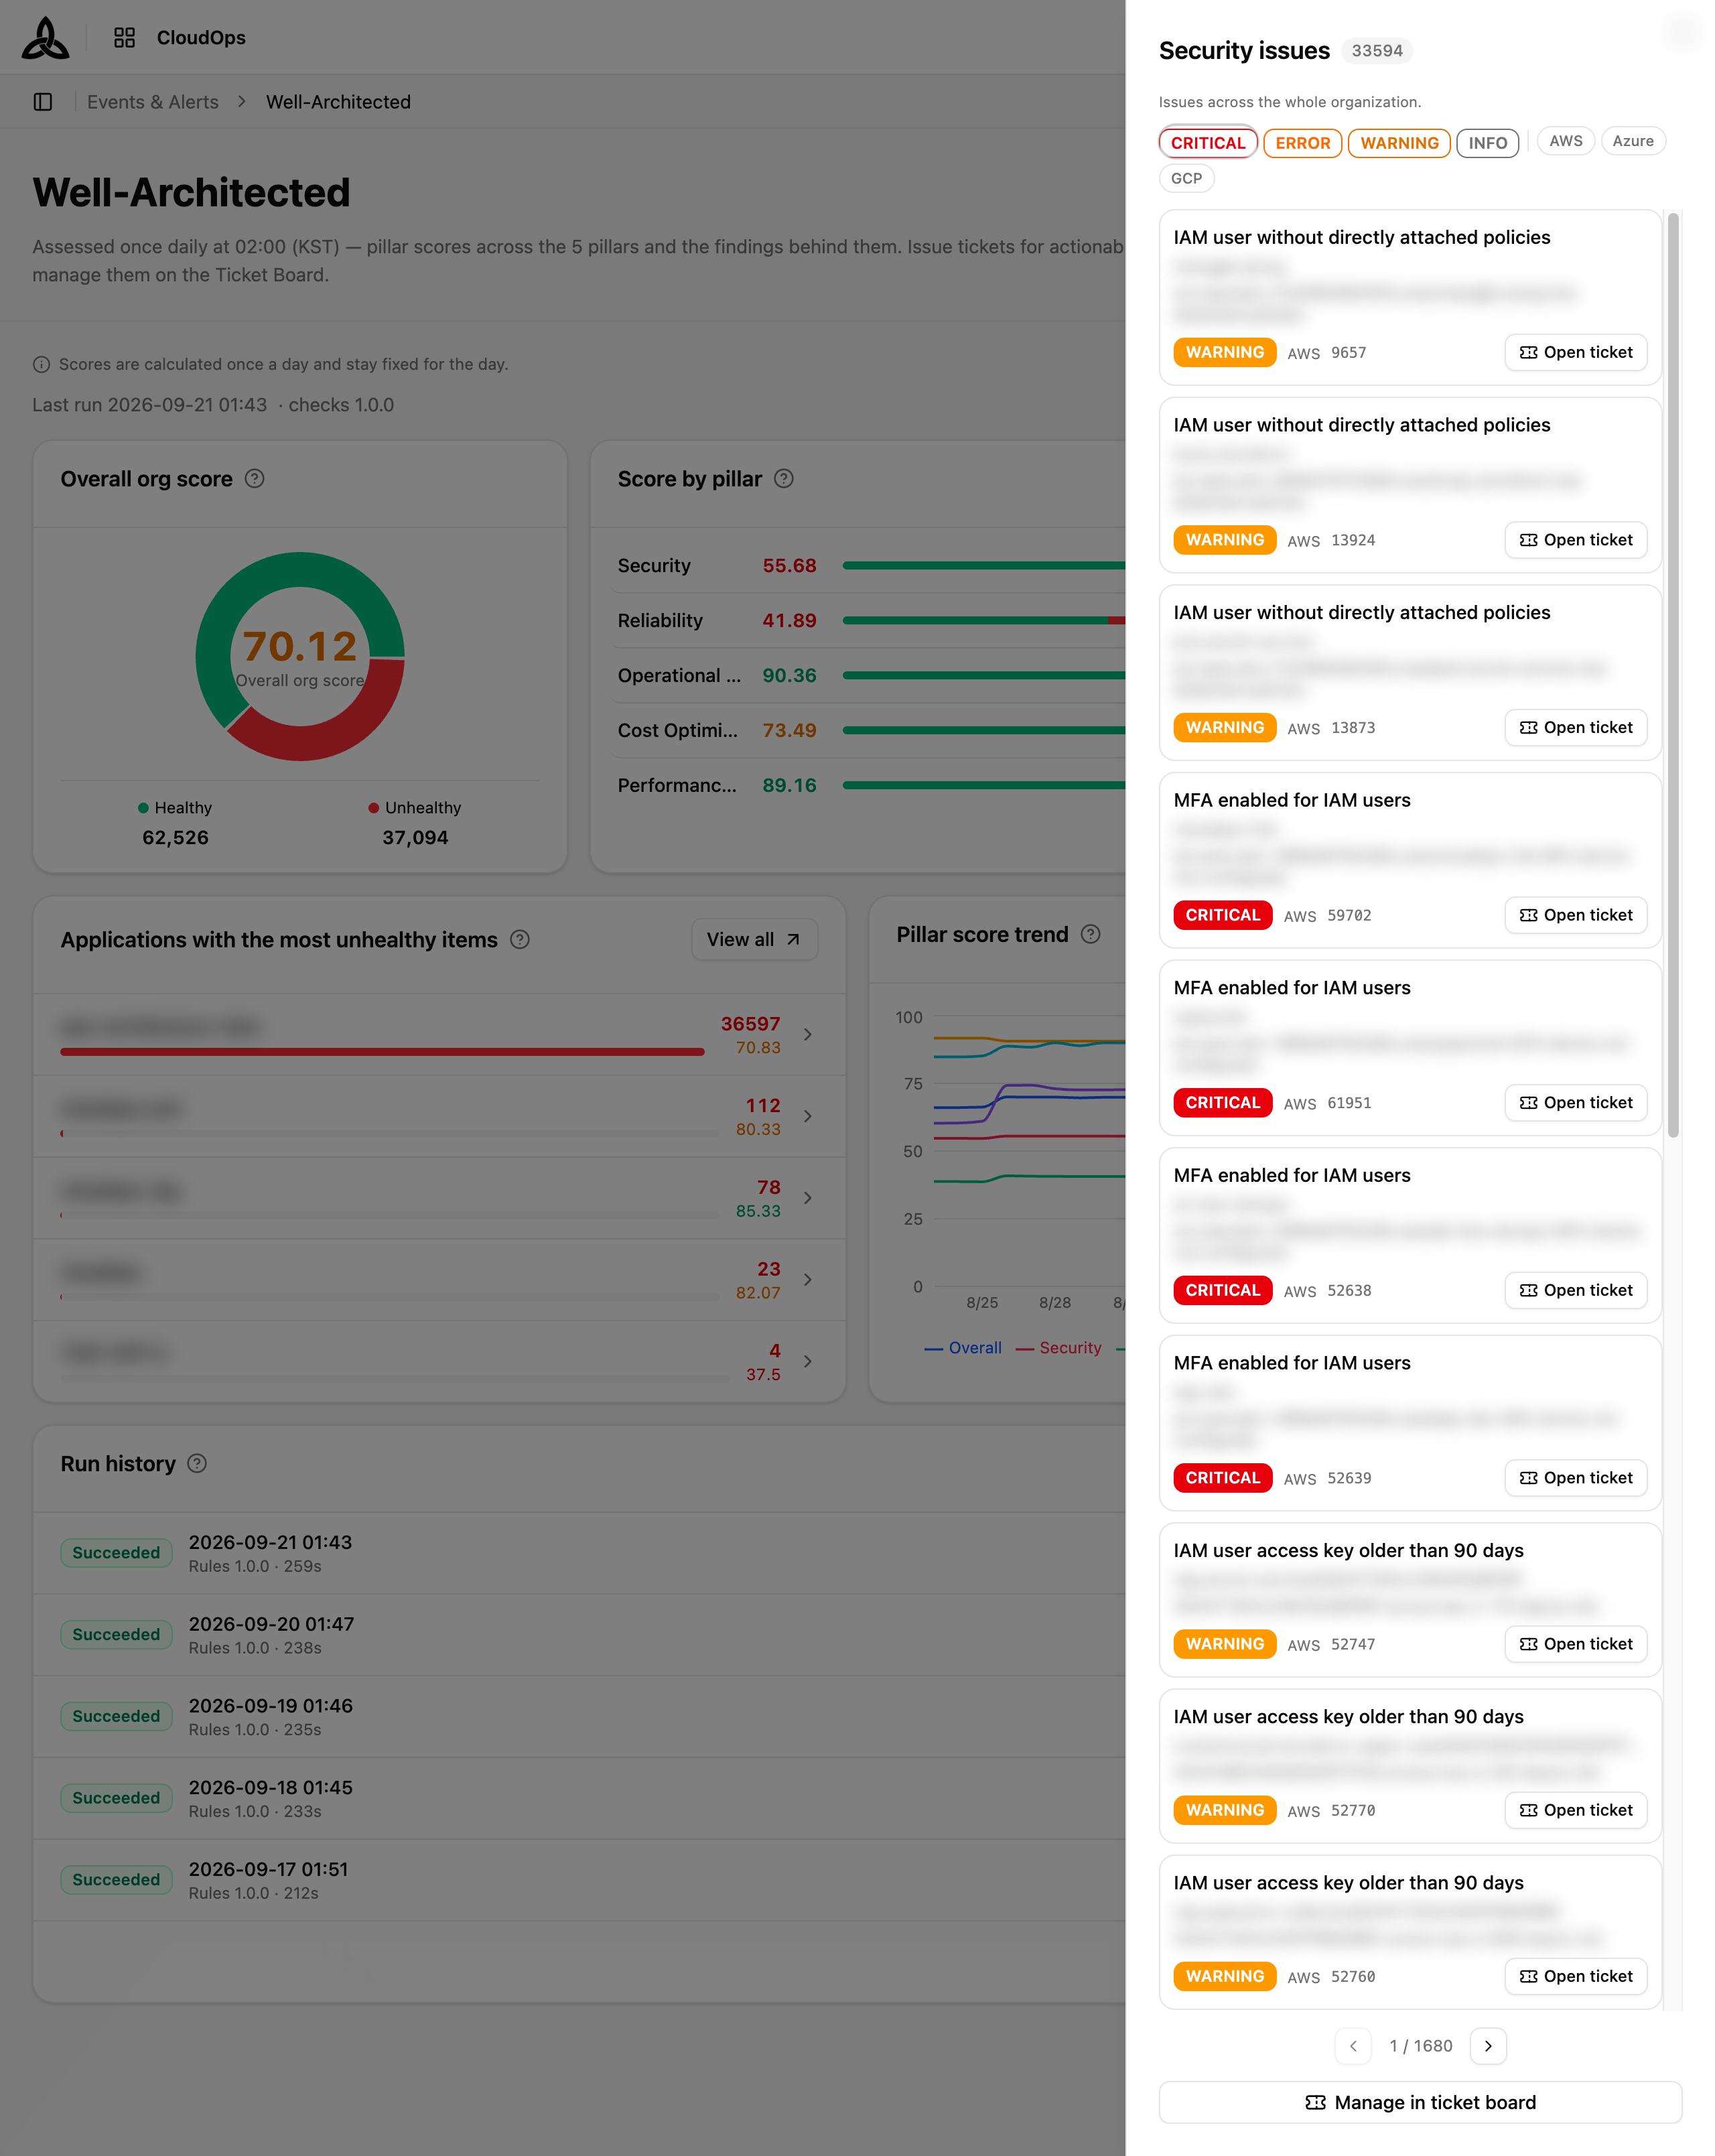
Clicking a pillar row opens its findings without leaving the page. The sheet is scoped to the whole organization and carries its own controls:
| Control | Purpose |
|---|---|
| Severity chips | CRITICAL · ERROR · WARNING · INFO — narrow to the severities you care about |
| Provider chips | Narrow to one cloud provider |
| Paging | The findings run to thousands, so they arrive a page at a time |
| Open ticket | Turns a single finding into a ticket |
| Manage in ticket board | Hands the whole filtered set over to the Ticket Board |
Each finding names the check that produced it, the resource it applies to, and why it was flagged.
Applications with the most unhealthy items
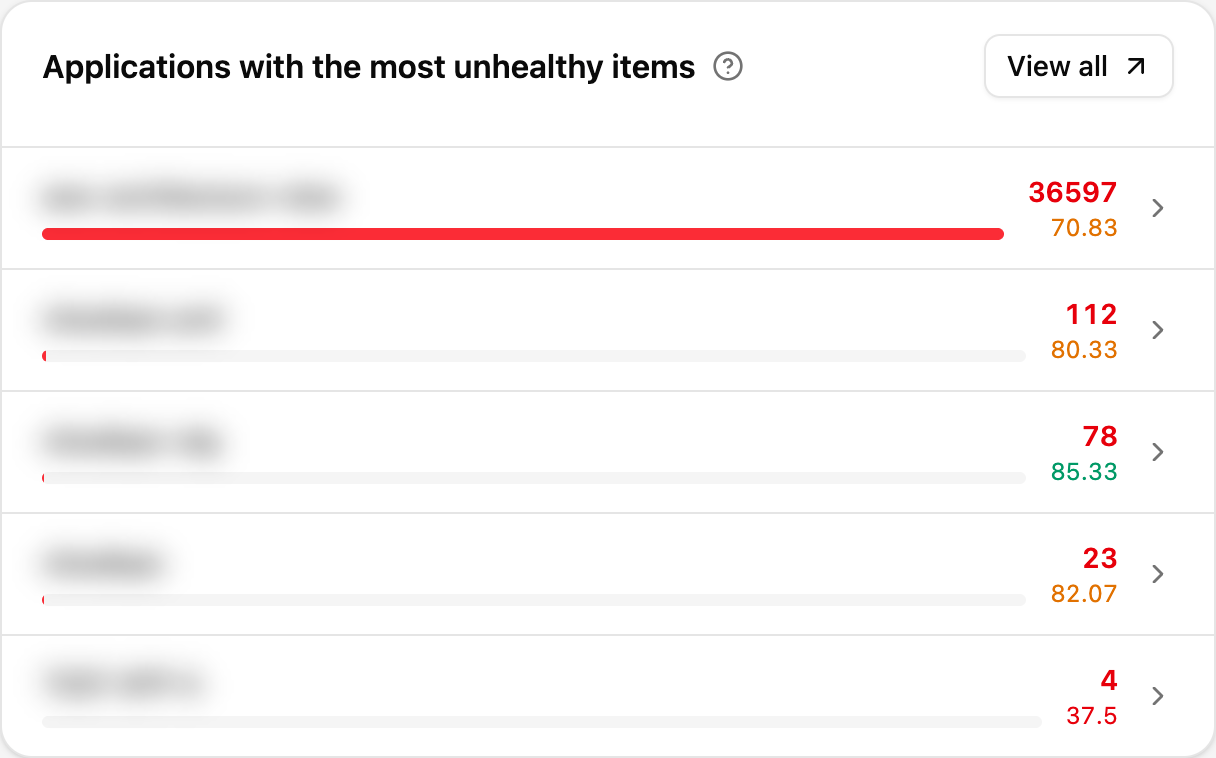
Applications ranked by how many findings they carry. The bar is drawn relative to the top application, and the two numbers on the right are the finding count and that application’s own score.
Click an application name to open its detail page, or [View all ↗] to see the full list.
Pillar score trend
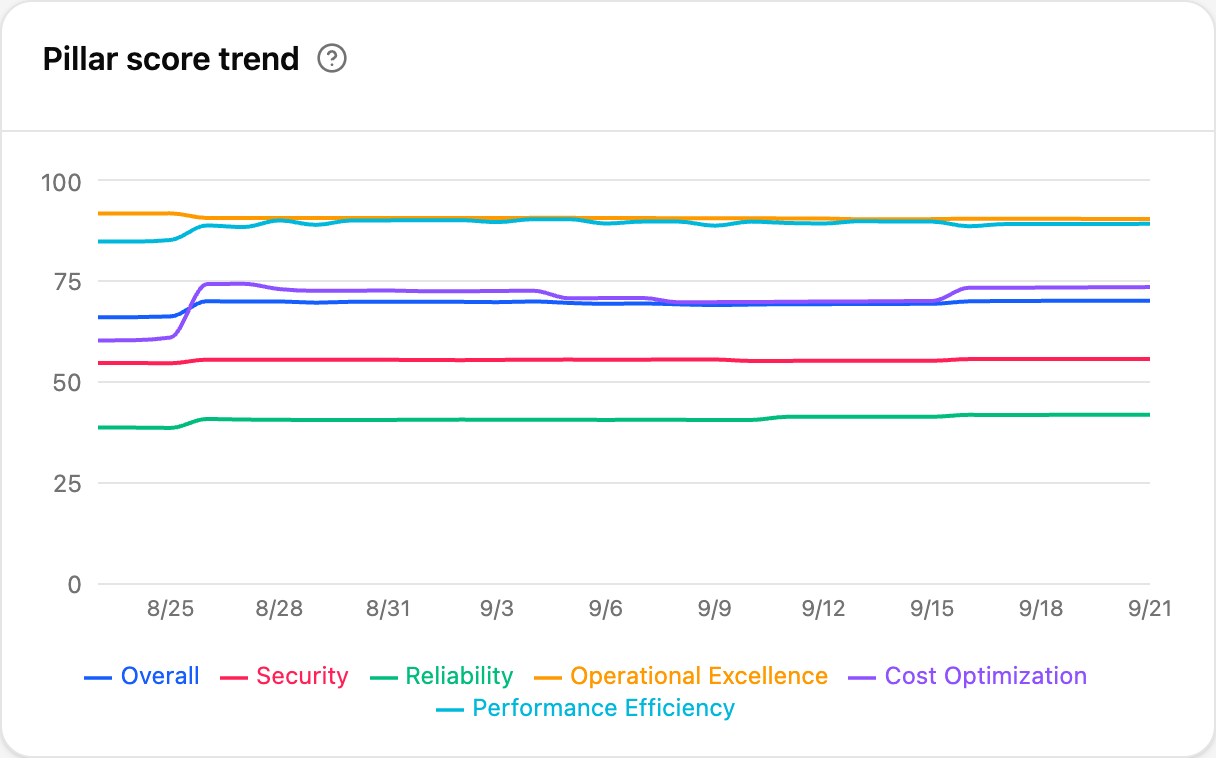
A 30-day time series with one line per pillar plus Overall, built from succeeded runs only. Use it to confirm that a fix actually moved the score rather than just closing one finding.
Run history
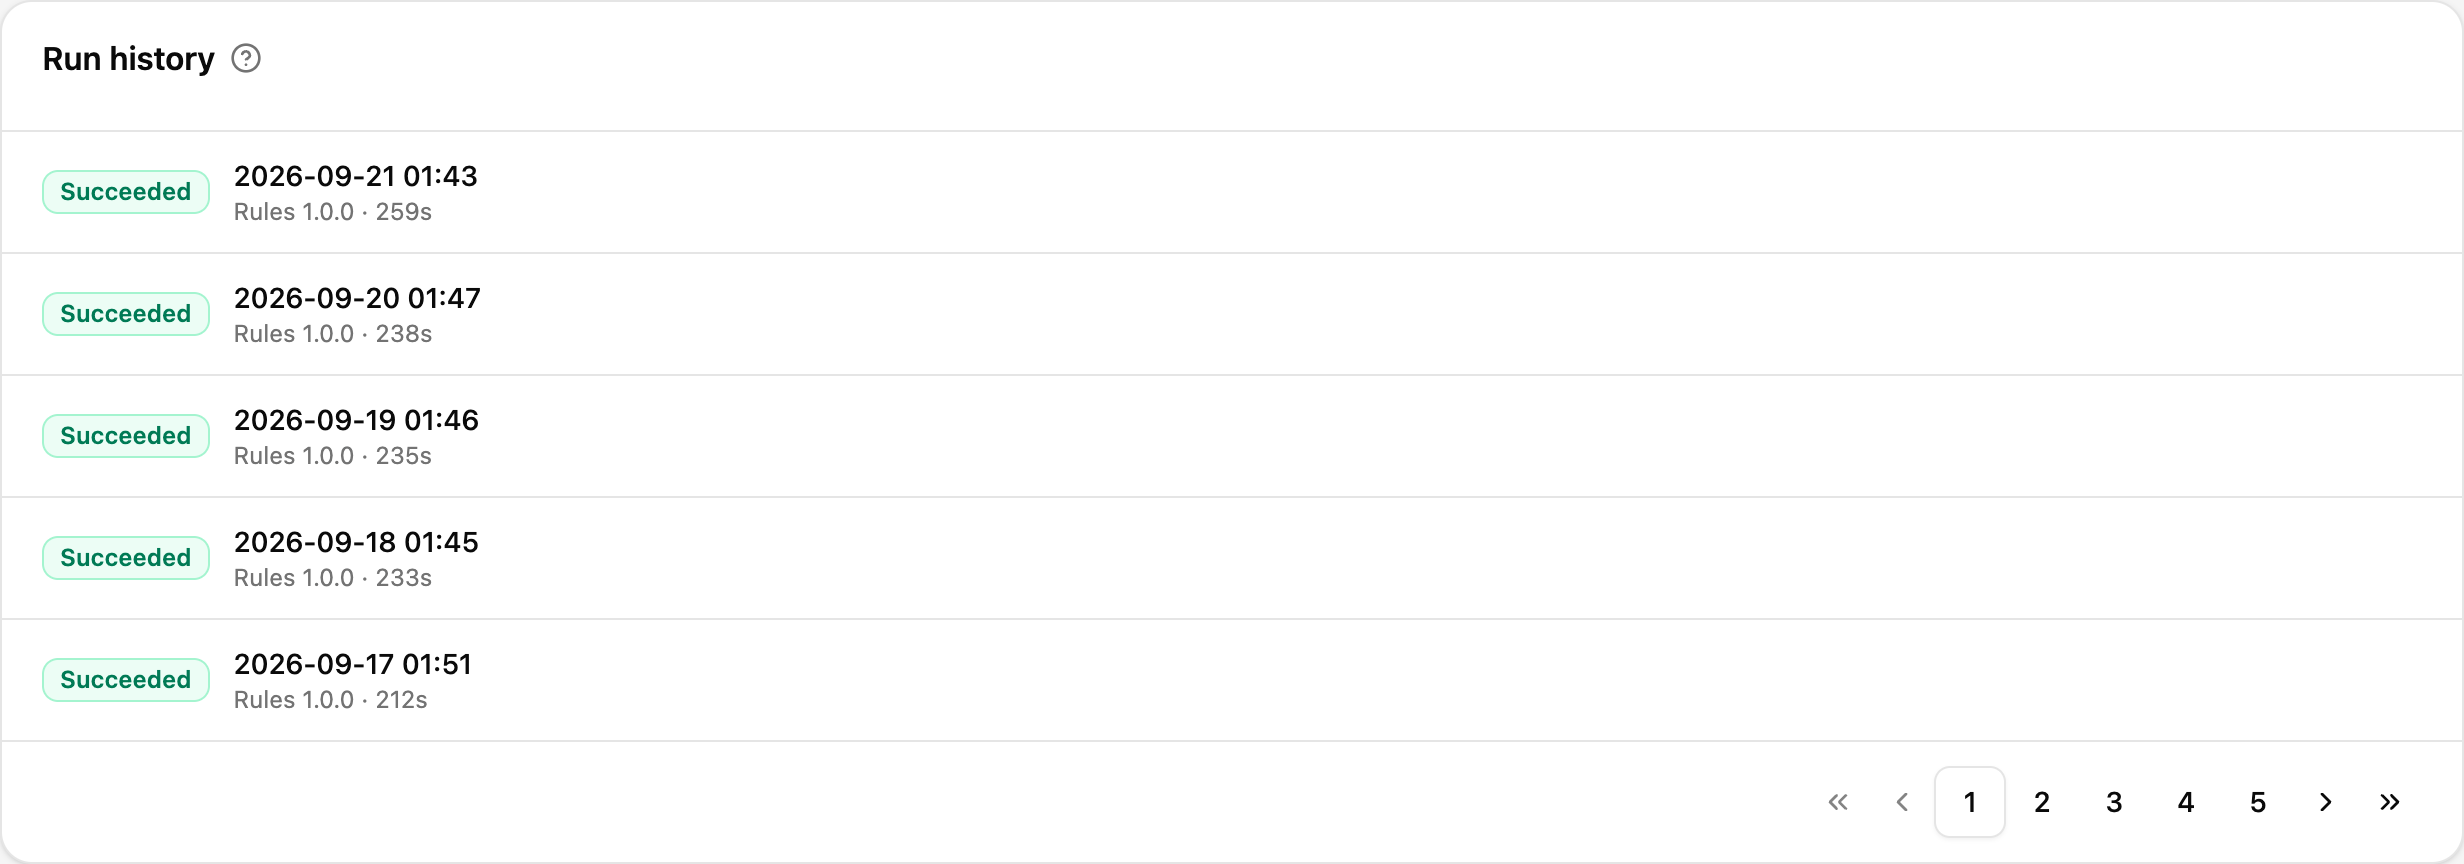
Every assessment run, newest first.
| Element | Description |
|---|---|
| Status | Succeeded / Failed / Running / Pending |
| Run at | When the run started |
| Rules / duration | The check-rule version used and how long the run took |
No completed assessment yet — assessments run automatically every night and results appear once the first run finishes.Acting on findings
Well-Architected reports what is unhealthy; the work of tracking and fixing it happens on the Ticket Board. Open a pillar’s findings sheet and either raise a ticket per finding with Open ticket, or hand the filtered set over with Manage in ticket board. The [Ticket Board] button in the page header goes there directly.
Check Catalog
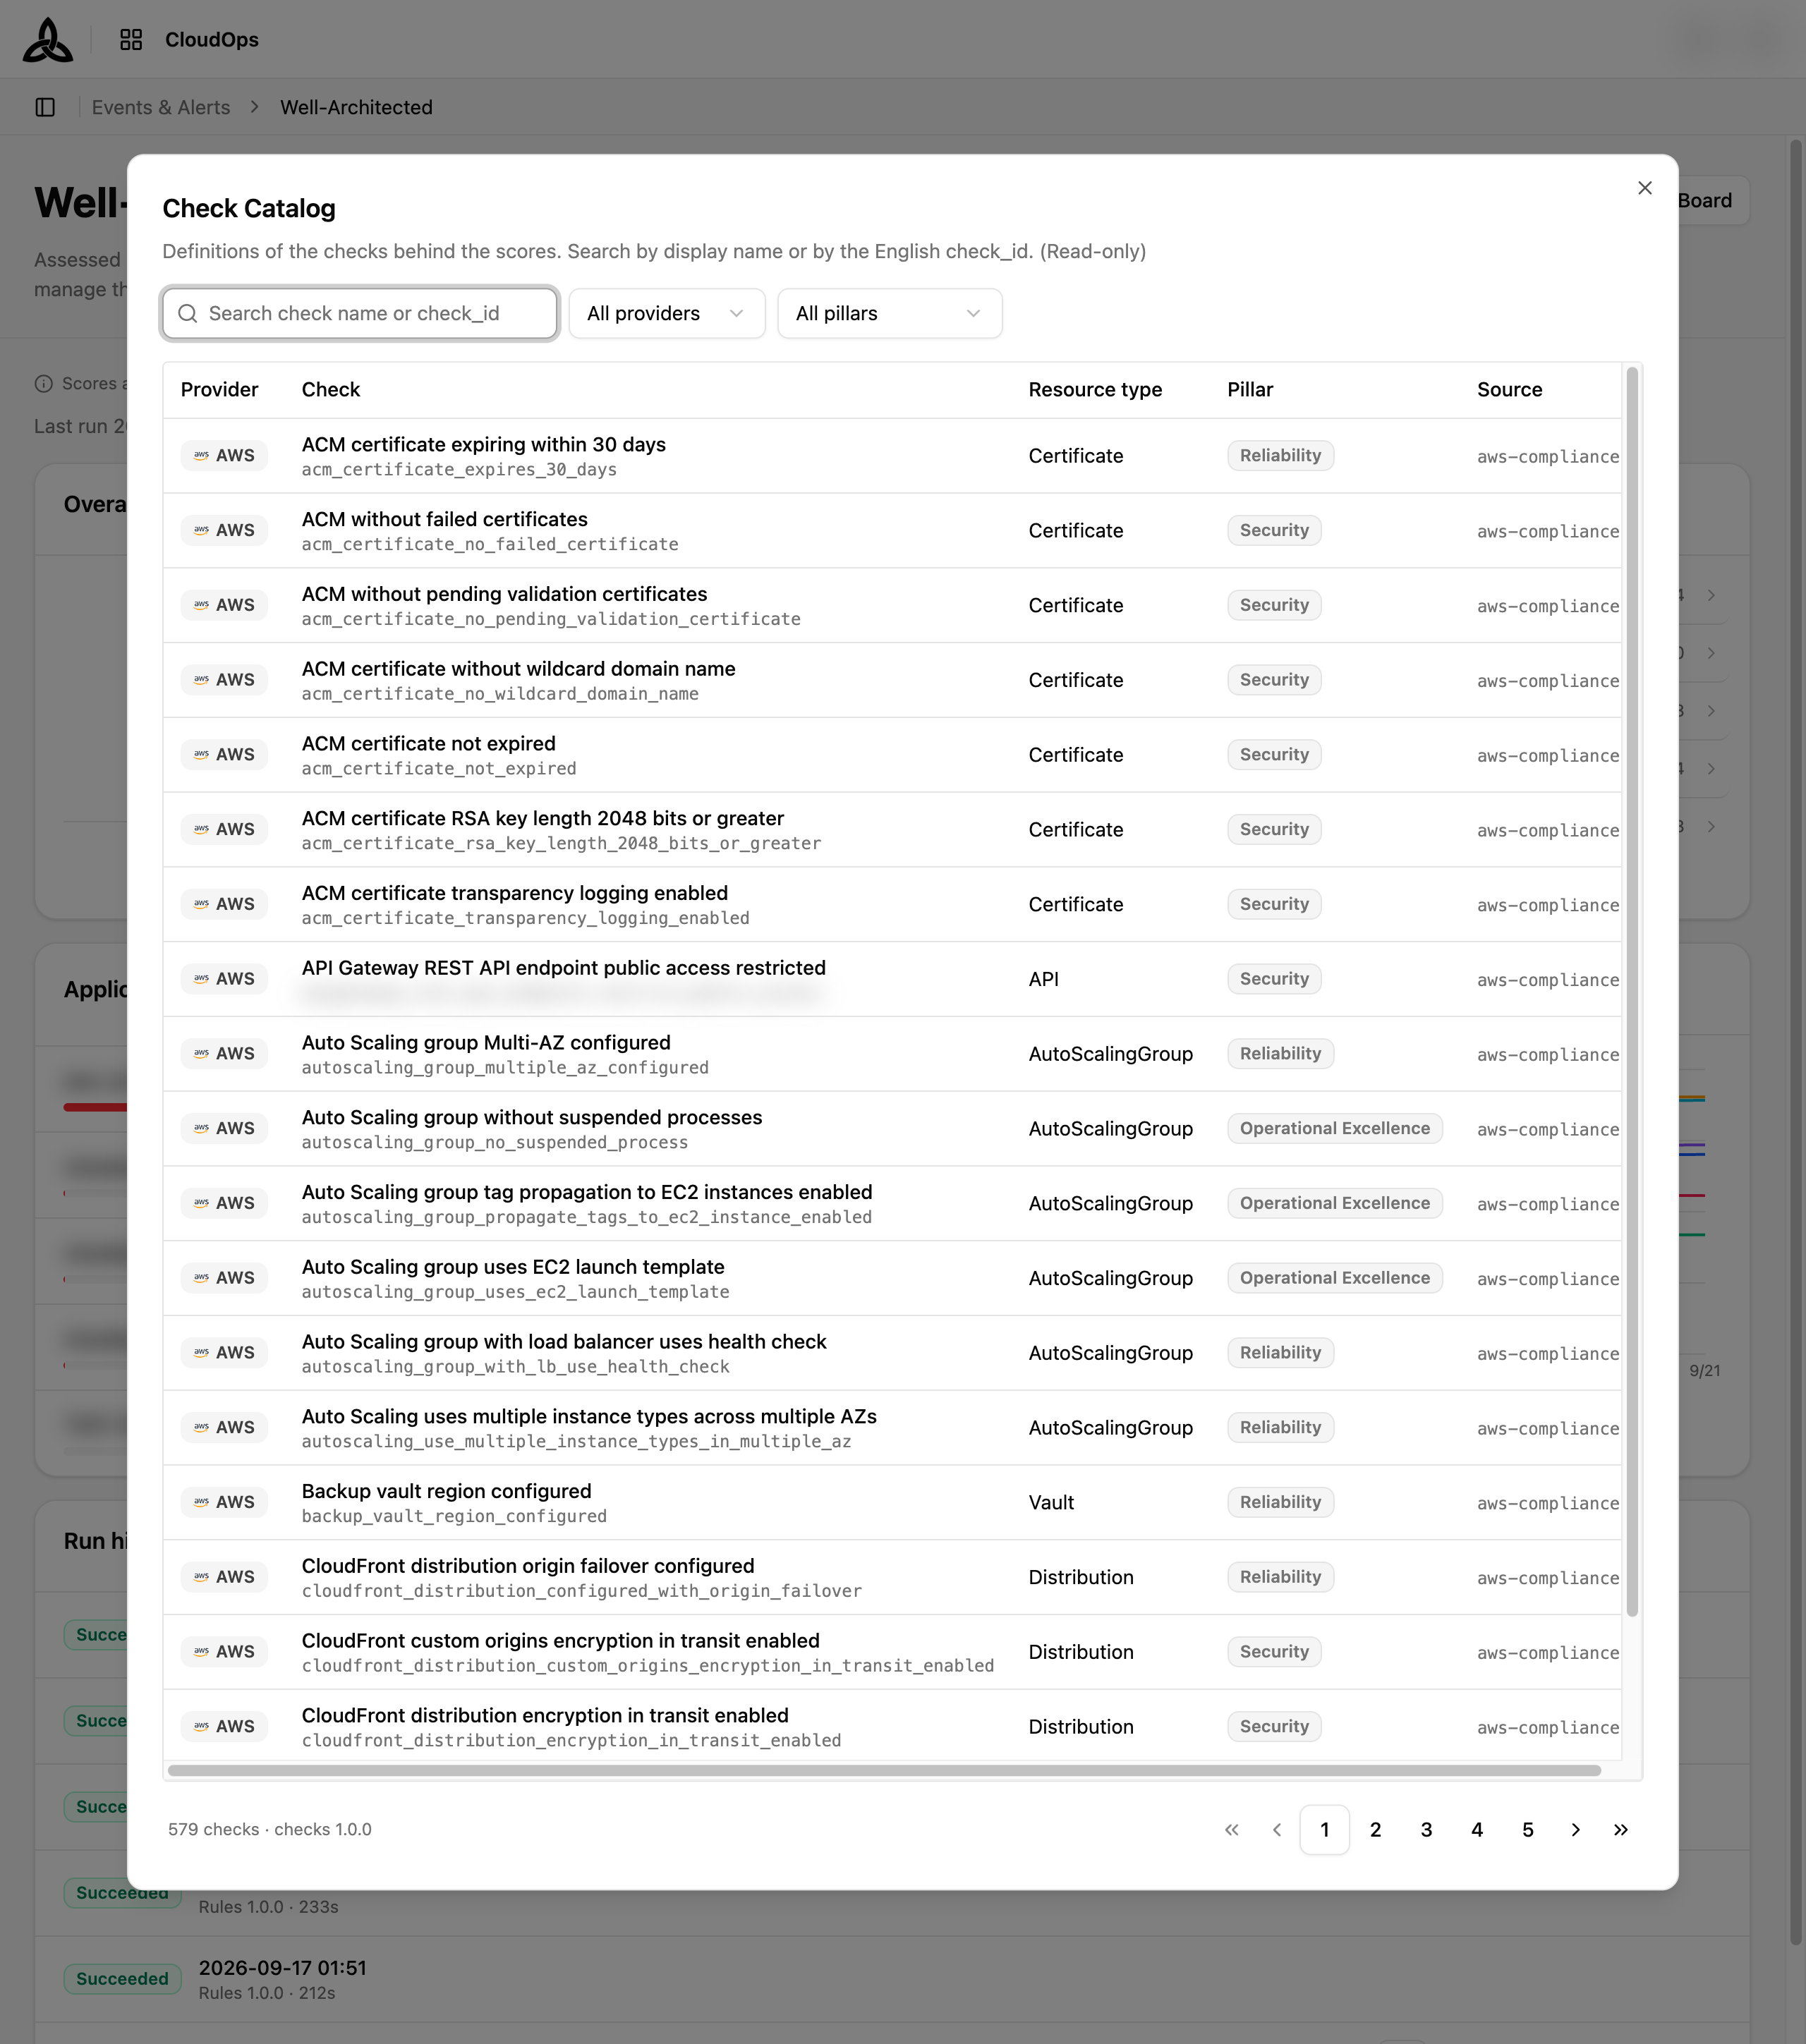
Check Catalog in the page header lists every check behind the scores, with the pillar it belongs to and where it comes from.
| Column | Description |
|---|---|
| Provider | Cloud provider the check applies to |
| Check | Its display name, with the underlying check_id beneath |
| Resource type | The kind of resource evaluated |
| Pillar | Which of the five pillars the check scores |
| Source | The rule set the check comes from |
Search matches either the display name or the English check_id, and the two dropdowns narrow by provider and pillar. The footer reports the total check count and the rule-set version, which is the same version shown in Run history.