Alert Management
On the [Events & Alerts > Alerts] page, you can triage alerts that the platform consolidates from incoming events — review them in a board, dive into individual alerts, and drive the triage workflow.
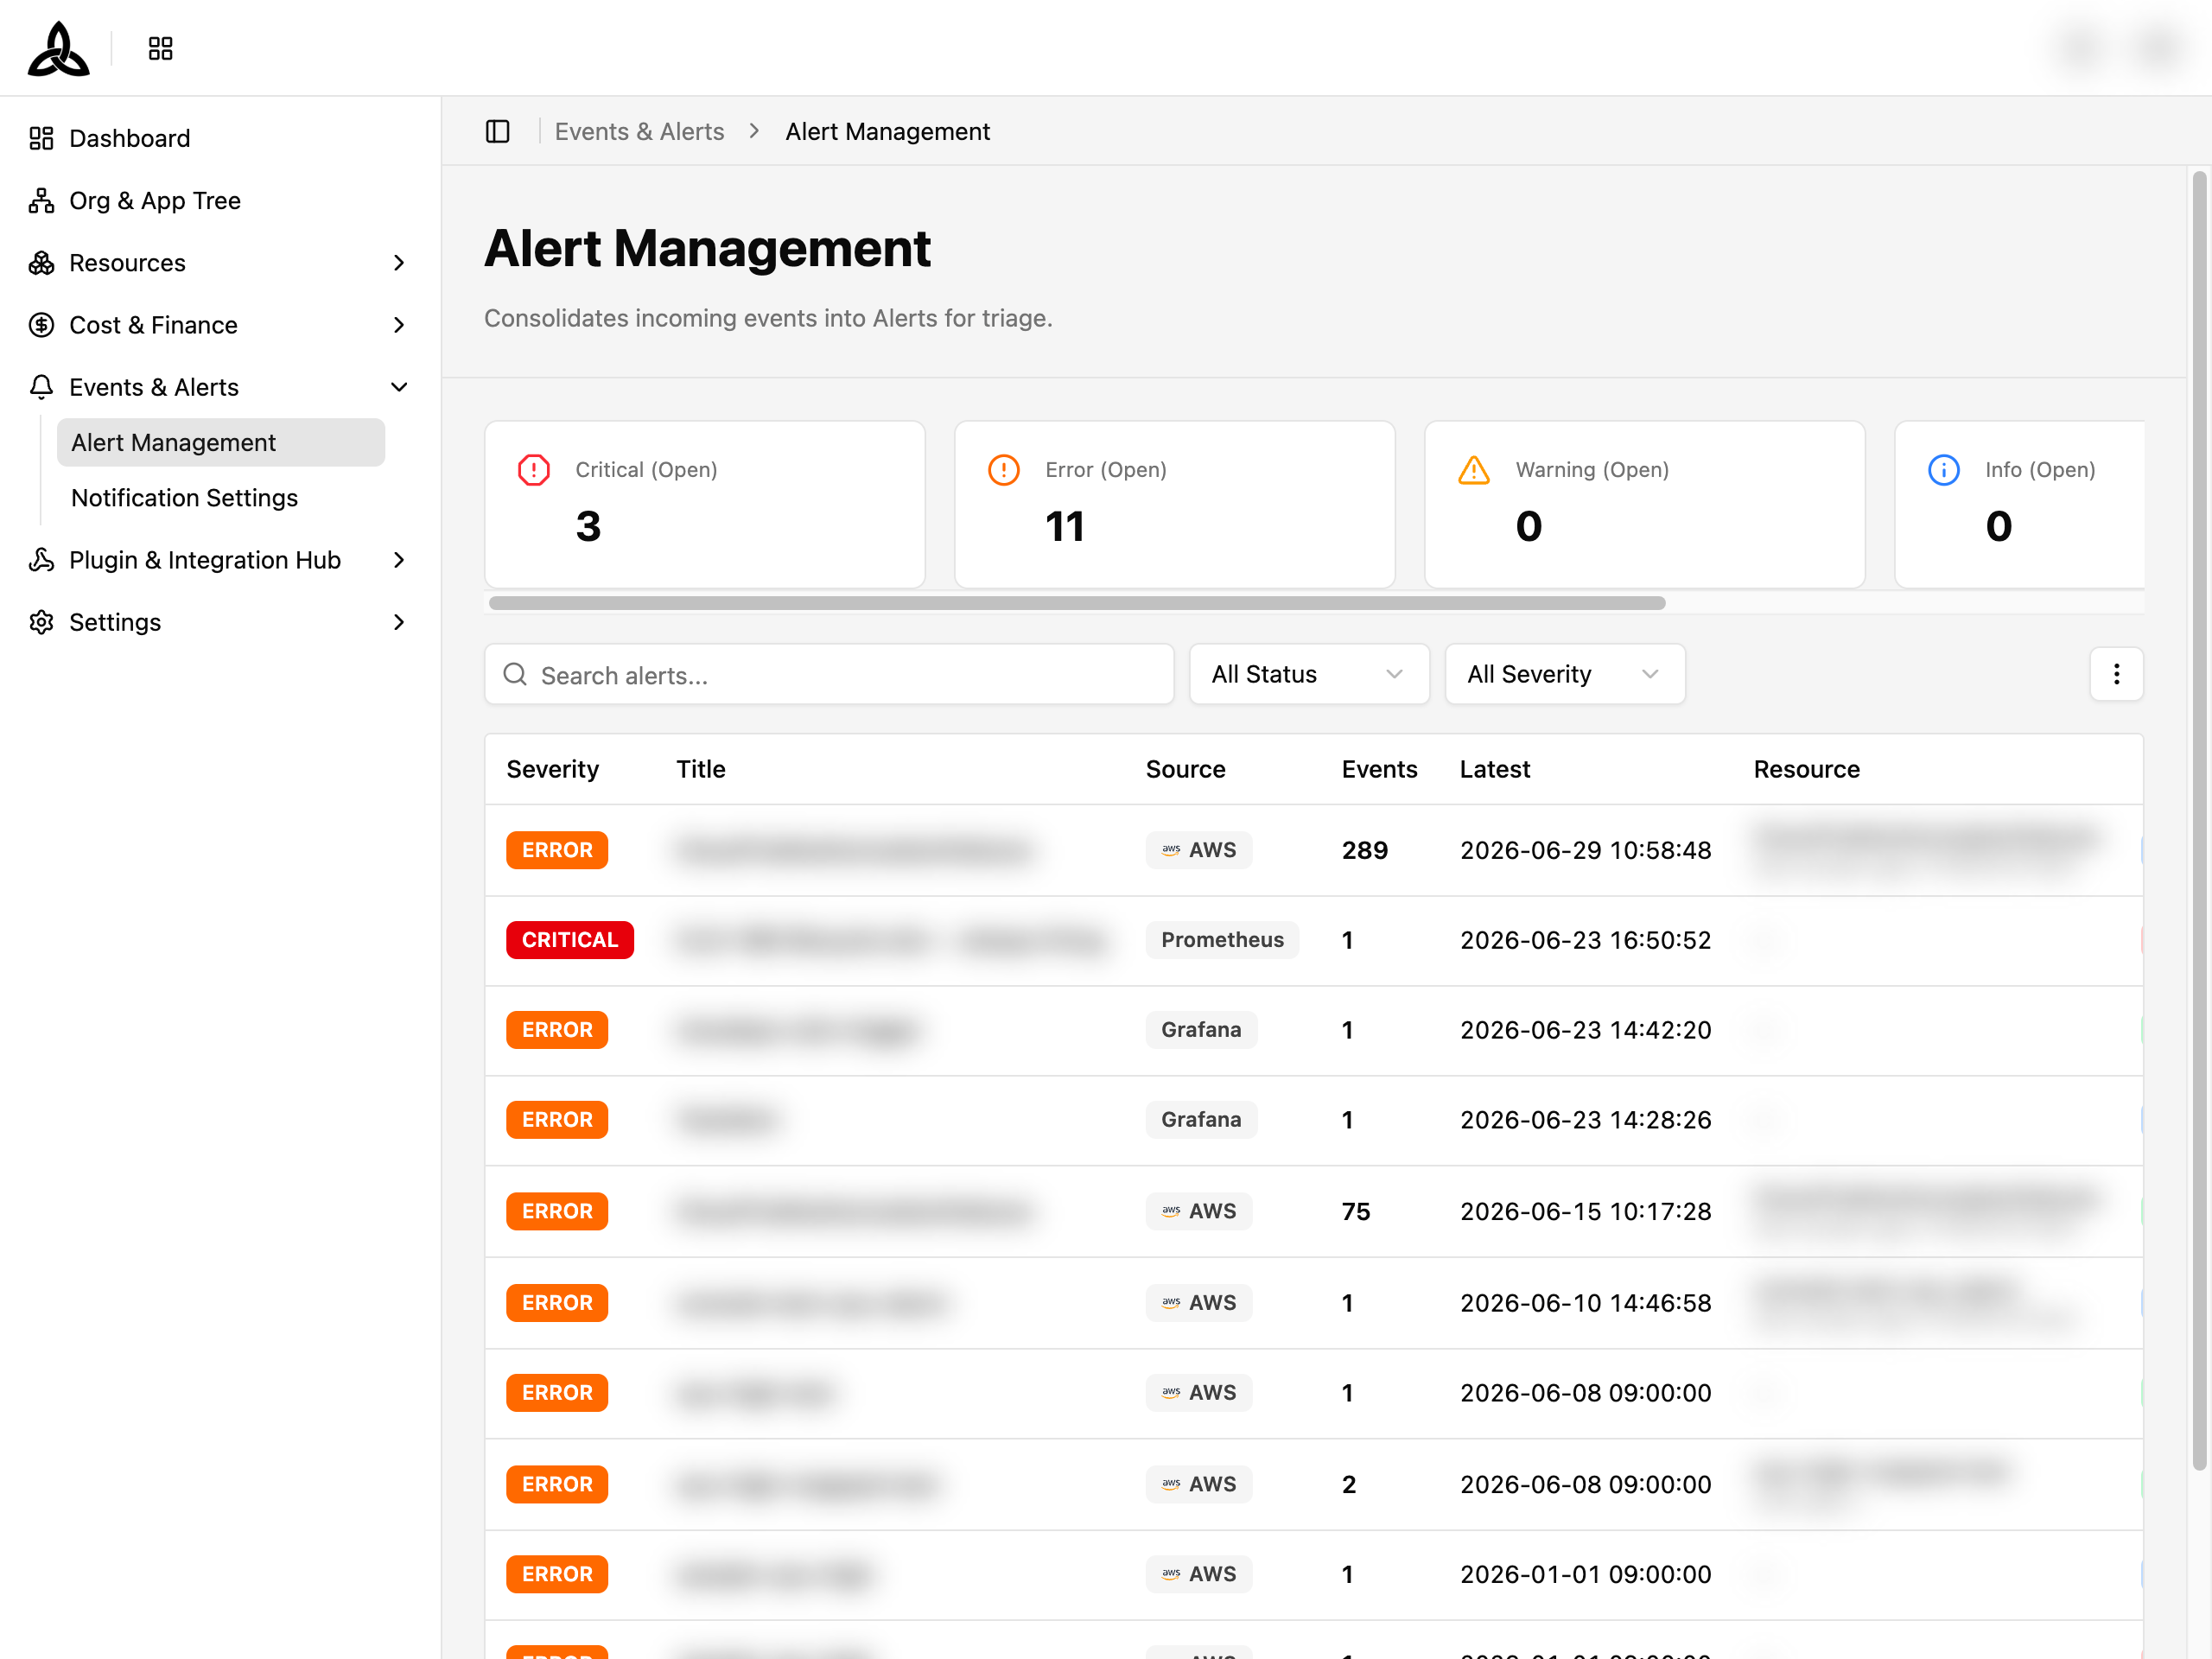
Alert Board
The board is split into four stacked sections.
Stats Strip

A summary strip across the top counts open alerts by severity plus a separate count of alerts currently being worked on:
| Stat | Description |
|---|---|
| Critical (Open) | Severity-critical alerts not yet resolved |
| Error (Open) | Severity-error alerts not yet resolved |
| Warning (Open) | Severity-warning alerts not yet resolved |
| Info (Open) | Severity-info alerts not yet resolved |
| In Progress | Alerts currently being investigated regardless of severity |
Saved Views
Quick-access tabs that apply pre-configured filters so you can jump straight to the alerts that matter most. Click a tab to switch the board view instantly.
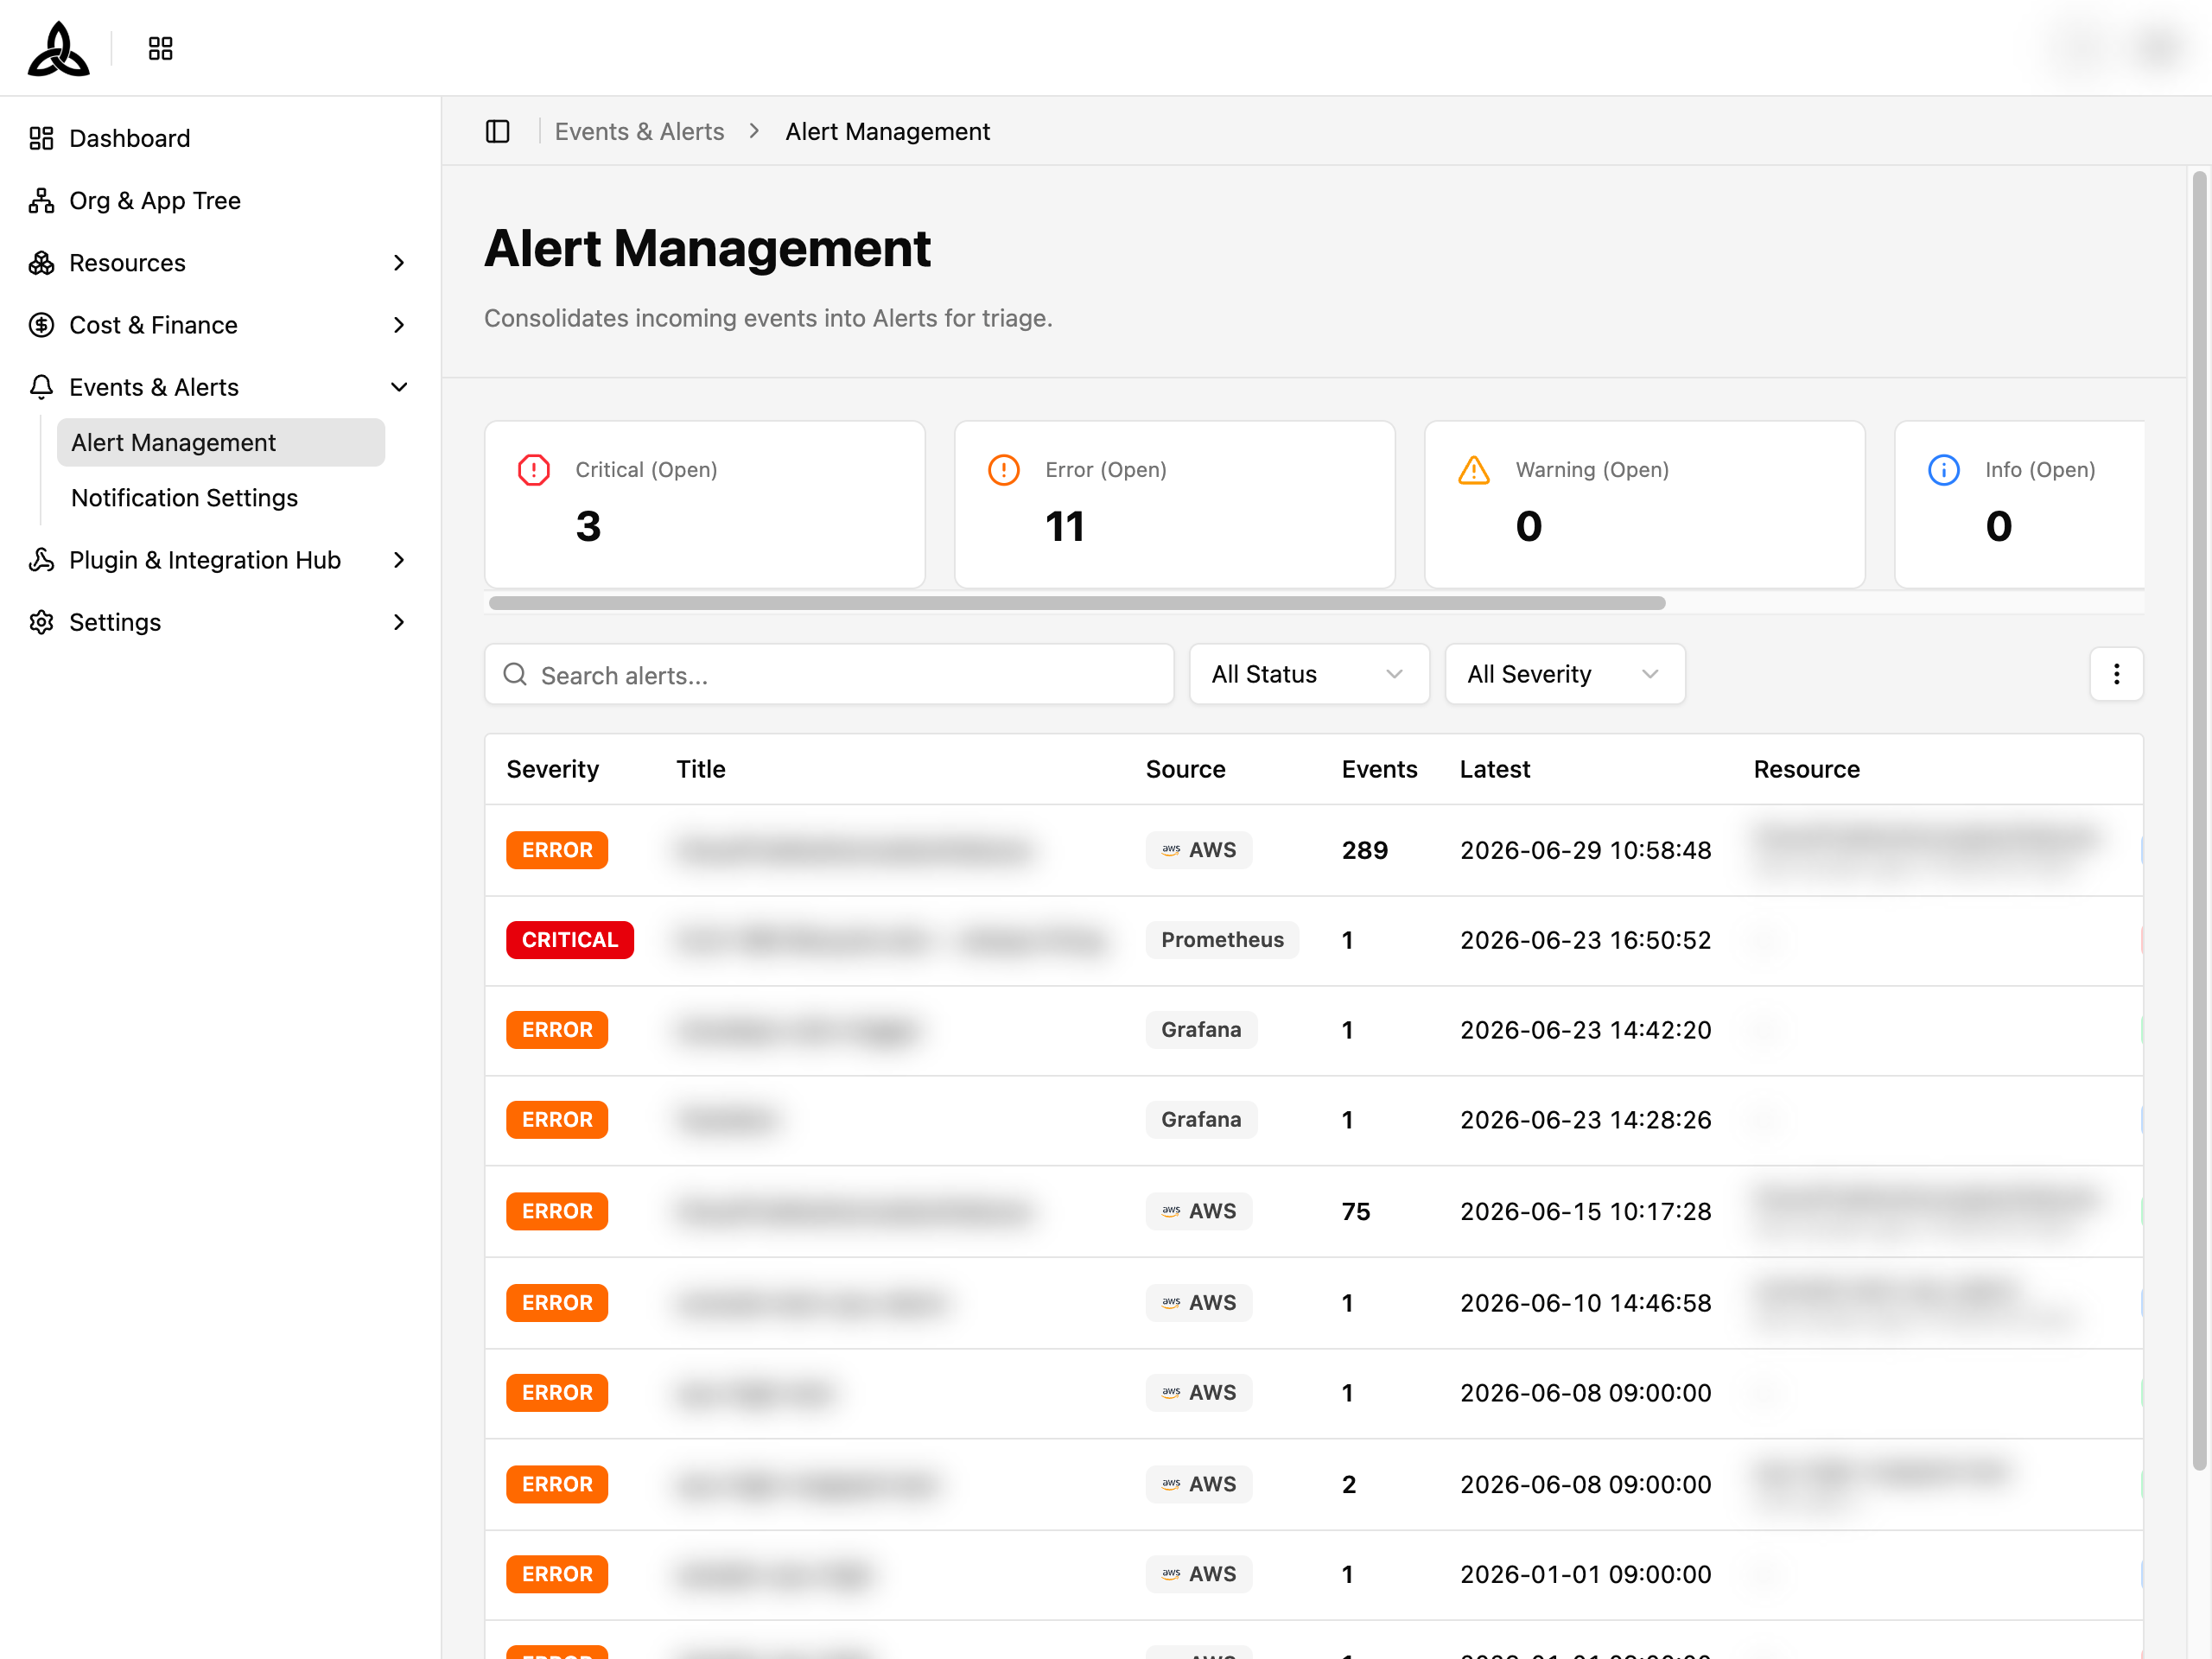
| View | Filter |
|---|---|
| All Open | Every alert with status Open or In Progress |
| Unassigned | Open alerts with no responder assigned |
| Assigned to Me | Alerts currently assigned to the signed-in user |
| Critical | Alerts with severity Critical |
| Recently Updated | Alerts ordered by most-recent activity |
Filters and Search

| Filter | Description |
|---|---|
| Search | Free-text search (Search alerts...) over alert title, resource, and source |
| Severity | All Severity / Critical / Error / Warning / Info |
| Status | All Status / Open / In Progress / Resolved |
| Source | Source plugin (e.g. Datadog, GCP Monitoring) |
| Time Range | Bounded view window |
| Refresh | Re-pull the active filter set |
| Reset filters | Clear every filter to the default view |
The filter state is persisted to the URL — sharing the link reproduces the same view.
Alert Table
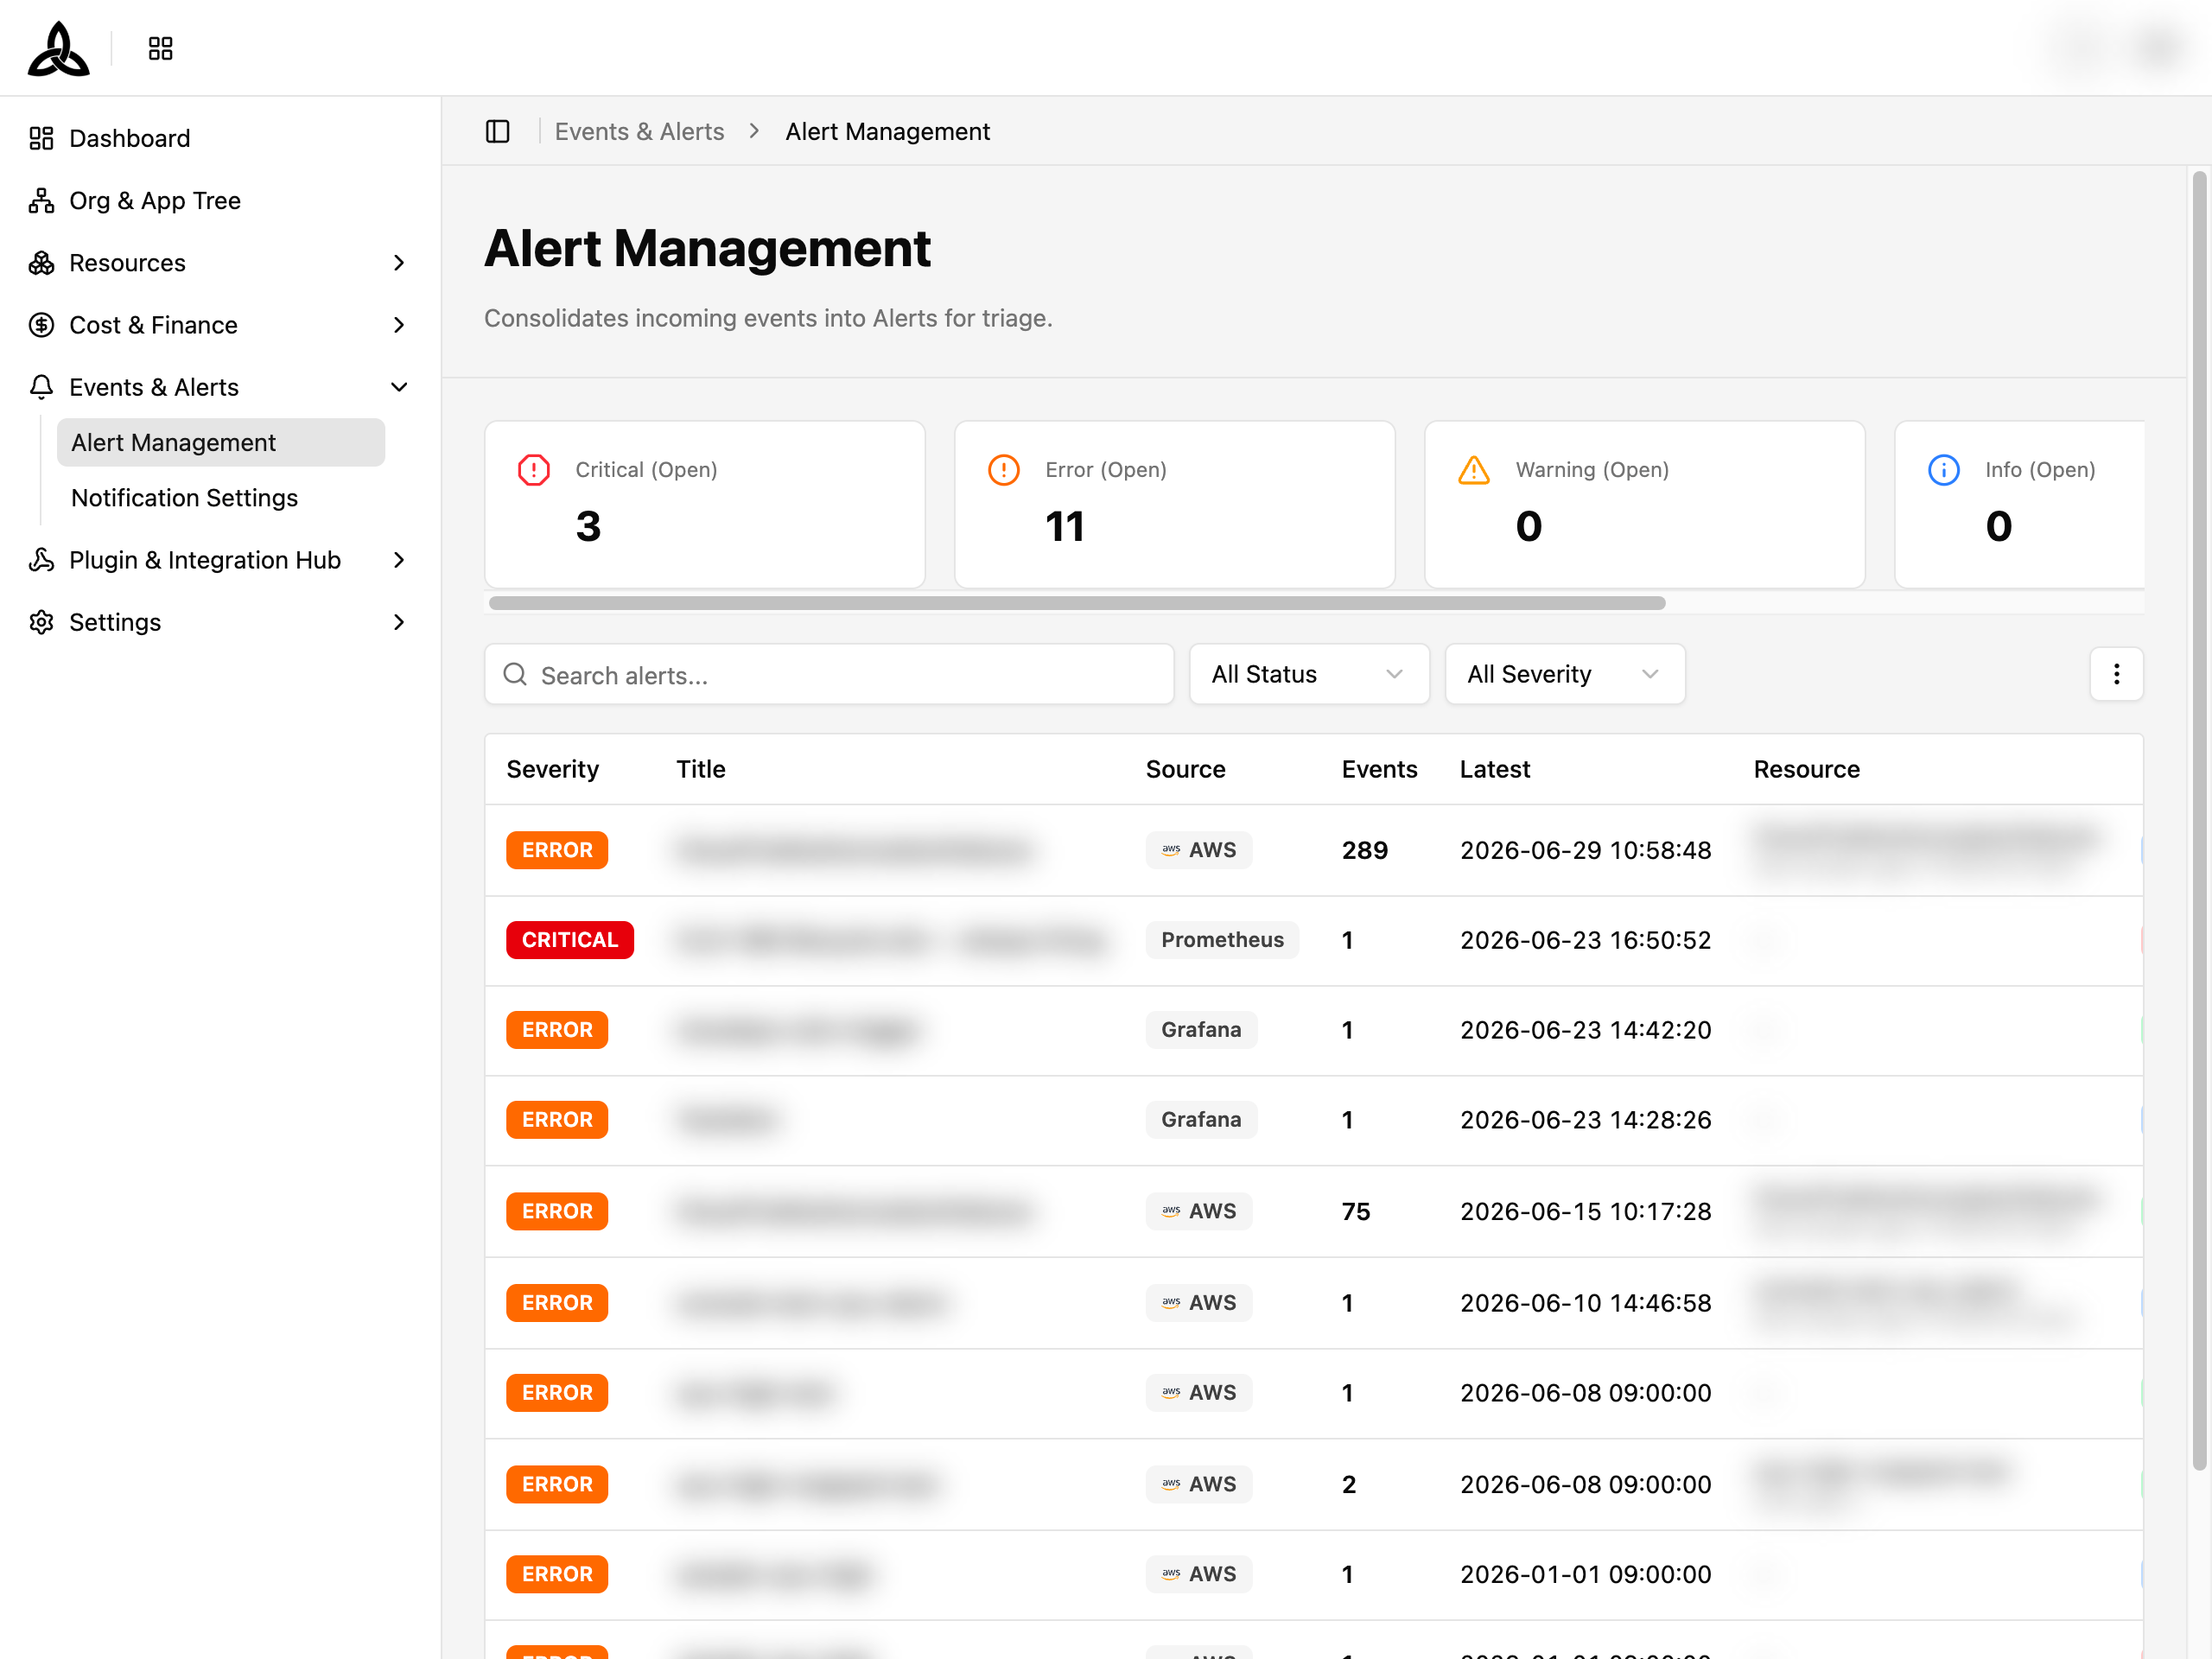
| Column | Description |
|---|---|
| Severity | Severity badge (Critical / Error / Warning / Info) |
| Status | Lifecycle state (Open / In Progress / Resolved) |
| Title | Alert title summarizing the underlying event |
| Linked Resource | Resource the alert is mapped to, or Not mapped |
| Parent App | Application owning the resource, or Unassigned |
| Assigned Responder | The responder currently working the alert, or Unassigned |
| First Seen | When the first matching event was observed |
| Last Seen | Most recent matching event |
The table is paginated via Showing {showing} of {total} and a Load more button at the bottom.
Click any row to open the detail page.
Alert Detail Page
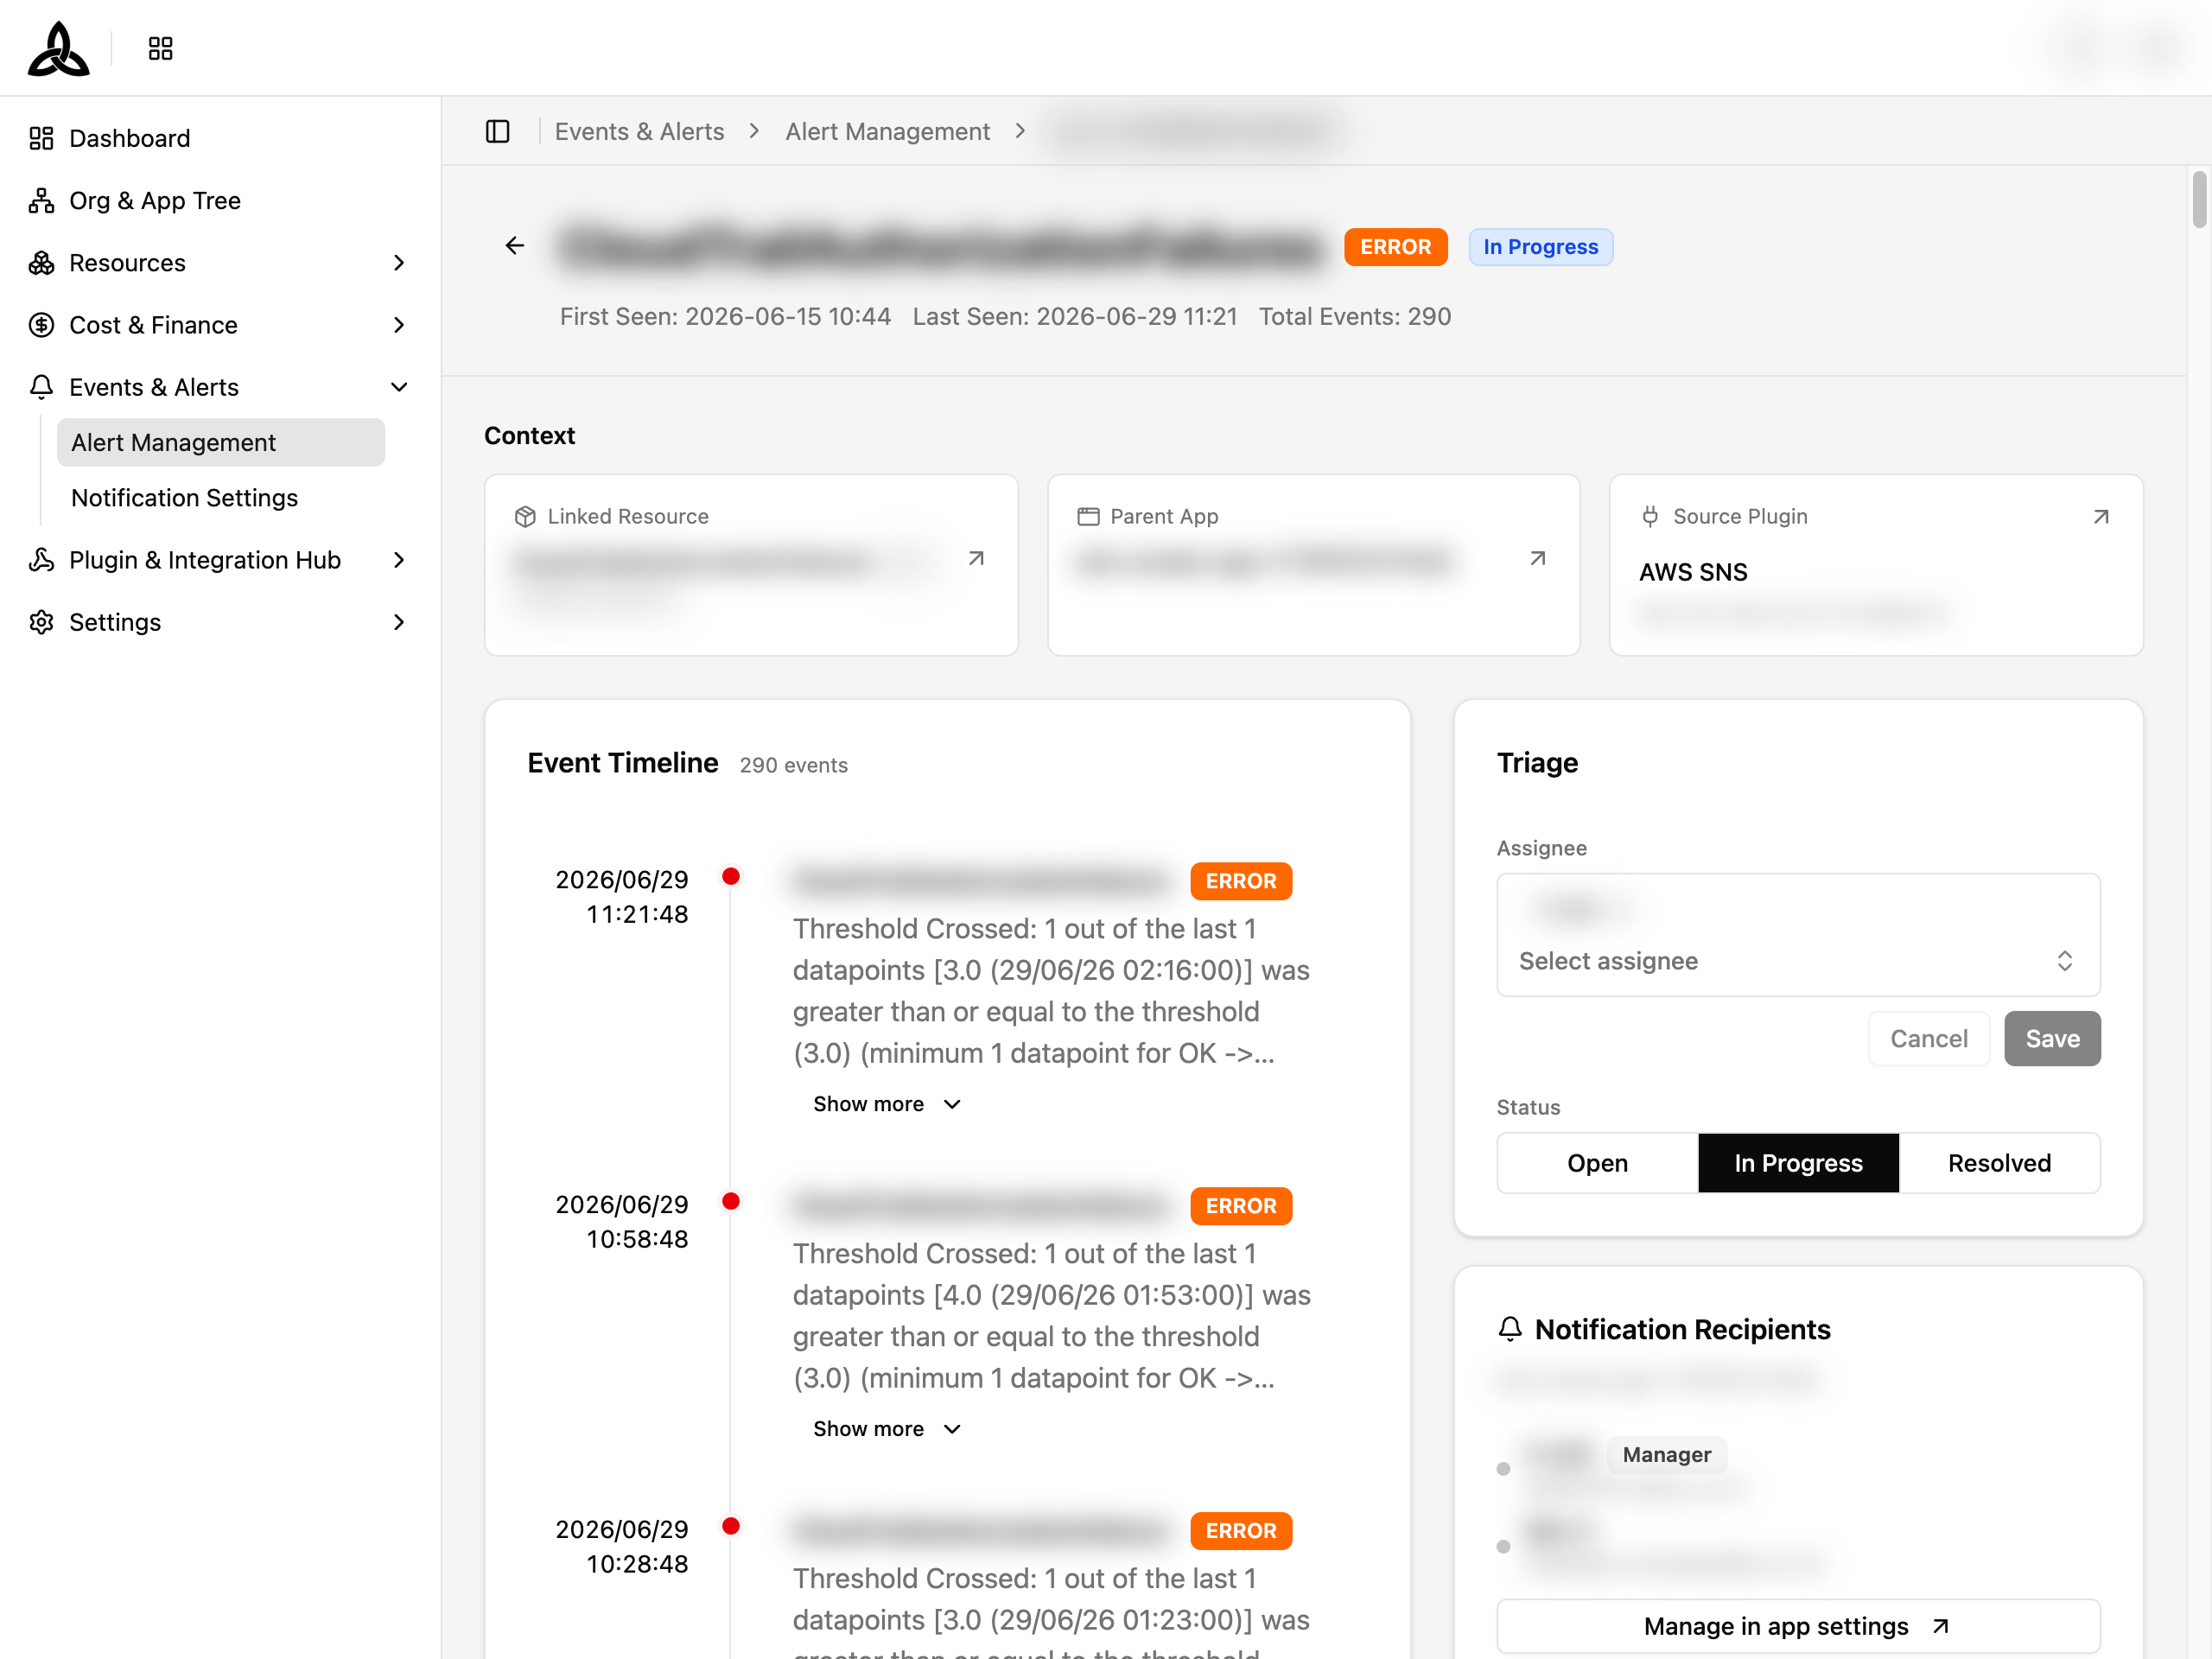
The detail page is reached by clicking an alert row. Three columns:
Triage actions
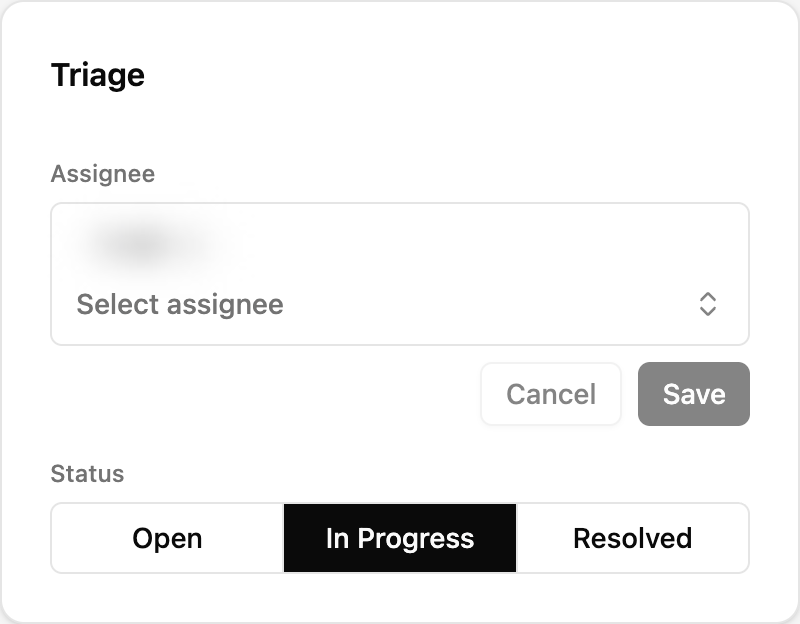
| Action | Description |
|---|---|
| Edit Responder | Pick the organization and responder(s) to own the alert. Saving the assignment automatically transitions the alert to In Progress |
| Status | Change the status manually. Resolved alerts are locked — the system handles resolution, and triage actions cannot be changed afterwards |
| Note / Action Memo | Per-alert annotations. (Coming soon — placeholder while the feature is finalized.) |
Linked entities

| Field | Description |
|---|---|
| Linked Resource | The resource tied to the alert |
| Parent App | The application the resource belongs to |
| Source Plugin | Plugin that produced the alert |
When any of these are not yet wired up, the page shows Resource not mapped, Application not assigned, or Unknown source respectively.
Event sections
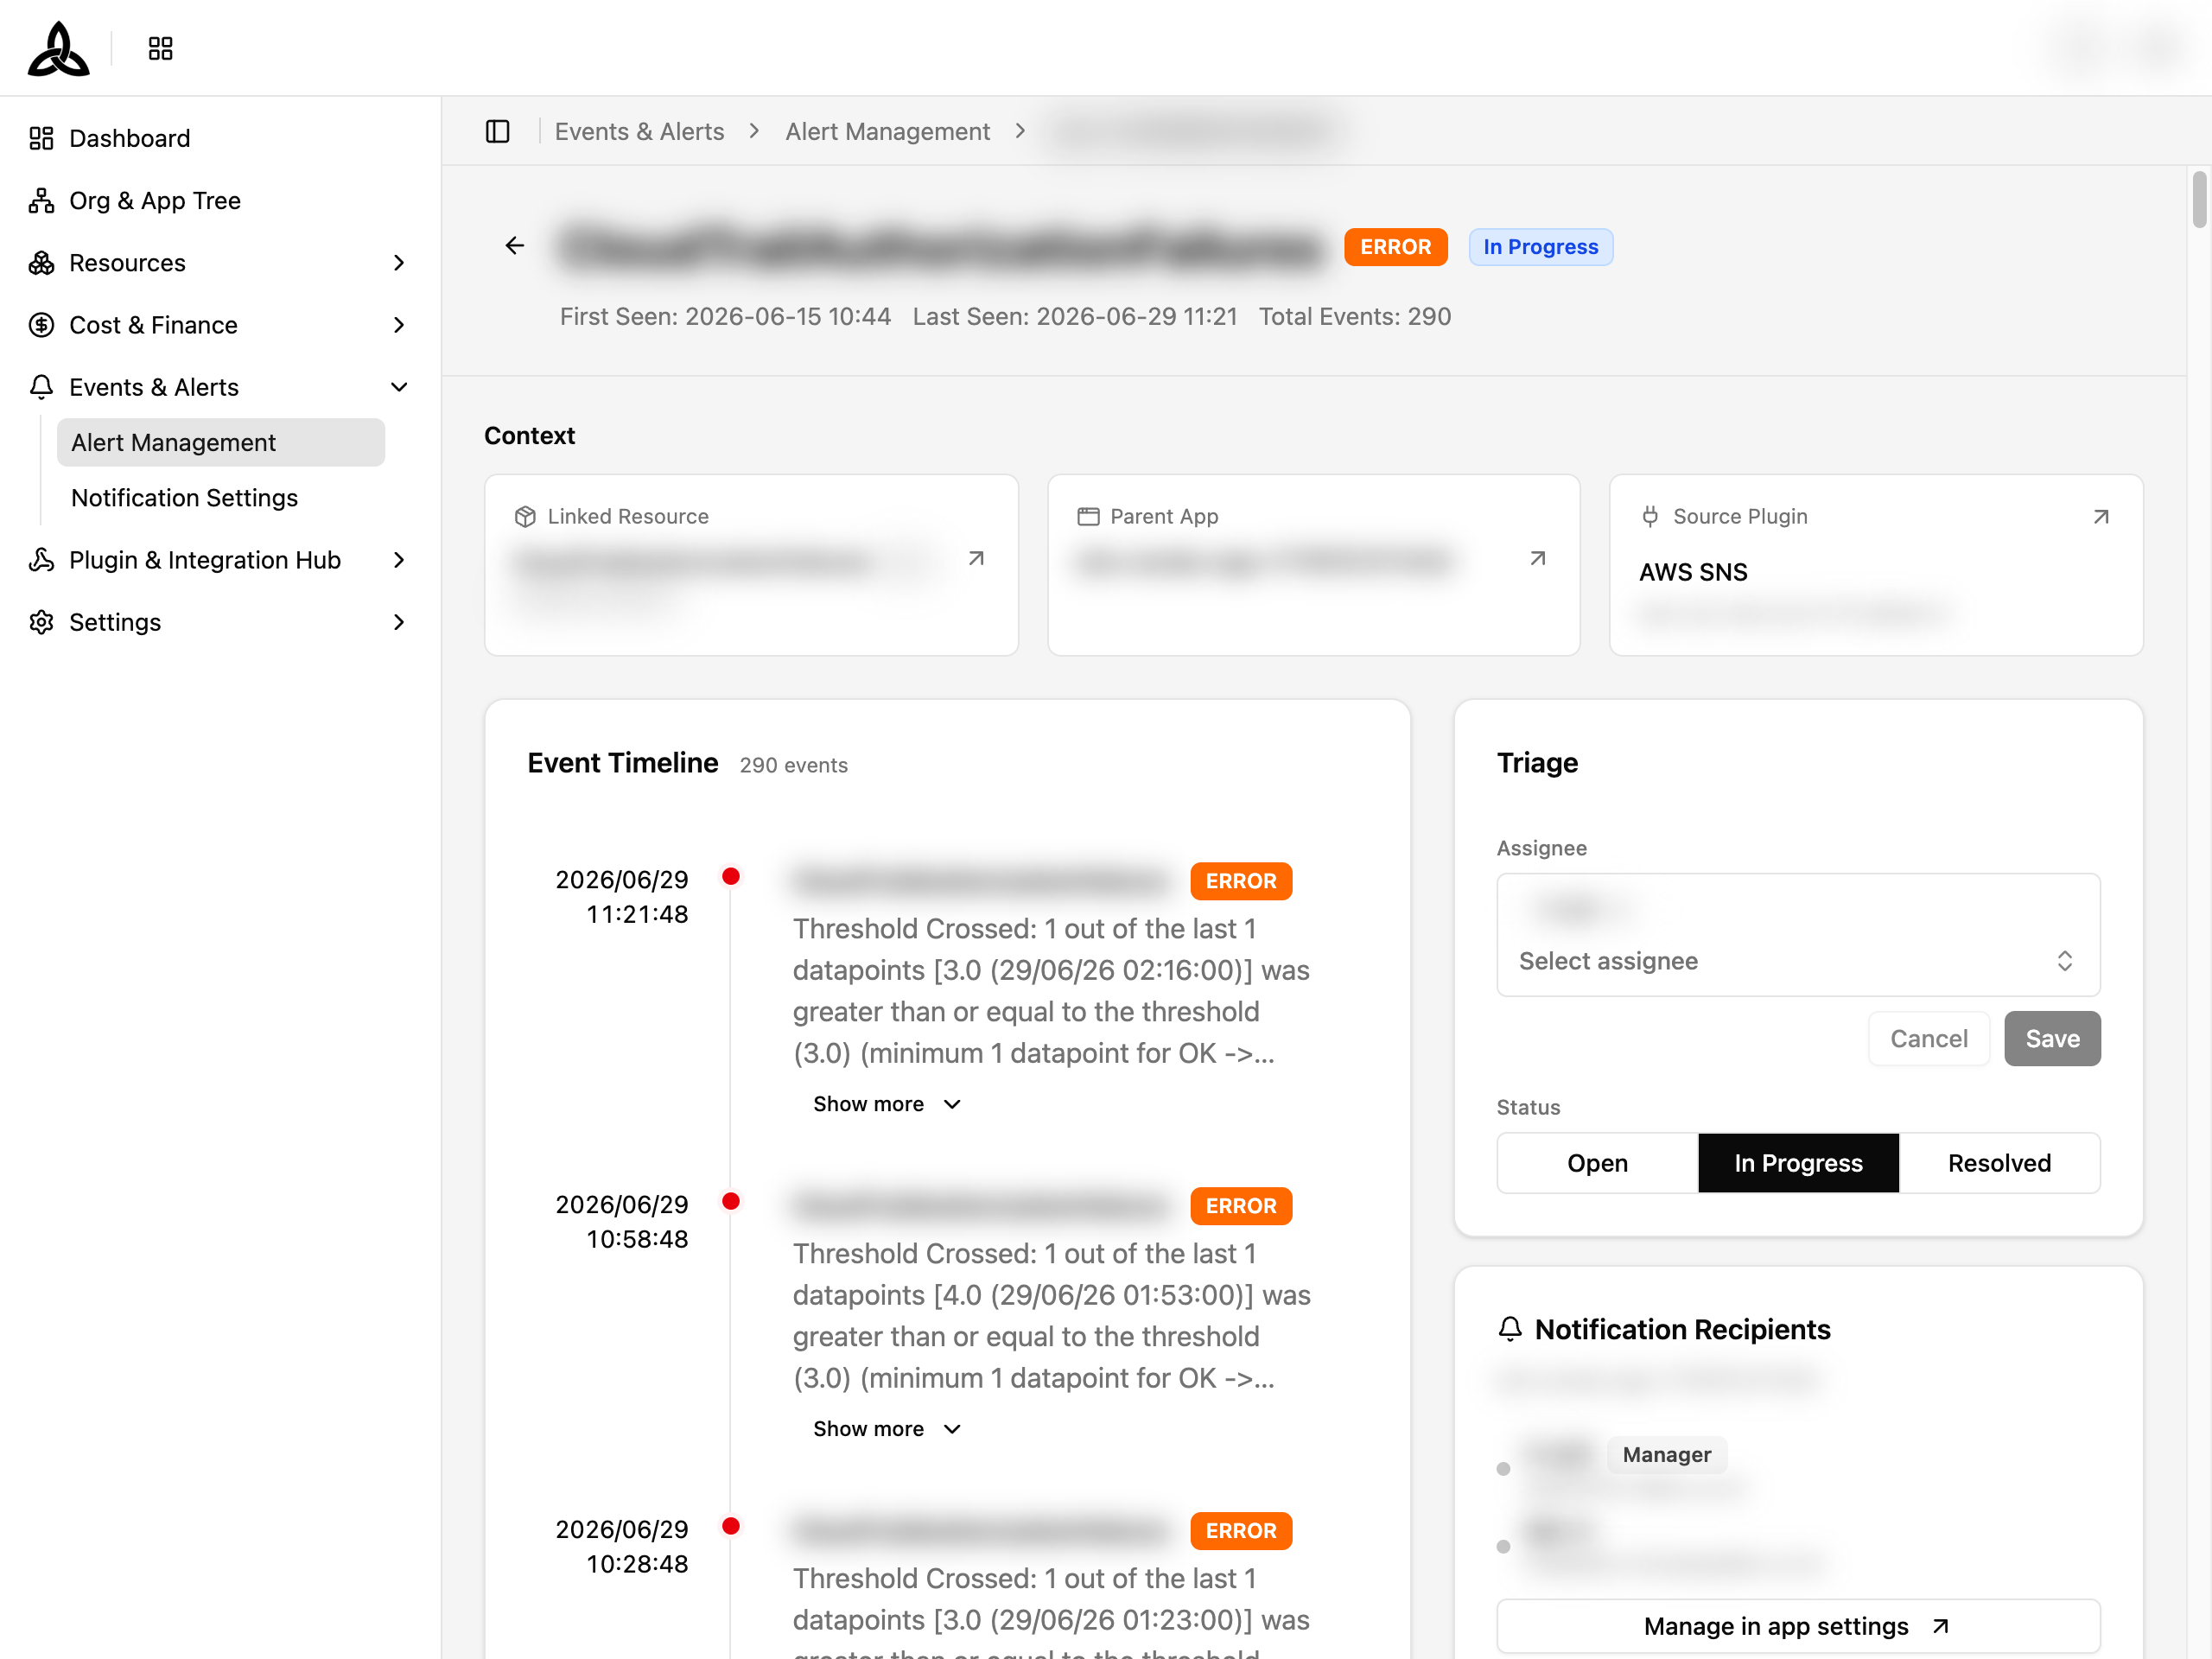
| Section | Description |
|---|---|
| Event Summary | Aggregated description of the underlying event |
| Key Event Timeline | Highlighted milestones — first seen, last seen, status changes |
| Full Event List | Complete event log with Total Events count |
Action History
A chronological list of triage actions (latest first):
| Action Type | Rendering |
|---|---|
Assignee changed | with optional inline note |
Status changed | with optional inline note |
Note added | manual note |
Each entry shows the actor (by {actor} or System).
Meta
| Field | Description |
|---|---|
| Alert ID / Alert # | System identifiers |
| Provider / Account ID / Webhook ID / Organization ID | Source context |
| Created At / Updated At | Audit timestamps |
Empty and Error States
- Empty —
No active alertswithThere are no alerts requiring attention. - Filtered empty —
No alerts match your filterswithTry adjusting or resetting your filters. - Load error (board) —
Failed to load alertswithPlease try again later. - Load error (detail) —
Failed to load alert detailswith the same retry guidance - Not found —
Alert not foundwithThe alert may have been deleted or the link is invalid.