FinOps
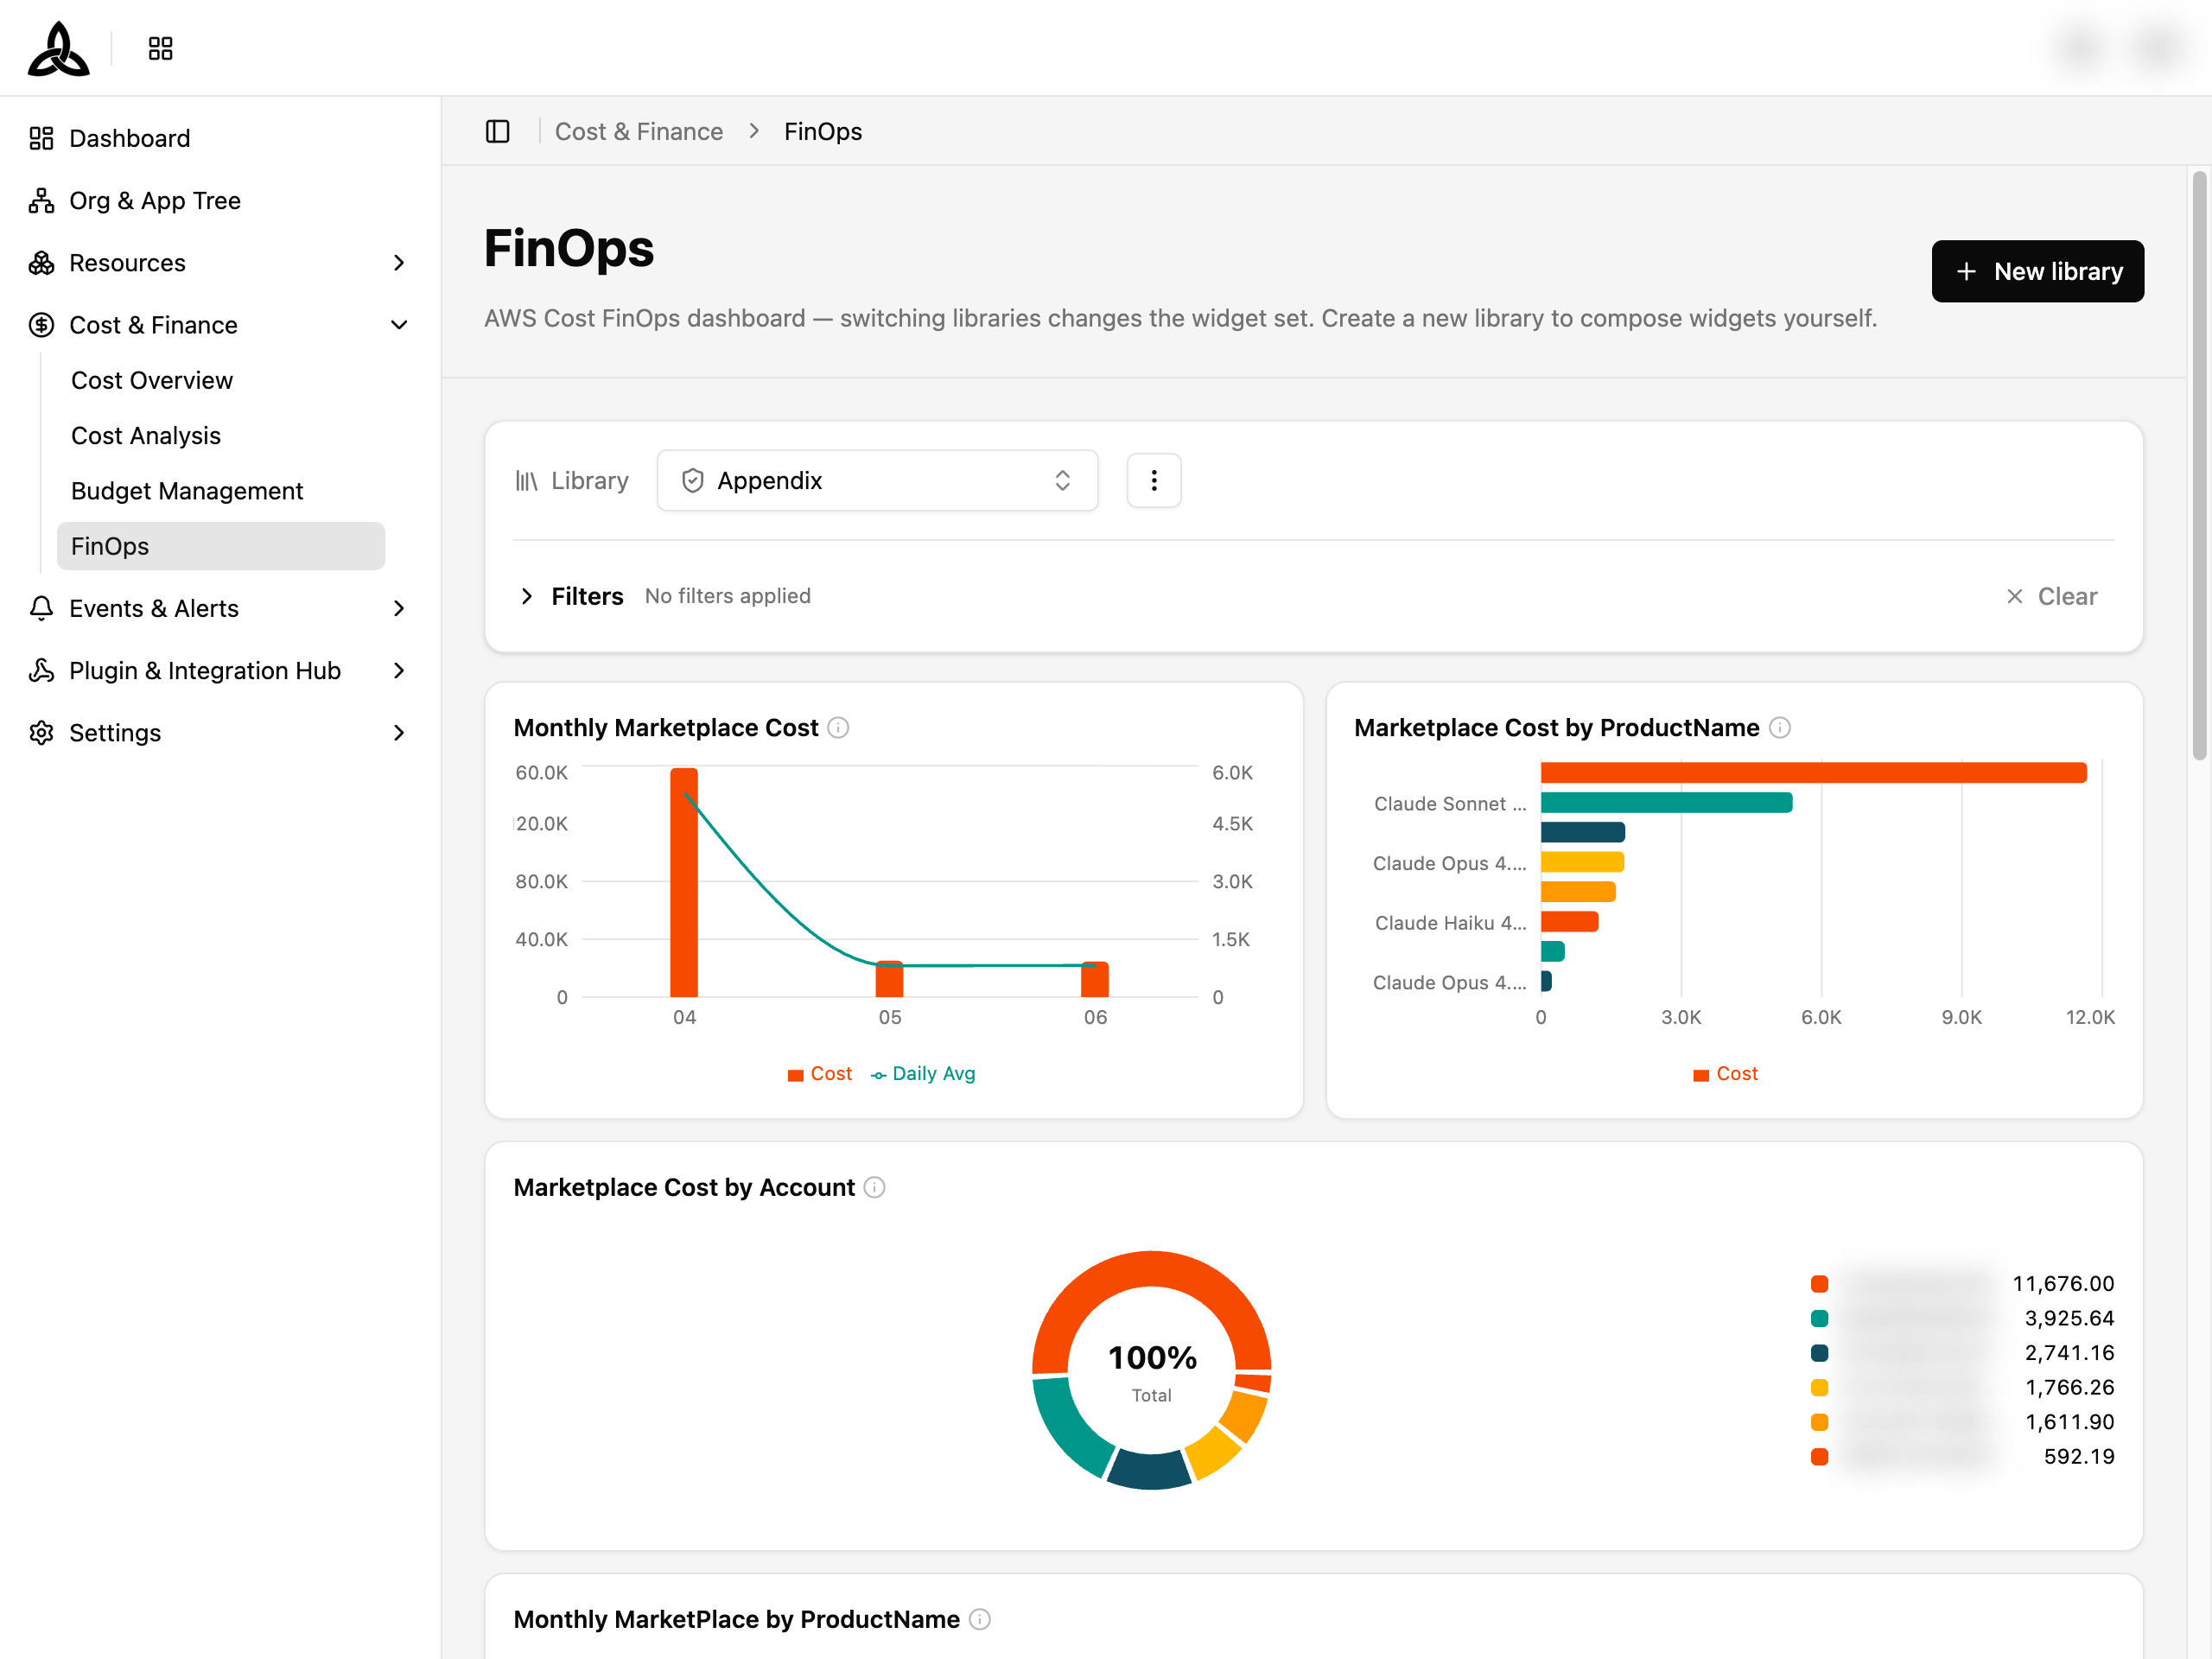
On the [Cost & Finance > FinOps] page, you can work through a ready-made set of cost dashboards. Each dashboard — called a library — carries its own widgets and its own filters, so switching library changes the entire page.
Page Layout
| Section | Purpose |
|---|---|
| Library | Chooses which dashboard is displayed |
| Filters | Narrows every widget on the page. The available filters come from the selected library |
| Widget board | The widgets belonging to the selected library |
Choosing a Library
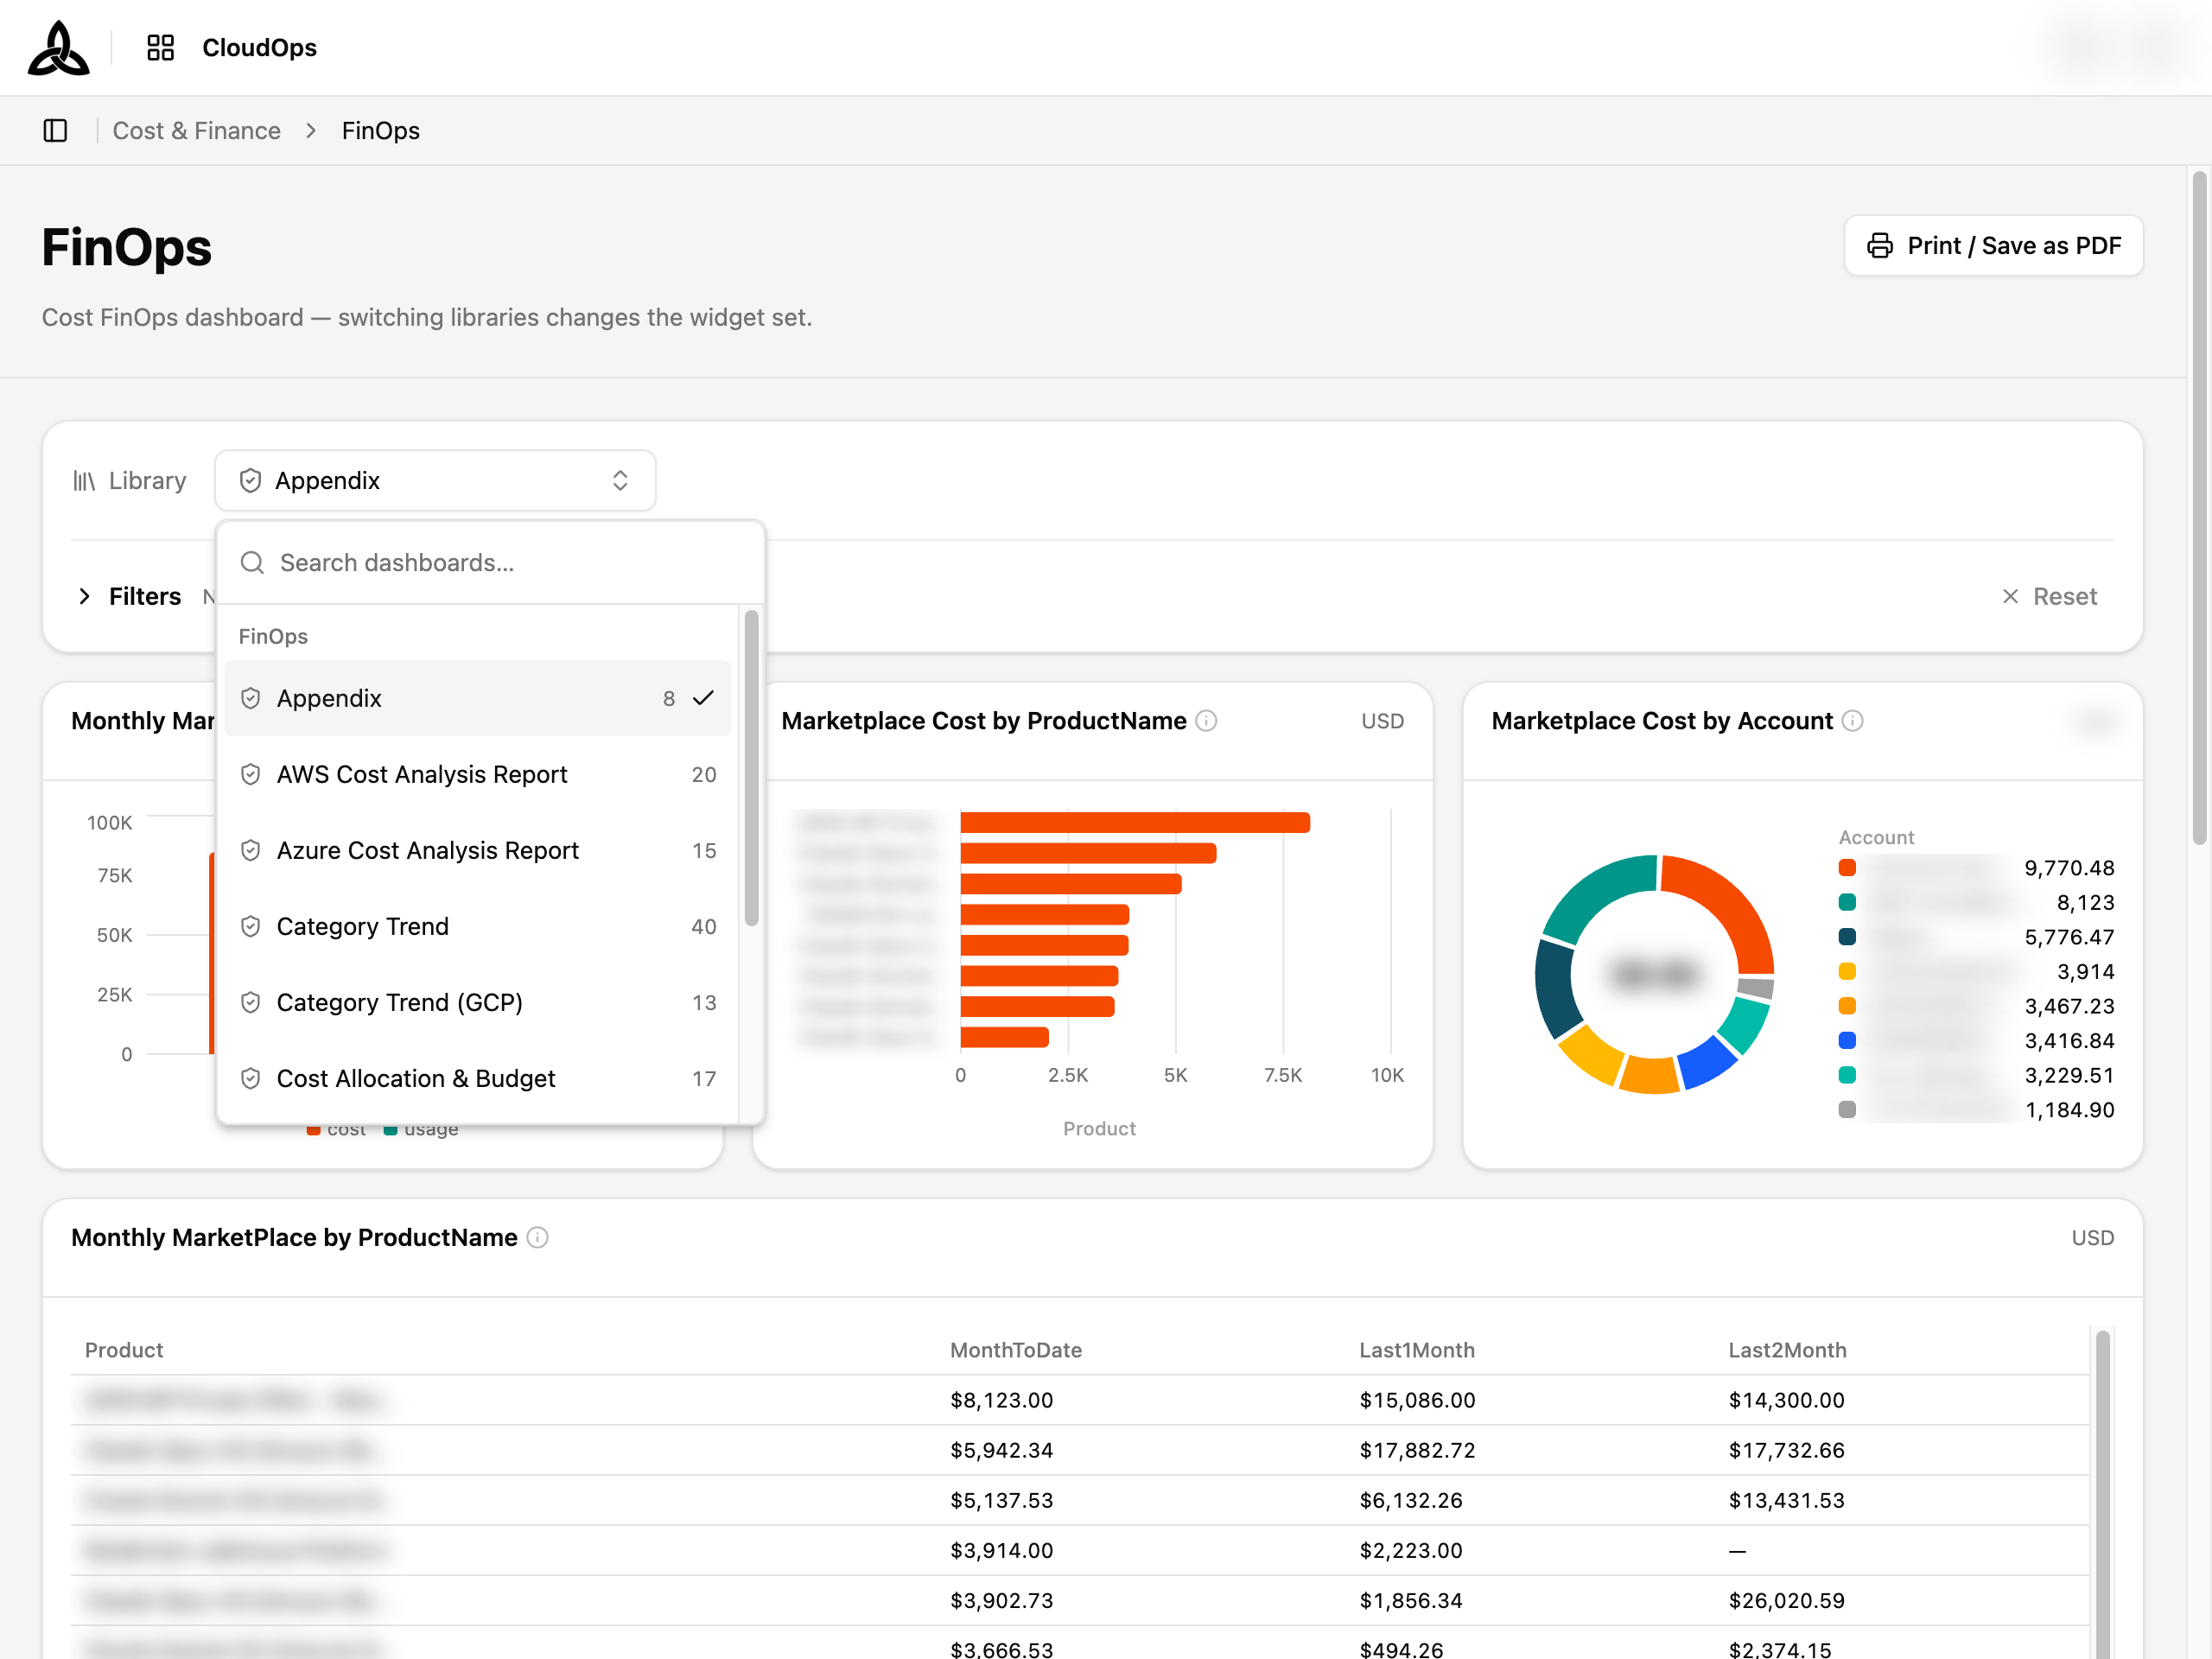
Click the library selector to open the list.
| UI element | Description |
|---|---|
| Search dashboards… | Filters the list by name |
| Library entries | Each row shows the dashboard name and how many widgets it contains. The active one is marked with a check |
Entries are grouped by category, and each row shows how many widgets the dashboard holds. Libraries cover different angles on the same cost data — for example Appendix, Category Trend, Category Trend (GCP), Cost Allocation & Budget, and Cost Change Overview. Pick the one that matches the question you are asking; the board and the filter row both change with it. Some libraries are provider-specific — Category Trend reads AWS cost only, and Category Trend (GCP) is its GCP counterpart — so choose the one that matches the accounts you have connected.
Cost analysis reports per CSP
Cost analysis reports are provided per cloud provider — AWS Cost Analysis Report and Azure Cost Analysis Report appear in the list above, and a GCP report is available where GCP cost data is connected. Each is scoped to its own provider, so widgets from different CSPs are never mixed into one report.
Summary and insight panels render as callouts rather than plain lists, which is why some entries read as a short statement instead of a table.
Filters
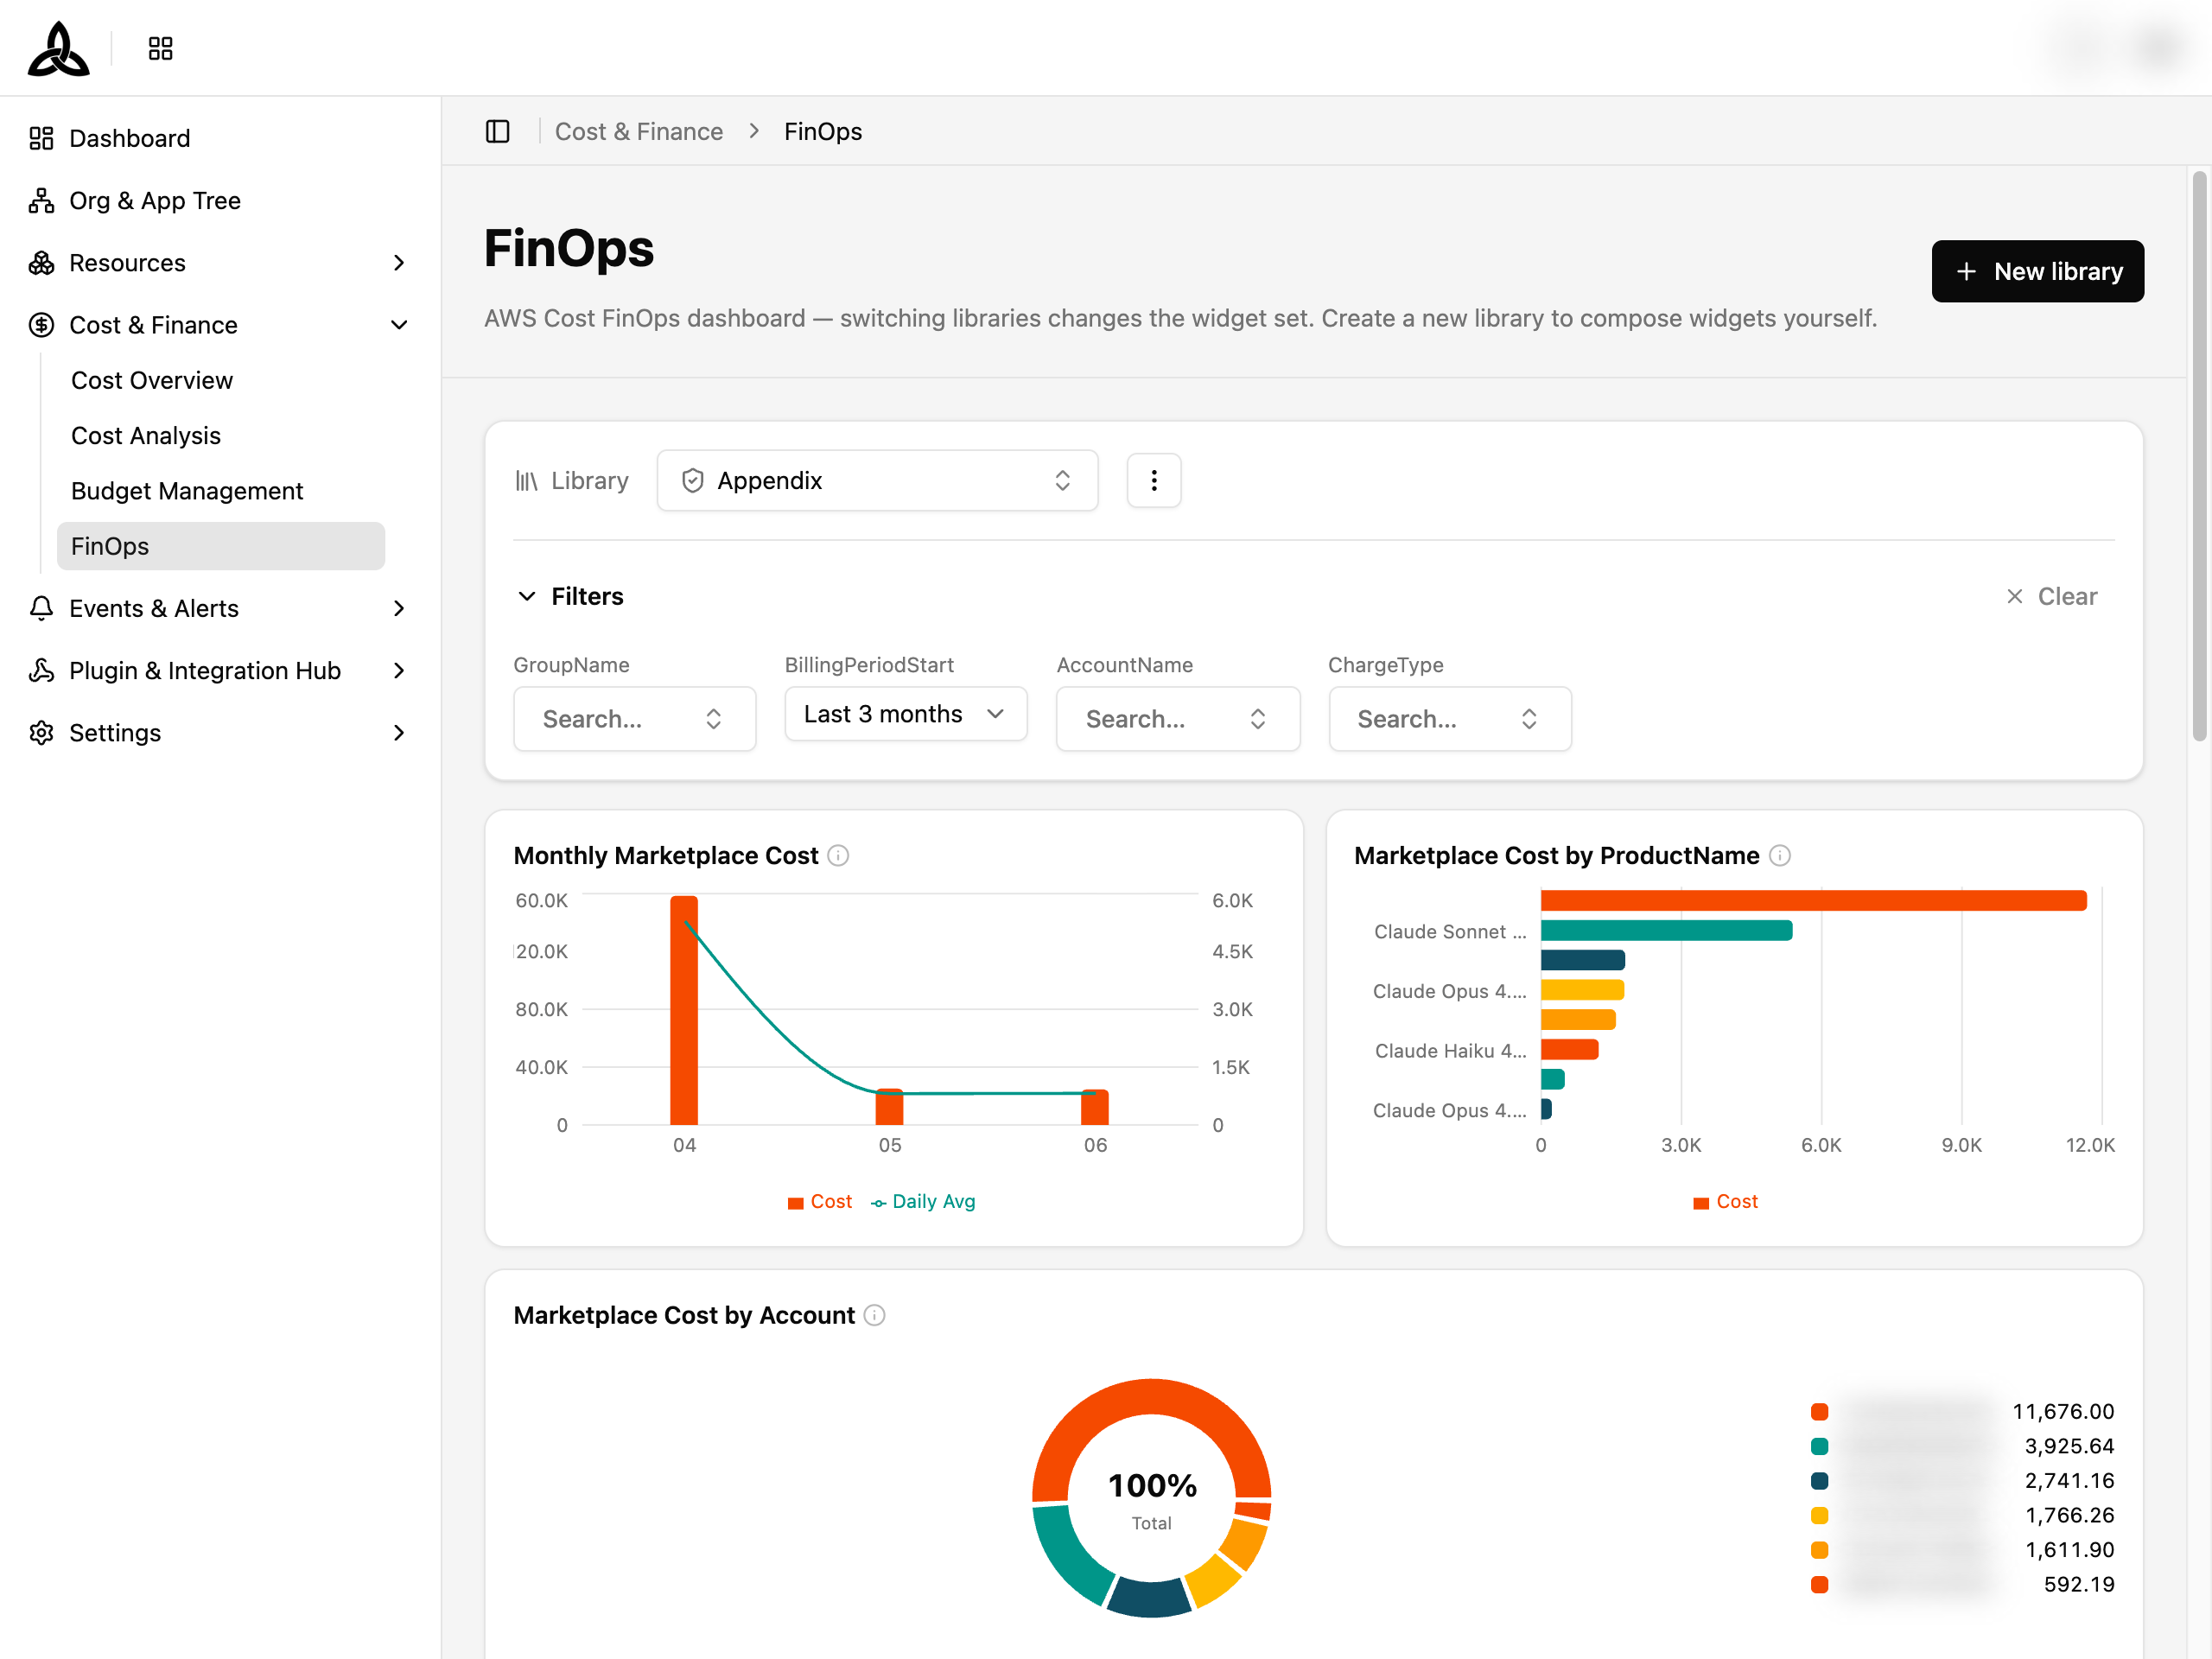
Click Filters to expand the filter row. Selections apply to every widget on the board at once.
The filter set is defined by the library, so it differs from dashboard to dashboard. A marketplace-oriented library, for instance, offers Billing Period, Account, and Charge Type.
| UI element | Description |
|---|---|
| Filter controls | One control per filter the library defines |
| Reset | Clears every filter and returns to the unfiltered board |
When nothing is selected the collapsed row reads No filters applied.
Printing / saving as PDF
[Print / Save as PDF] in the page header prints the board you are looking at. Before the browser’s print dialog opens, CloudOps loads every widget on the board — including the ones you have not scrolled to — so the printout has no blank cards; a Preparing PDF dialog shows N of M widgets ready while this happens, and any widget that cannot be loaded is left blank rather than blocking the print. The print dialog opens on its own once everything is ready; Cancel stops the preparation.
The printout carries the capture time and the filters that were applied, and tables are laid out to fit the page rather than scrolling. Choose Save as PDF in the browser dialog to keep a file — it is proposed with a name that identifies the board, cloudops-finops-<library>-<YYYYMMDD> (when the library name is not plain ASCII the name part is omitted and only the date remains).
Widgets
Every widget on the board follows the same conventions.
| Element | Description |
|---|---|
| Title | What the widget measures |
| Unit | Shown at the top-right when the values are monetary — for example USD |
| ⓘ | Hover for a description of what the widget calculates |
| Refresh | Re-fetches just that widget |
Widgets come in several shapes depending on what they present — combined bar-and-line charts for cost against usage, horizontal bar charts for rankings, donut charts with a legend for share-of-total, and tables for period-over-period comparison such as MonthToDate, Last1Month, and Last2Month.