Cost Anomalies
On the [Cost & Finance > Cost Anomalies] page — marked Beta — you can review days where spend departed from its usual pattern. CloudOps evaluates your costs once a day, keeps the result as an event, and explains which service drove the change.
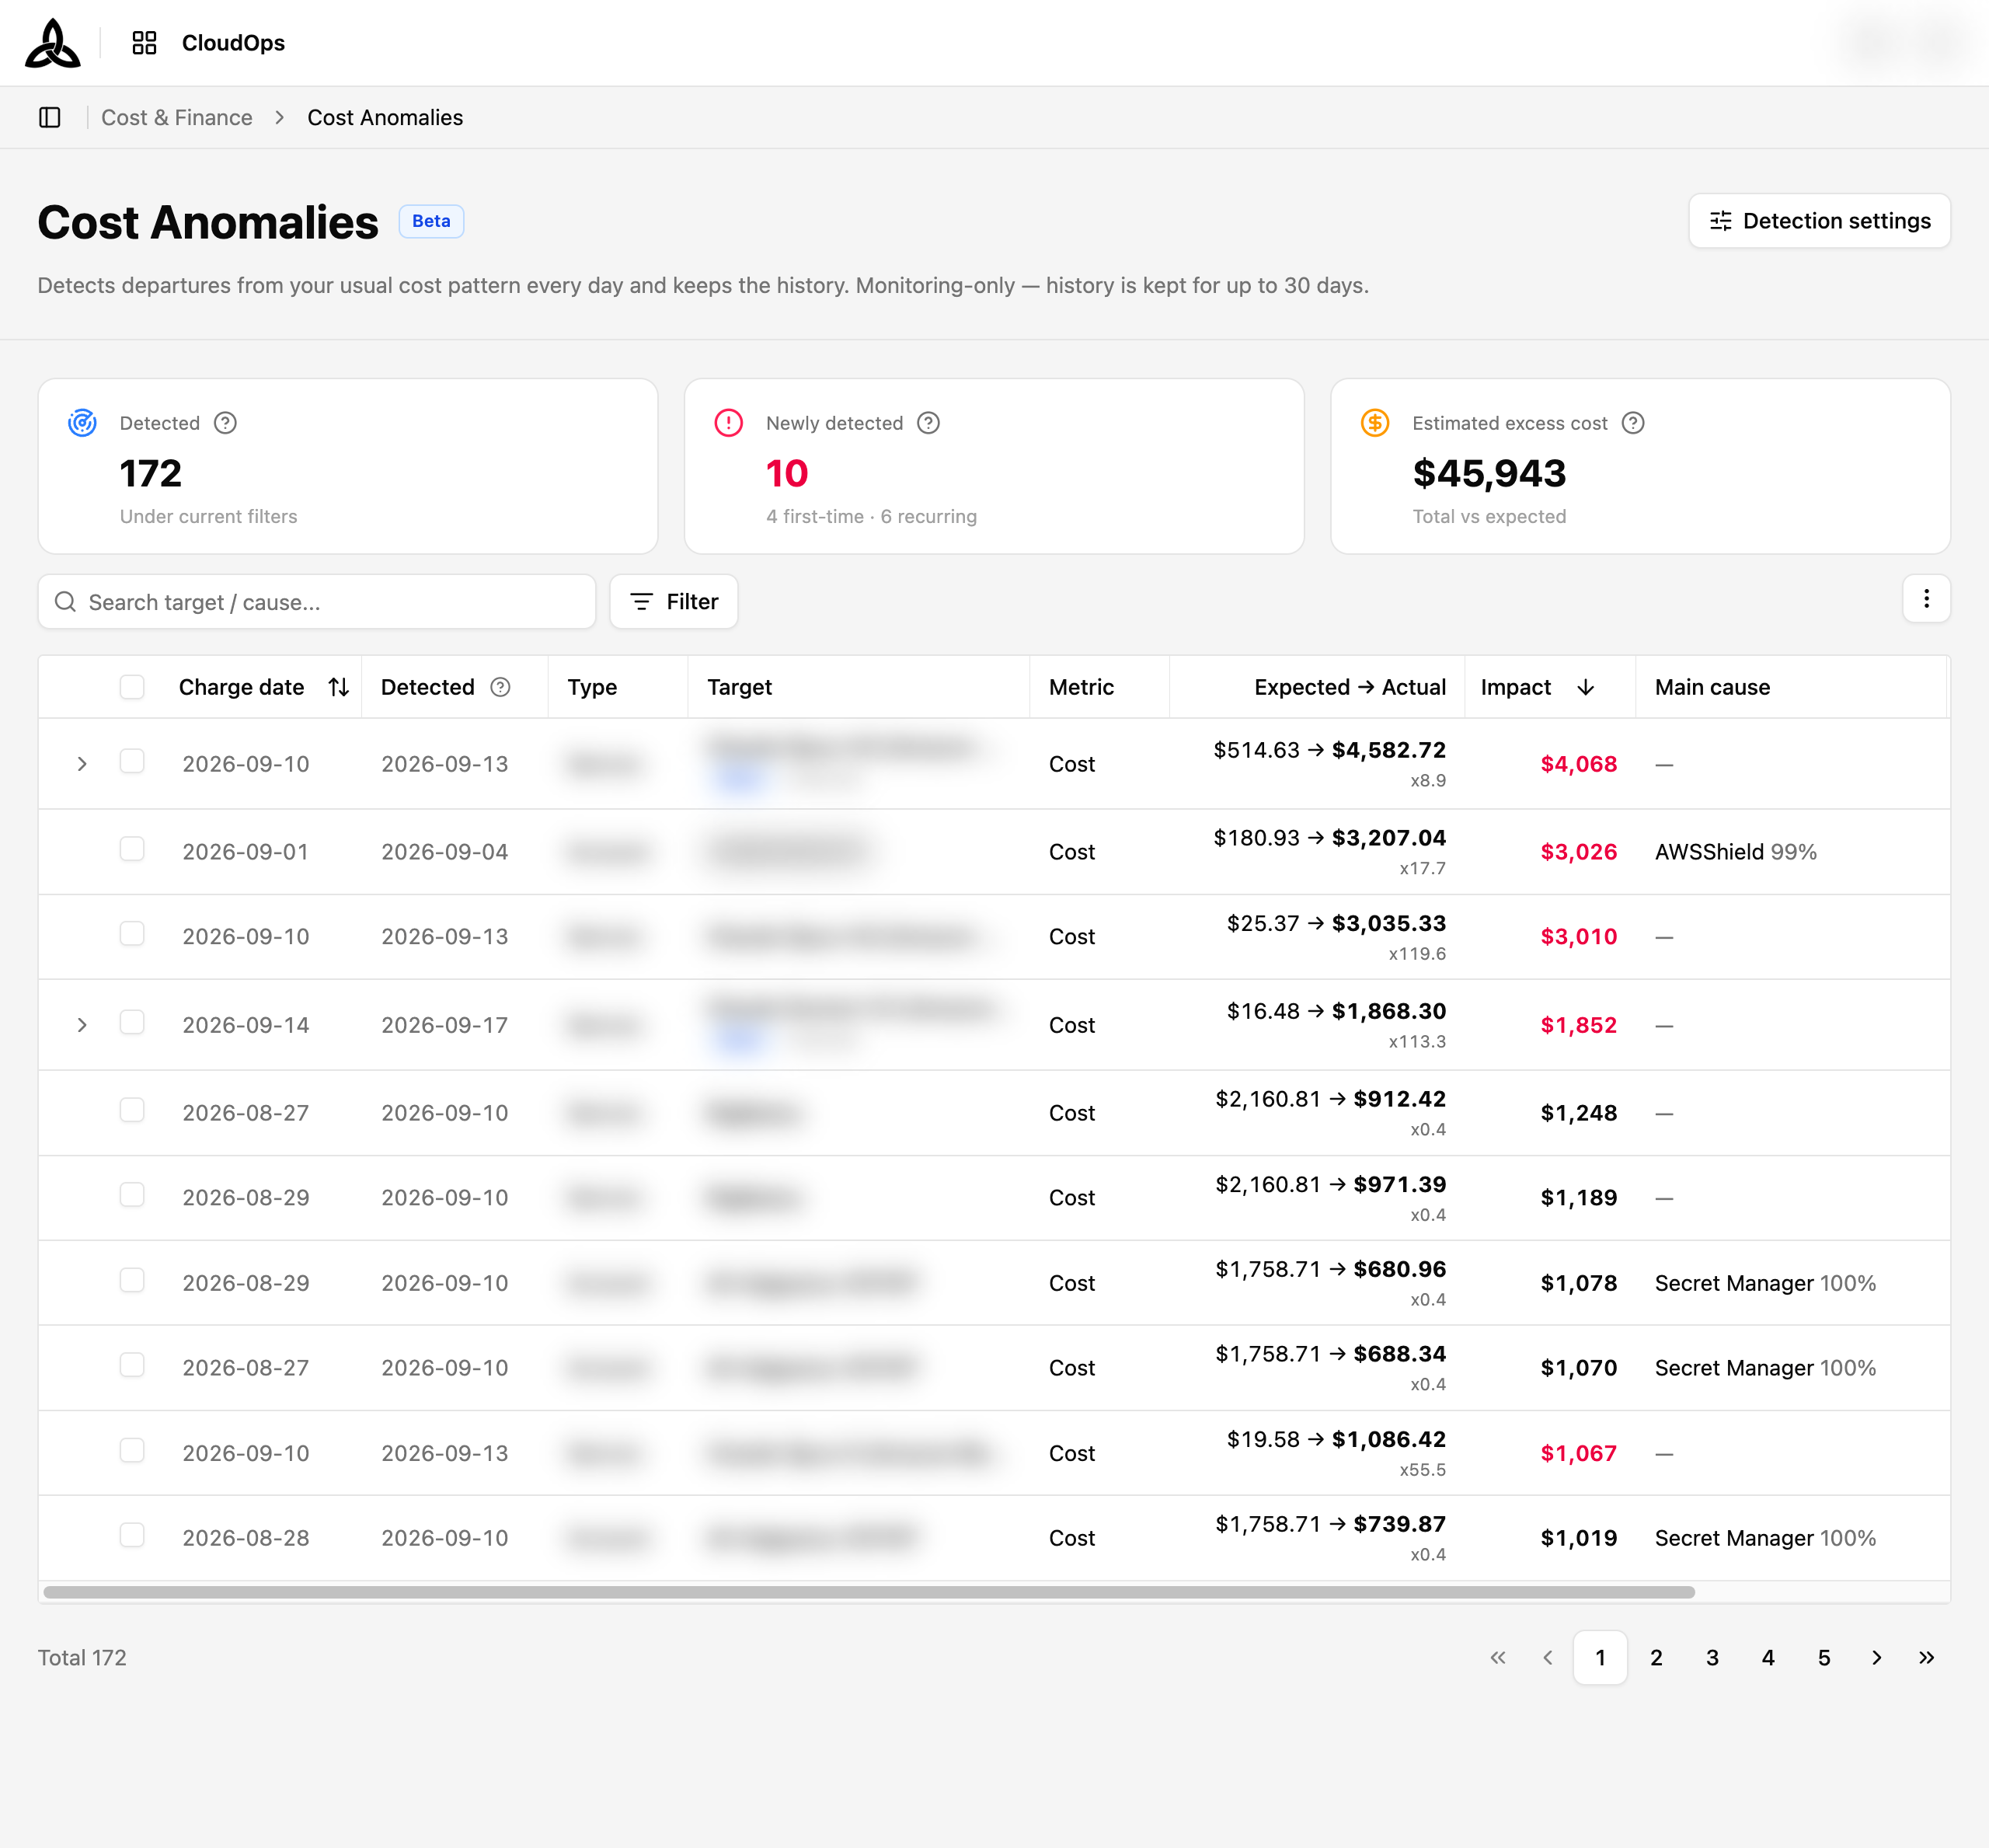
The header line reports when detection last ran and which day’s data it used, so you can tell at a glance whether what you are looking at is current.
Summary Cards
| Card | Meaning |
|---|---|
| Detected | Anomalies under the current filters |
| Estimated excess cost | Total amount above the expected cost across those anomalies |
| Newly detected | Anomalies picked up by the most recent detection run, split into first-time and recurring |
Viewing
Search matches the target or the cause, so you can look up either an account you care about or a service you suspect.
| Column | Description |
|---|---|
| Charge date | The day the cost was actually incurred. Detection usually runs in the next day’s batch |
| Detected | The day the detection batch flagged it — this can be a day or more after the charge date |
| Type | The level the anomaly was found at — Customer, Organization, Account, App, Service, or CSP |
| Target | The specific account, provider, service, or app |
| Metric | What was measured — Cost, Usage, or Unit cost |
| Expected → Actual | The usual figure against what actually happened, with the ratio underneath |
| Impact | The size of the gap in money — the table sorts by this by default |
| Main cause | The service that contributed most, with its share |
| Severity | Critical / High / Medium / Low |
| Duration | How long the anomaly has lasted |
First and recurring detections
Every anomaly is marked as one of two kinds:
| Kind | Meaning |
|---|---|
| First detection | The same target was not anomalous the day before — this one is new |
| Recurring | The same target was already anomalous the day before — this one is carrying over |
A problem that persists is re-detected rather than duplicated, so a long-running issue stays one thread instead of filling the list with a new row every day.
Related anomalies
One cause usually surfaces at several levels at once — a spike in a service is also visible in the account, organization, and application it belongs to. One row is marked Root and the rest are grouped under it as related anomalies you can expand.
Filters
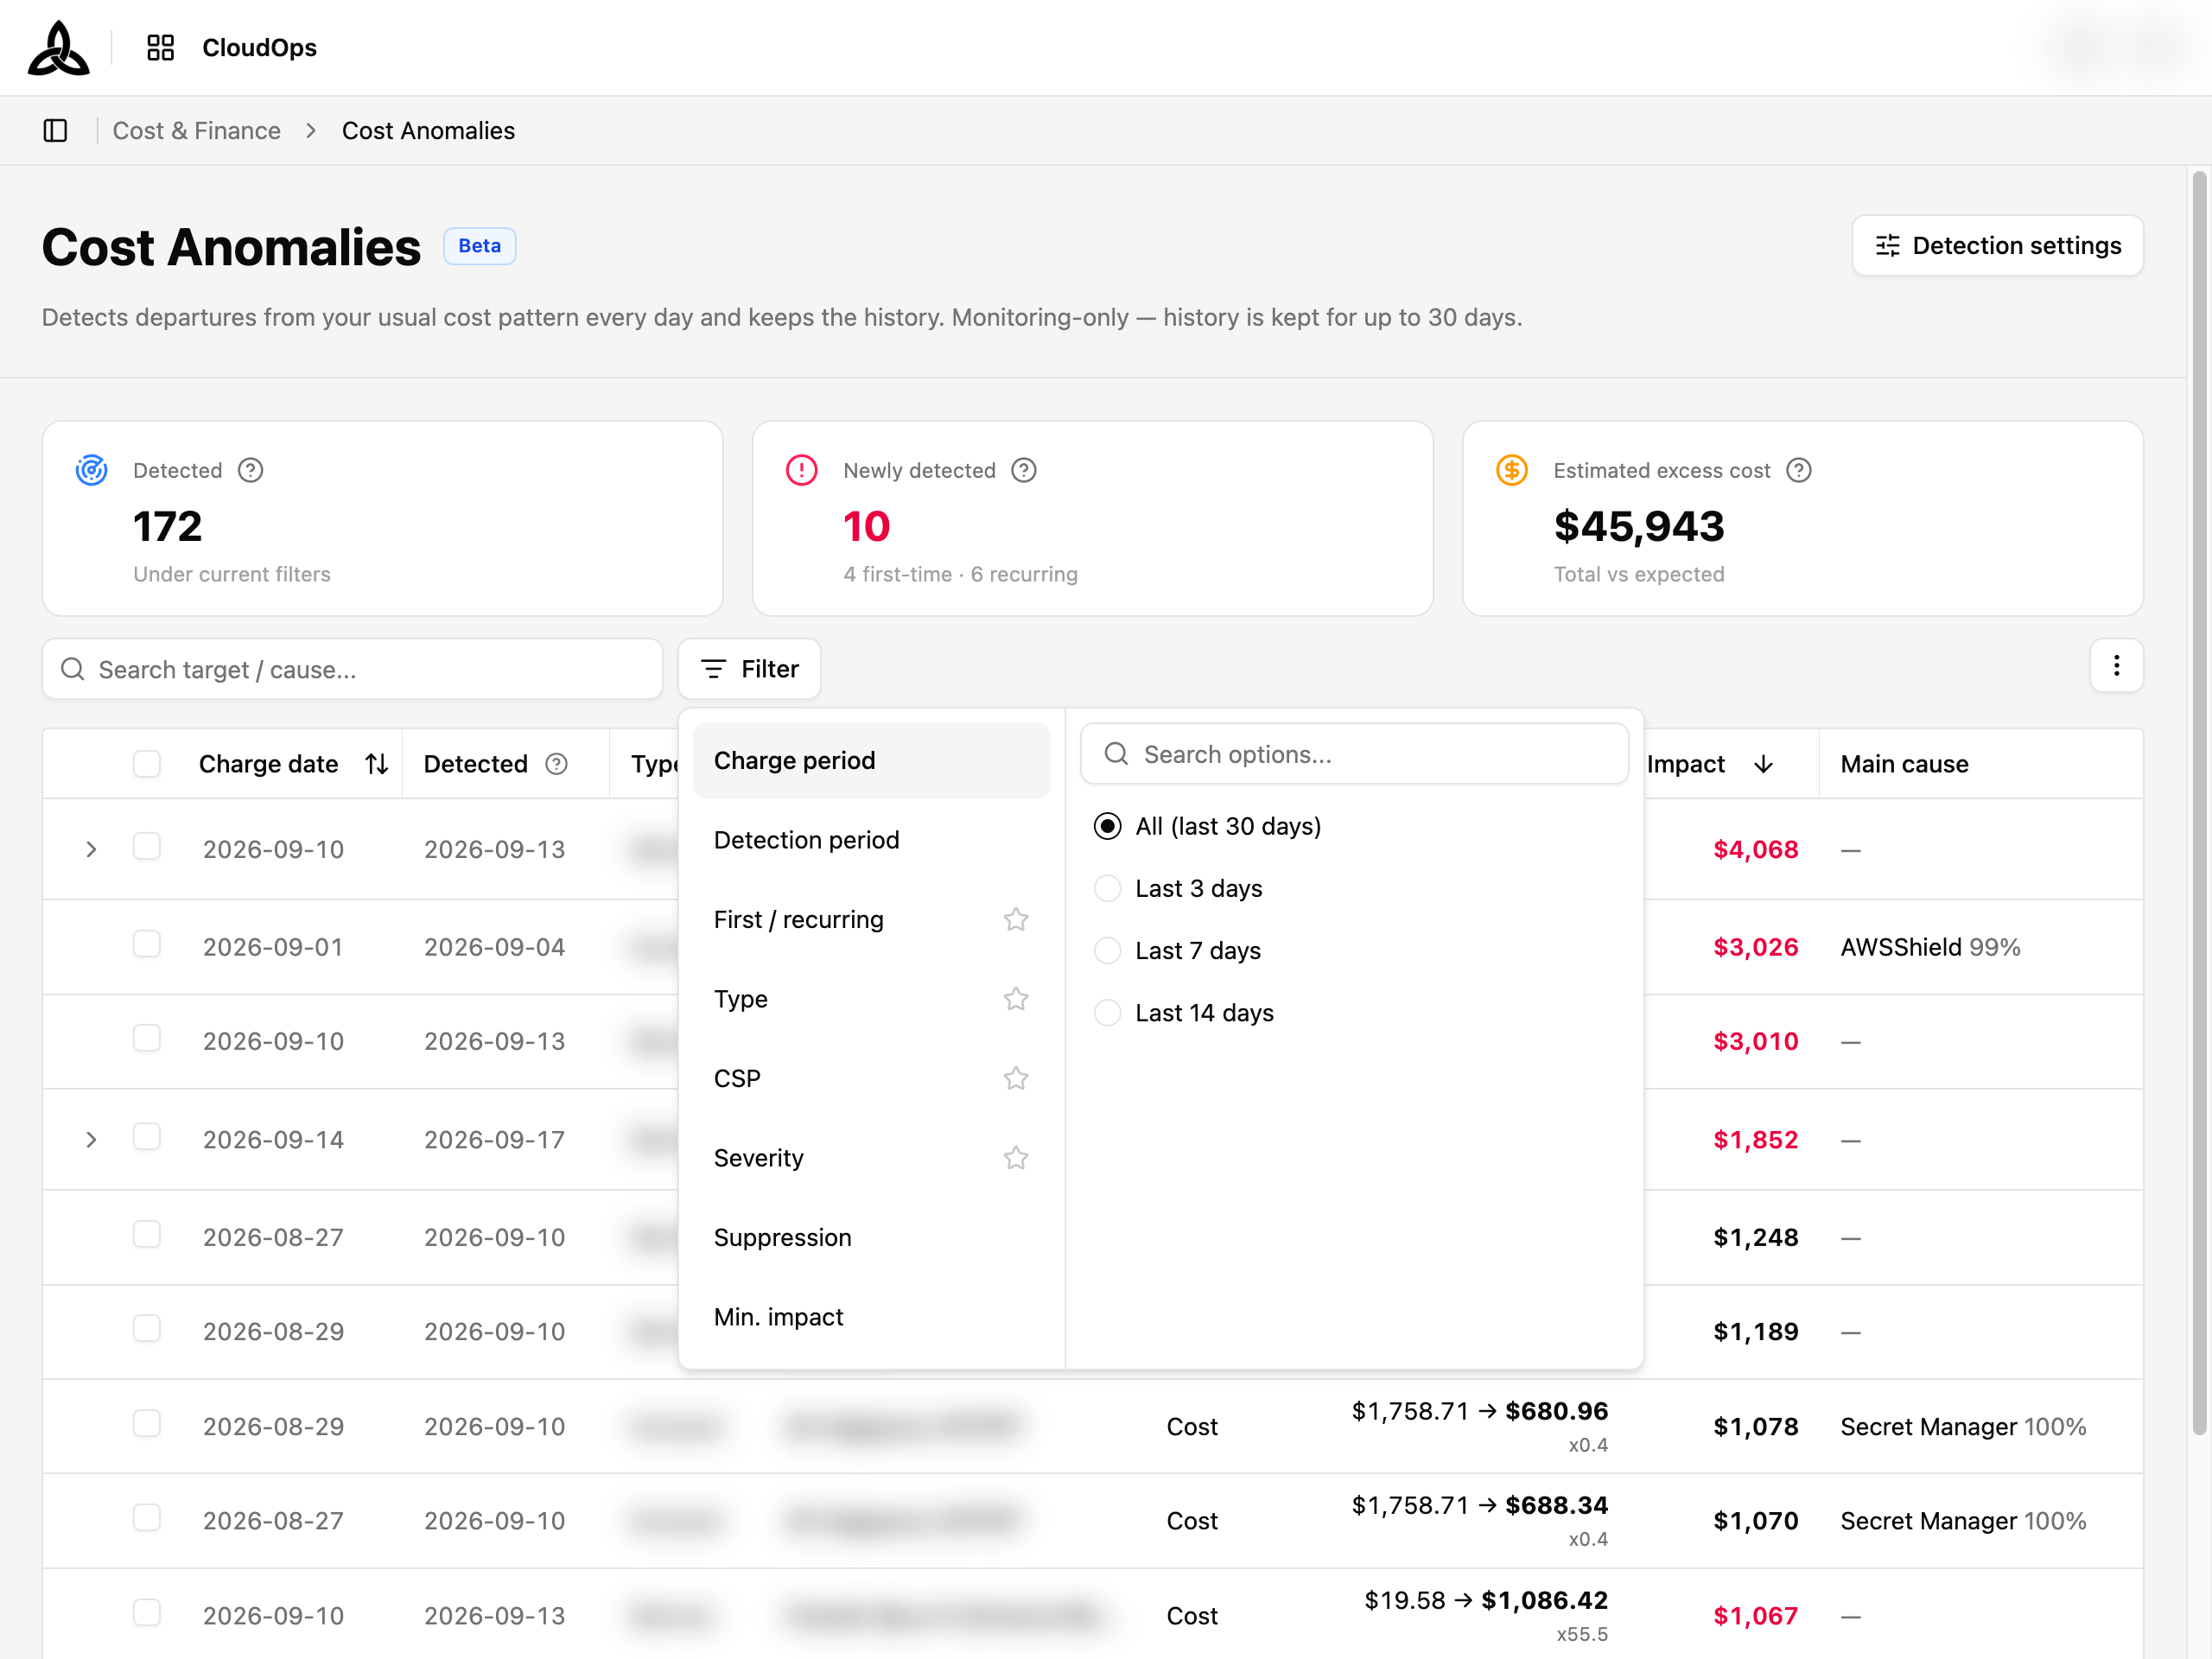
Filter opens a two-pane panel: categories on the left, their options on the right.
| Filter | Narrows by |
|---|---|
| Charge period | When the cost was incurred — all 30 days, or the last 3 / 7 / 14 |
| Detection period | When detection flagged it — all time, or the last 3 / 7 / 14 days |
| First / recurring | Only new anomalies, or only ones carrying over |
| Type | Customer, Organization, Account, App, Service, CSP |
| CSP | Cloud provider |
| Severity | How severe the deviation was |
| Suppression | Hide suppressed (default), Include suppressed, or Suppressed only |
| Min. impact | Hides anomalies whose money impact is below a floor |
The ☆ next to a category pins it, keeping the filters you use often at hand. Min. impact is the quickest way to cut noise — small deviations on small spend are technically anomalies but rarely worth acting on.
Suppressed anomalies
A suppressed anomaly is left out of the list by default and carries a Suppressed badge saying why:
| Reason | Meaning |
|---|---|
| Matched by a suppression rule | An expected recurrence you have already described in the detection settings |
| Suppressed individually | Muted on its own from the anomaly itself |
Use Suppressed only to review what you have muted, or to pick something to un-suppress.
Detection Settings
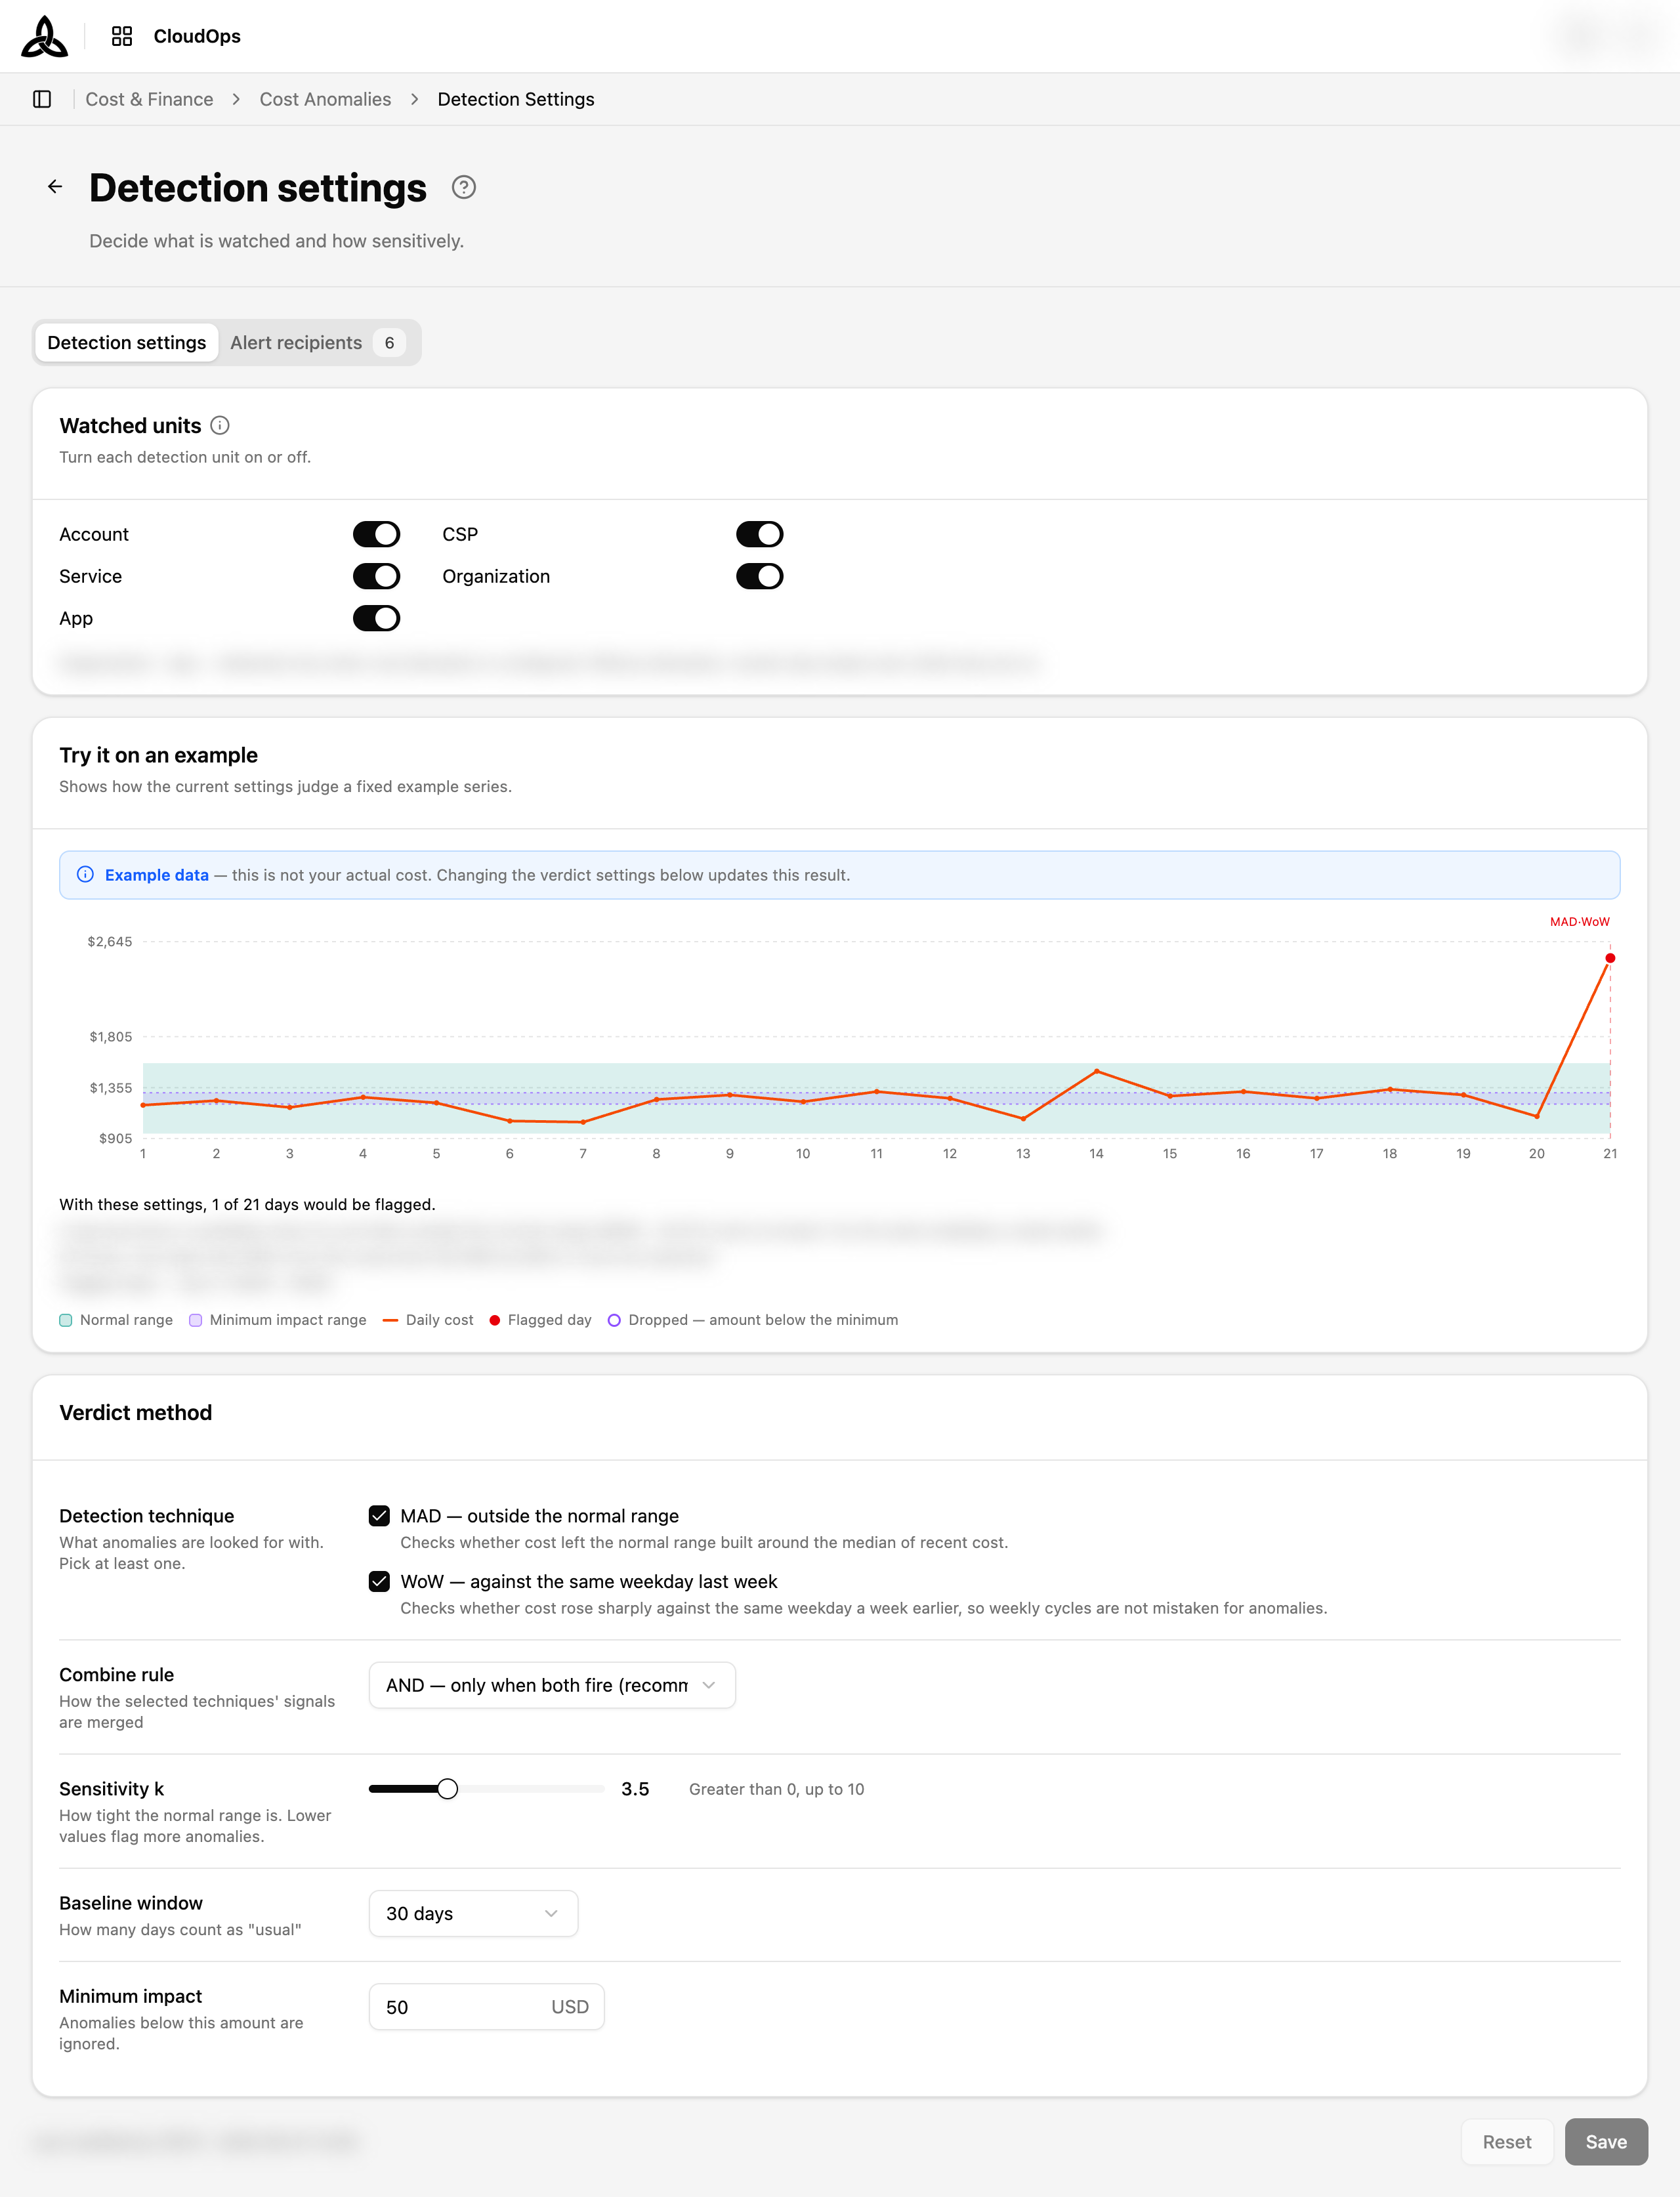
[Detection settings] in the page header opens the screen where you decide what is watched and how sensitively. It is reachable only from here — there is no menu entry for it — and [Back to anomalies] returns you to the list.
Watched units
Five units can be turned on or off independently: Account, CSP, Service, Organization, and App.
Verdict method
| Field | What it does |
|---|---|
| Detection technique | What anomalies are looked for with. Pick at least one — MAD (outside the normal range) and WoW (against the same weekday last week) |
| Combine rule | How the two signals are merged. AND flags only when both fire (recommended); OR flags when either does (sensitive). Unused when only one technique is selected |
| Sensitivity k | How tight the normal range is. Lower flags more. Greater than 0, up to 10 — the default is 3.5 |
| Baseline window | How many recent days count as “usual”. Between 7 and 180 days — the default is 30 |
| Minimum impact | Anomalies whose amount change falls below this are ignored |
Try it on an example
Below the watched units, an example chart shows how the current settings would judge a fixed sample series — how many of its days would be flagged, and which. Changing the verdict settings updates the result immediately, so you can see the effect of a sensitivity change before saving it.
How detection works
The ? beside the settings opens a guide dialog explaining the verdict flow — establish the usual level, derive the normal range, check the signals, then combine and suppress noise — along with a glossary and a short FAQ covering the questions the settings usually raise (why something was not flagged, whether to pick AND or OR, how to choose sensitivity).
Saving
[Save] shows exactly which values are changing before it commits, and [Reset] reverts to the last saved values, discarding unsaved edits. The footer records who last modified the settings and when.
Alert Recipients
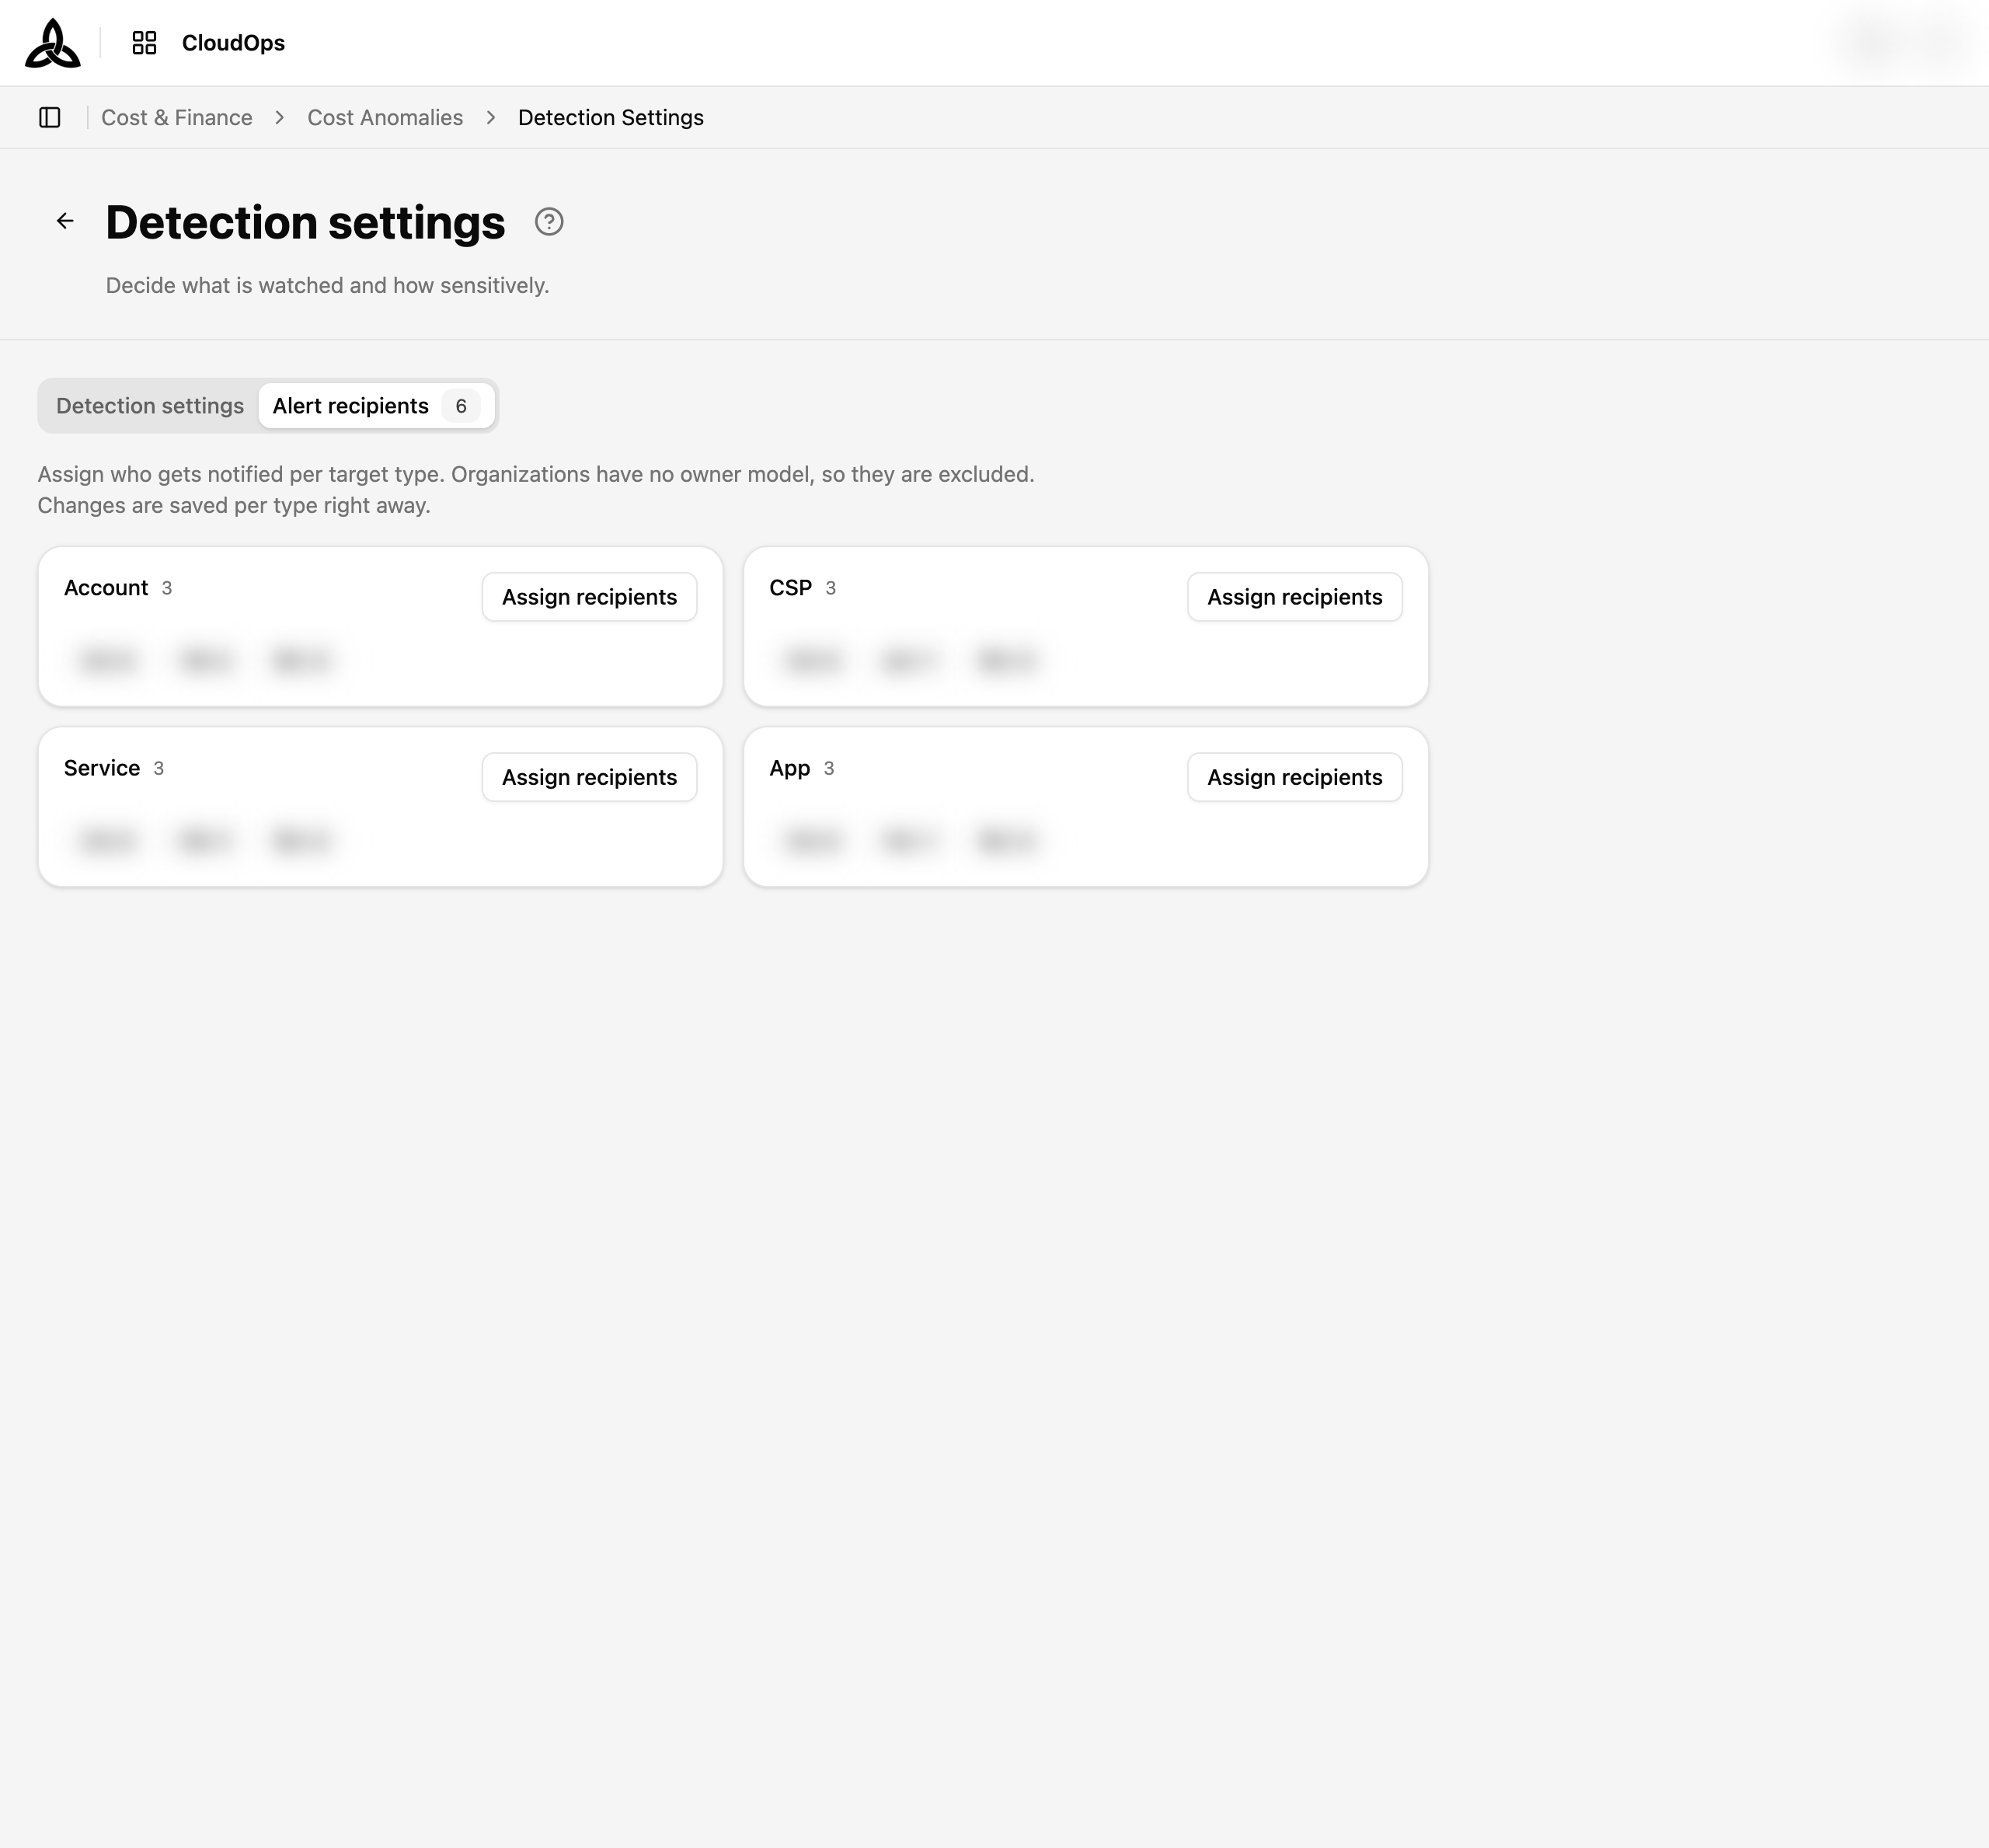
[Alert recipients] sits in the header of the Detection settings screen — not on the anomaly list — and sets who gets notified, per target type — so an account owner is not paged about every service-level blip. Recipients assigned at a higher level are inherited unless you assign someone at the level itself; leaving a level empty keeps the inheritance.
Anomaly Detail
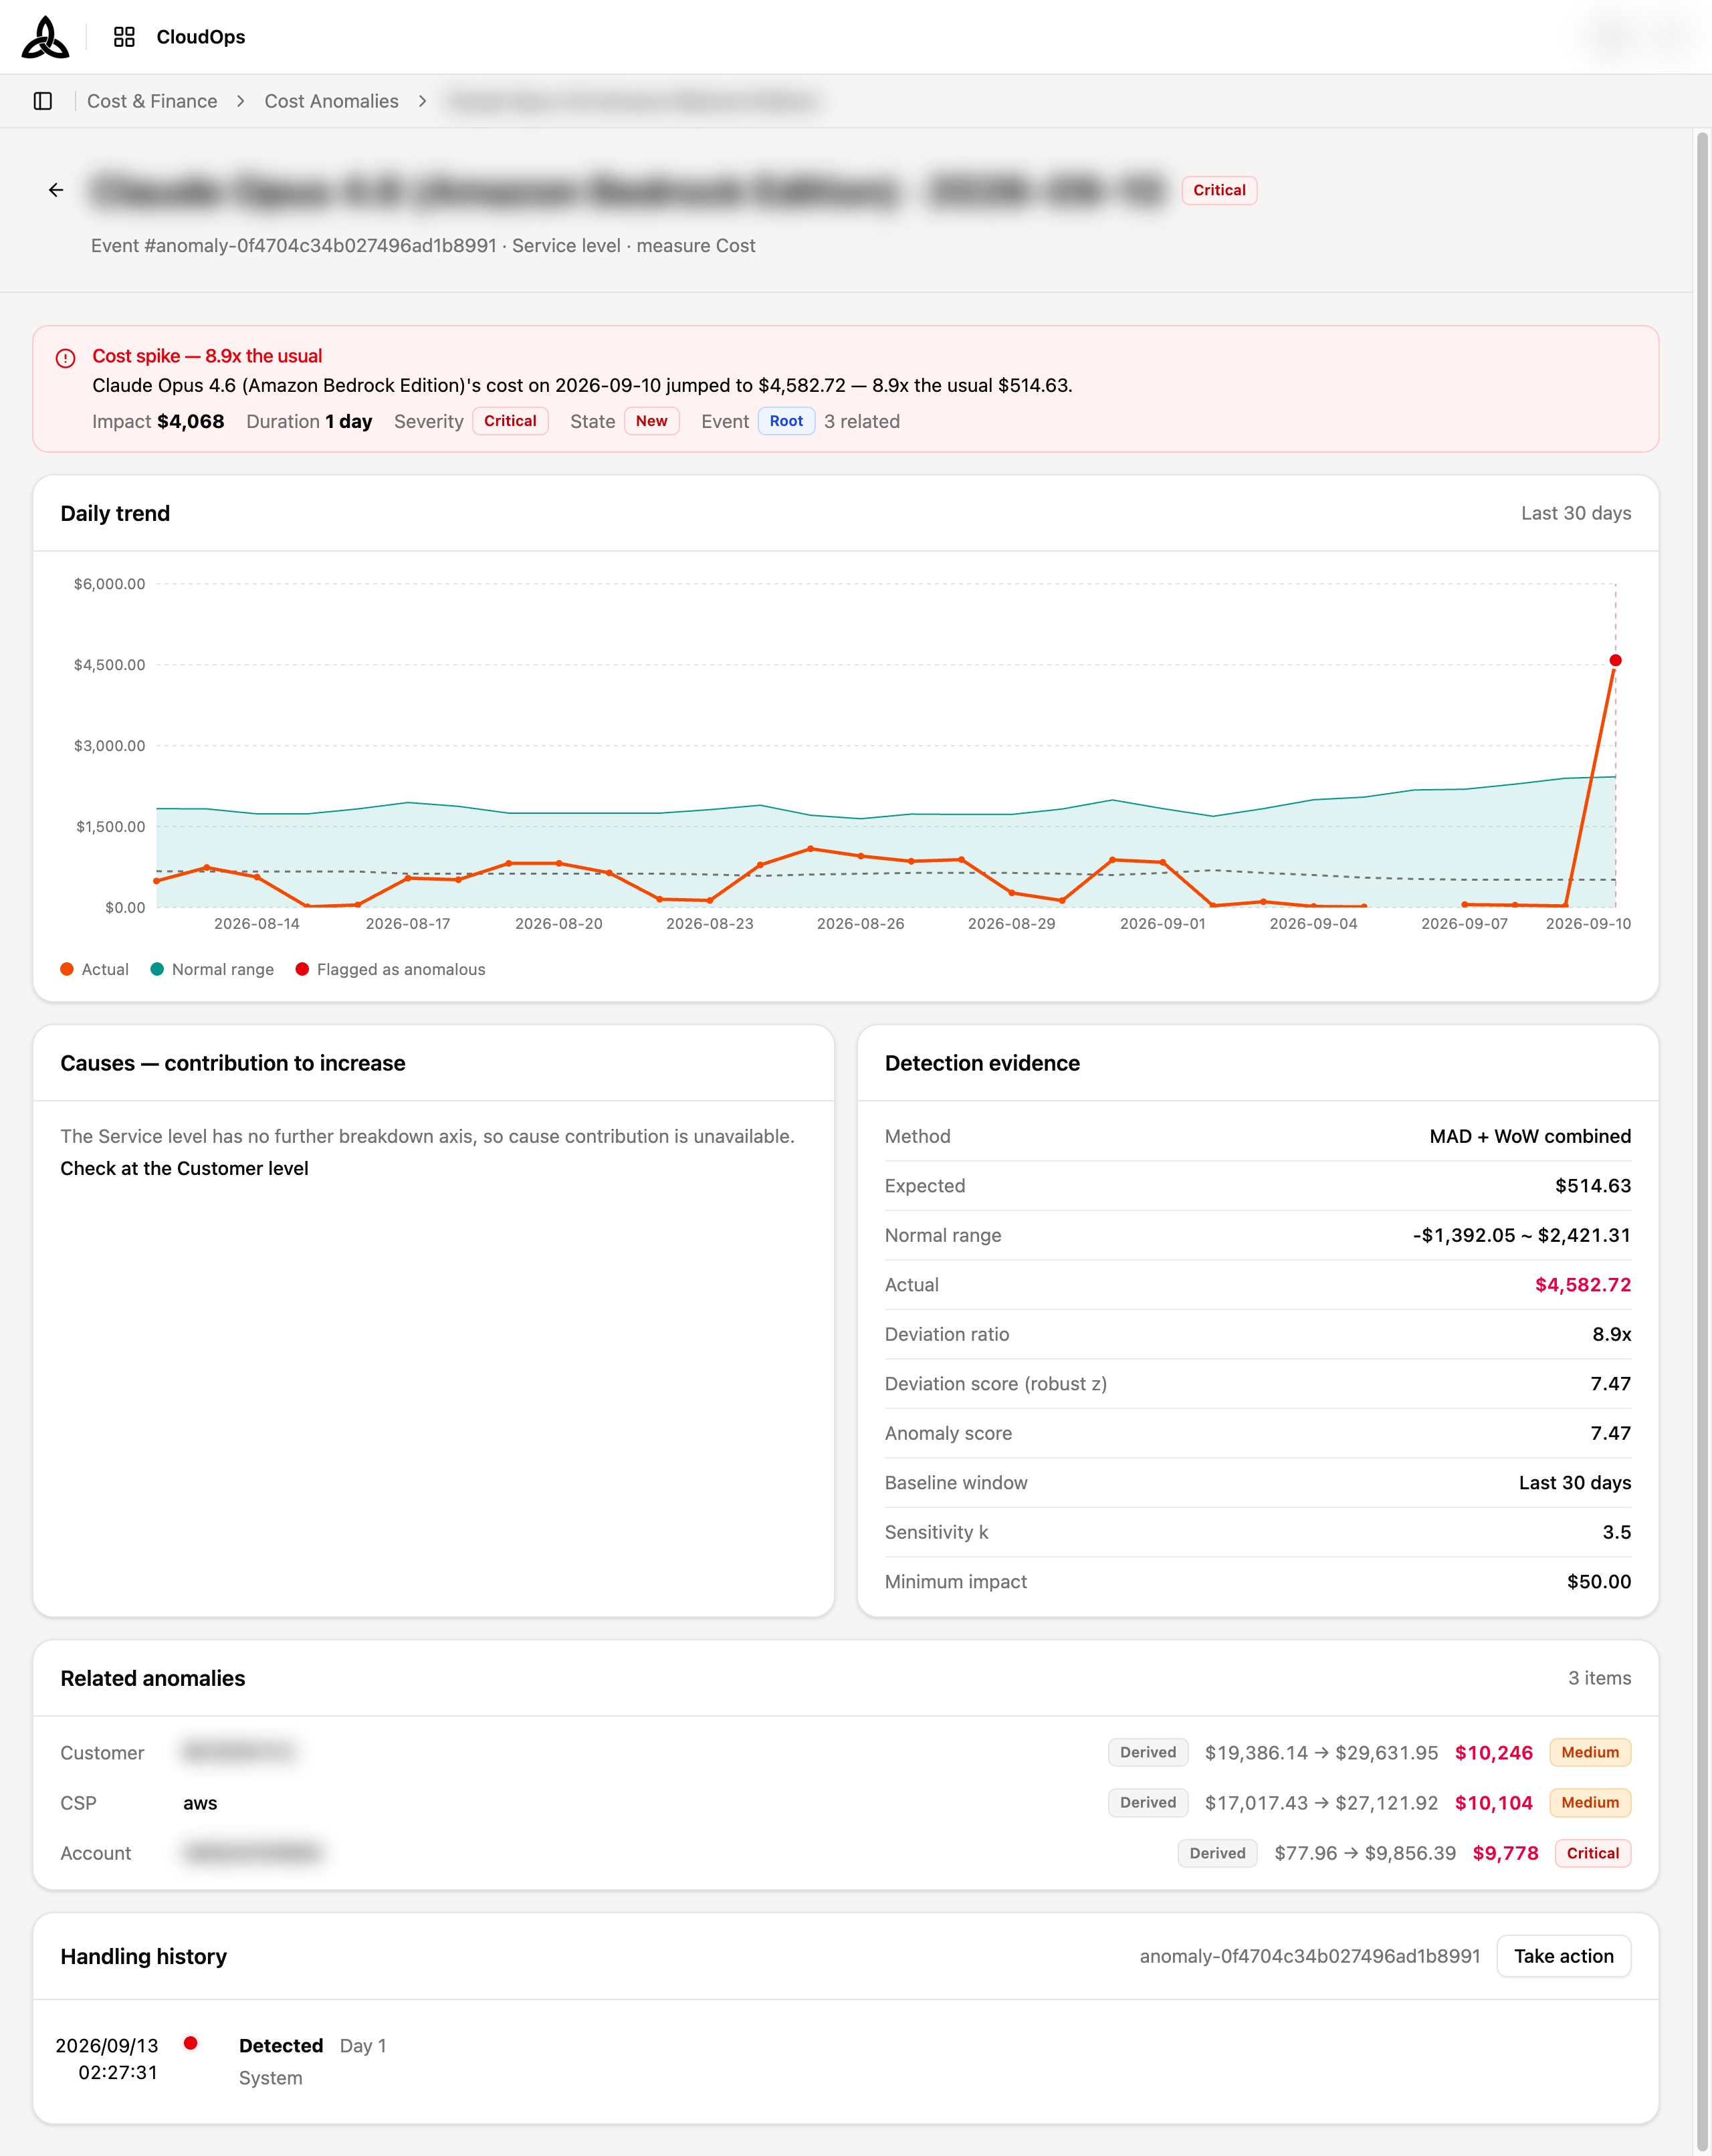
Clicking a row opens the event. The title names the target and the date, and the line beneath gives the event id, the level it was detected at, and the measure.
Summary banner
A one-line verdict — whether cost rose or dropped and by what multiple — followed by a sentence naming the actual figures and the main driver.
Daily trend
The measured cost per day over the baseline window, drawn against the Normal range — the interval CloudOps treated as ordinary. Days that fell outside it are marked as flagged, so the anomaly reads as a departure rather than as a number.
Causes — contribution to increase
The top services ranked by how much of the change each accounts for, in both money and share. This is what the Main cause column summarises in a single line.
Detection evidence
| Item | Meaning |
|---|---|
| Method | How the anomaly was judged — MAD + WoW combined or First seen |
| Expected | The figure the model predicted |
| Normal range | The interval treated as ordinary |
| Actual | What was really spent |
| Deviation ratio | Actual against expected, as a multiple |
| Deviation score / Anomaly score | How far outside the range it fell, in statistical terms |
| Baseline window | The history the expectation was built from |
| Sensitivity k / Minimum impact | The settings as they were at detection time |
Related anomalies
The same incident seen at other levels, each with its own expected → actual figures. The row marked Root is the one CloudOps treats as the origin.
Handling history

A timeline of the whole episode, not just the latest state — every detection round and every user action in order:
| Entry | Meaning |
|---|---|
| Detected | The first round that flagged this target |
| Re-detected | A later round that flagged it again, labelled with which day of the episode it is |
| Detection feedback | Someone marked it a True positive or False positive |
| Action | A state change, with the note left at the time |
[Take action] records feedback and a note in one step. When an anomaly has related anomalies you can choose whether the same action lands on them too — left off, the feedback applies to this anomaly alone.