Cost Analysis
On the [Cost Explorer > Cost Analysis] page, you can analyze cloud costs by provider, granularity, and time period with flexible grouping options.

Filtering Cost Data
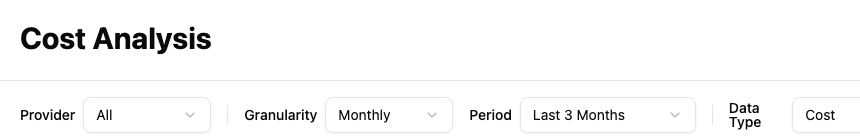
The Cost Analysis page provides several dropdown filters at the top to refine your cost view.
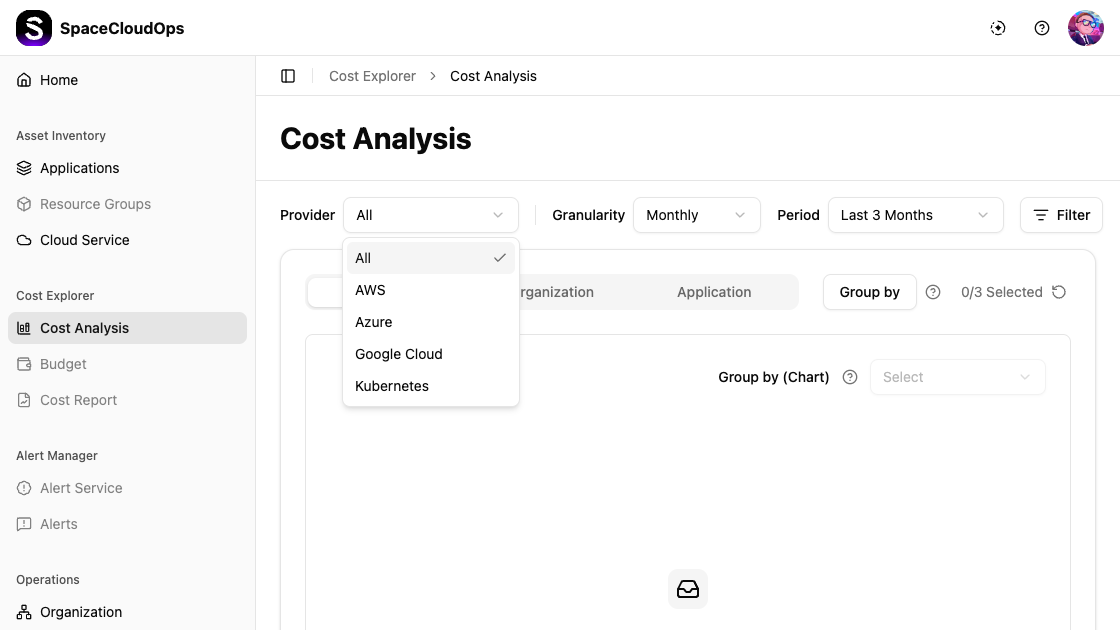
Provider
Select a cloud provider to filter costs.
| Option | Description |
|---|---|
| All | Show costs from all providers (default) |
| AWS | Show AWS costs only |
| Azure | Show Azure costs only |
| Google Cloud | Show Google Cloud costs only |
| Kubernetes | Show Kubernetes costs only |
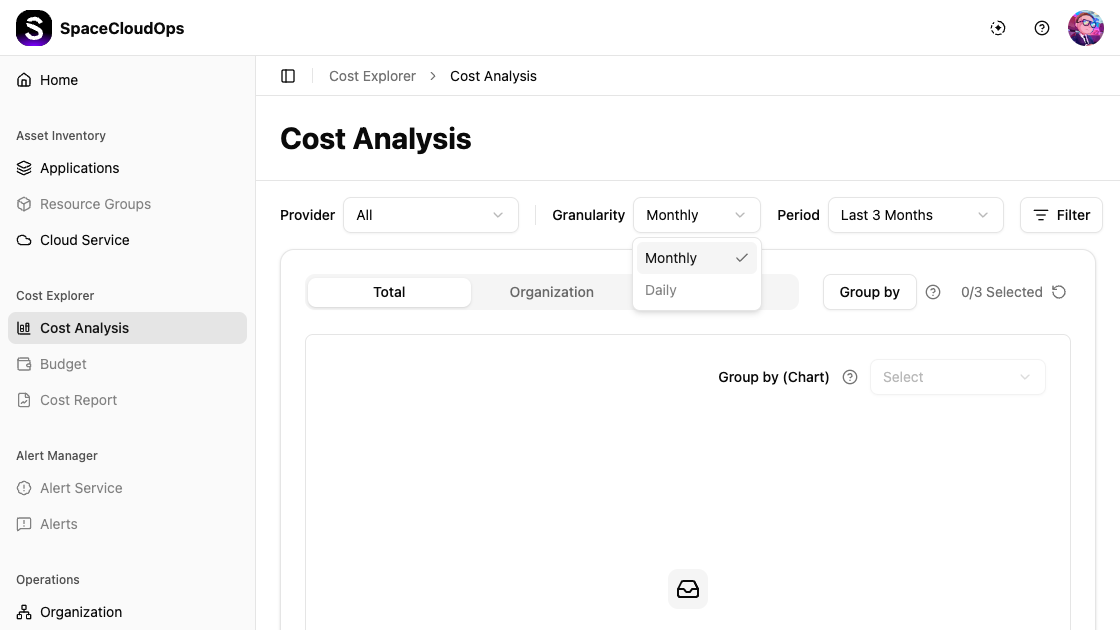
Granularity
Choose the time granularity for cost aggregation.
| Option | Description |
|---|---|
| Monthly | Aggregate costs by month (default) |
| Daily | Aggregate costs by day (only available when a specific provider is selected) |
Period
Set the time range for analysis.

| Option | Description |
|---|---|
| Last 1 Month | Show costs for the last 1 month |
| Last 3 Months | Show costs for the last 3 months (default) |
| Last 6 Months | Show costs for the last 6 months |
| Last 12 Months | Show costs for the last 12 months |
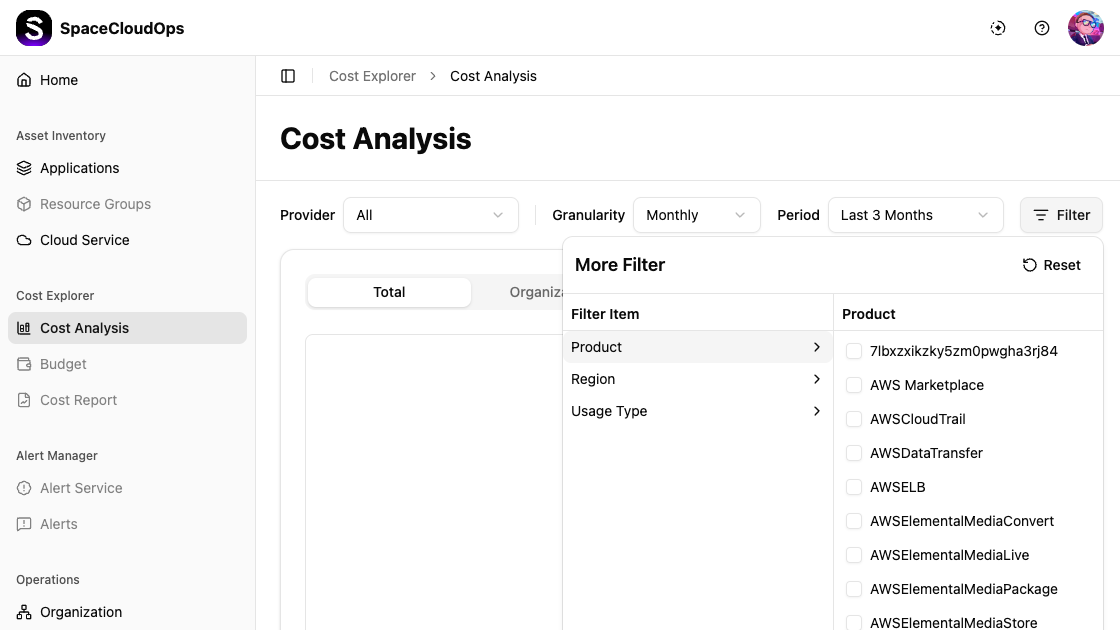
More Filter
Click the [Filter] button to open the More Filter panel for advanced filtering. The panel has a two-column layout:
| Filter Item | Description |
|---|---|
| Product | Filter by specific cloud product/service (e.g., AWSCloudTrail, AWSELB) |
| Region | Filter by cloud region |
| Usage Type | Filter by usage type |
Select a filter item on the left to display its available values on the right. Check the desired values to apply the filter. Click [Reset] to clear all filters. Active filters are indicated by a badge on the Filter button.
Viewing Cost Data by Tab
Cost data can be viewed from different perspectives using the tabs below the filters:
| Tab | Description |
|---|---|
| Total | View aggregated cost data across all dimensions |
| Organization | View costs broken down by organizational units |
| Application | View costs broken down by applications |


When cost data is available, each tab displays a chart area showing cost trends over the selected period, and a data table below the chart with detailed cost breakdowns.
Grouping Cost Data
Group by (Table)
Click the [Group by] button to organize cost data in the table by up to 3 criteria.

| Option | Description |
|---|---|
| Product | Group costs by cloud product/service |
| Region | Group costs by region |
| Usage Type | Group costs by usage type |
Select up to 3 grouping criteria (displayed as 0/3 Selected). Click the reset icon to clear selections. When grouping is applied, the chart displays stacked bars and the table shows rows for each group value.
Group by (Chart)
Use the Group by (Chart) dropdown to select which grouping dimension to visualize in the chart. The chart shows the selected dimension as stacked bars, while the table displays all selected dimensions.
Cost Chart
The chart area displays cost data as a bar chart:
| View | Description |
|---|---|
| Total view (no grouping) | Single-color bars showing total cost per period |
| Grouped view | Stacked bars with different colors for each group value. A legend below the chart identifies each group |
Hover over a bar segment to see the exact cost value in a tooltip.
Cost Table
The table below the chart displays detailed cost figures.
| View | Columns |
|---|---|
| Total view | A single “Total Cost” row with cost values for each time period |
| Grouped view | Group dimension columns (e.g., Product, Region) plus date columns with cost for each period. A footer row shows column totals |
Table Toolbar
| Action | Description |
|---|---|
| Original Data | Toggle switch to show full decimal values instead of compact notation |
| Export | Download the cost data as a file |
| Refresh | Reload the cost data |
| Pagination | Navigate between pages when results exceed the page limit |