AI Management
On the [AI Asset > AI Management] page, you register the AI assets you want to watch and manage the monitoring rules that decide when their usage counts as an anomaly. This is the inventory-and-setup side of AI Asset — the anomalies themselves are triaged under AI Monitoring.
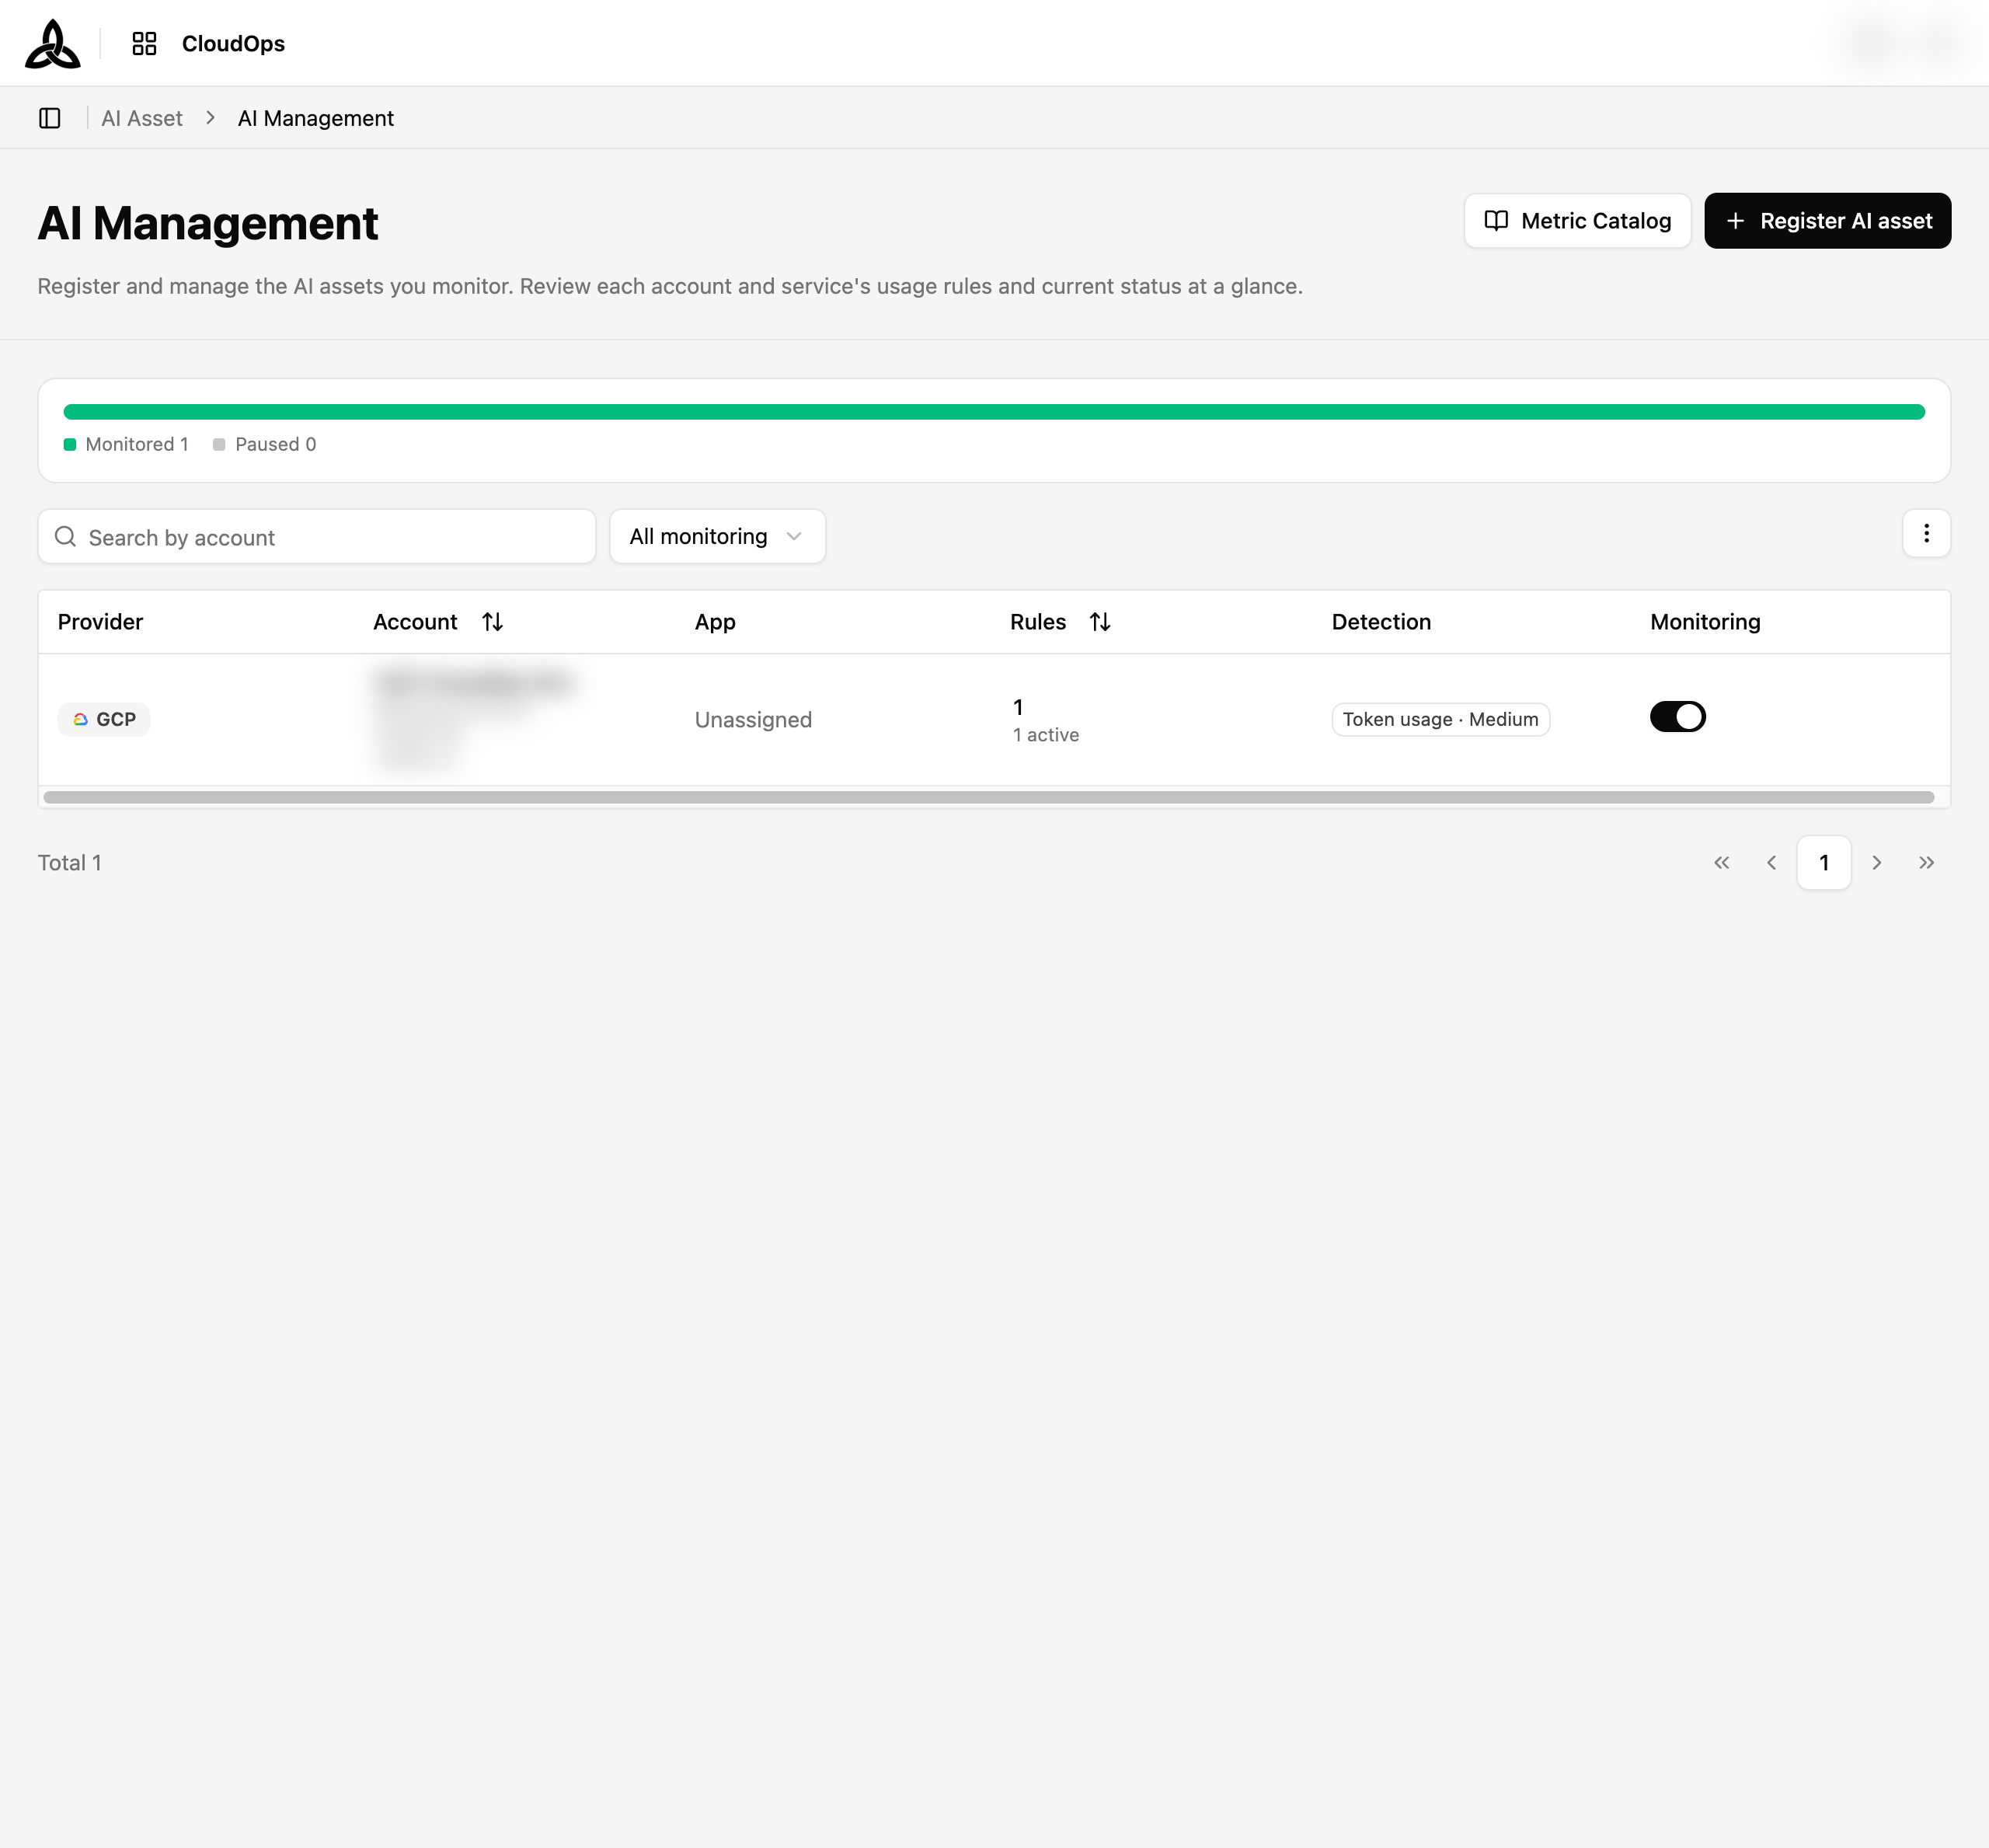
Coverage Bar
The bar above the table answers one question: is there a hole in my monitoring?
| Element | Meaning |
|---|---|
| Monitored | Assets with monitoring switched on. Click it to filter the table down to those |
| Paused | Assets with monitoring switched off. Click it to filter the table |
| Blind-spot warning | Appears only when an asset is switched on but has no active rule — it looks monitored while nothing is actually being evaluated |
| Firing alert | Appears only while an anomaly is firing, and links straight to the AI Monitoring board |
The last two are adaptive: they stay hidden when there is nothing to report, so anything showing there is worth acting on.
Viewing

Search matches the account. The dropdown next to it filters by monitoring state (all / on / off), and the ⋮ button on the right opens column and page-size settings.
| Column | Description |
|---|---|
| Provider | Cloud provider the asset belongs to |
| Account | Cloud account being watched, shown by name rather than its raw account id |
| App | Application the asset is assigned to, shown by name, or Unassigned |
| Rules | How many monitoring rules exist, and how many are active |
| Detection | Each rule as a chip, written metric · sensitivity — for example Token usage · Medium. A +N more chip stands in when an asset carries several rules |
| Monitoring | Switch that turns monitoring on or off for that asset |
The Monitoring switch takes effect immediately, with no confirmation dialog. Turning it off pauses evaluation but keeps the asset and its rules intact.
The leading columns stay in place while you scroll the table sideways, so an asset’s identity does not scroll away from the values you are reading.
Metric Catalog
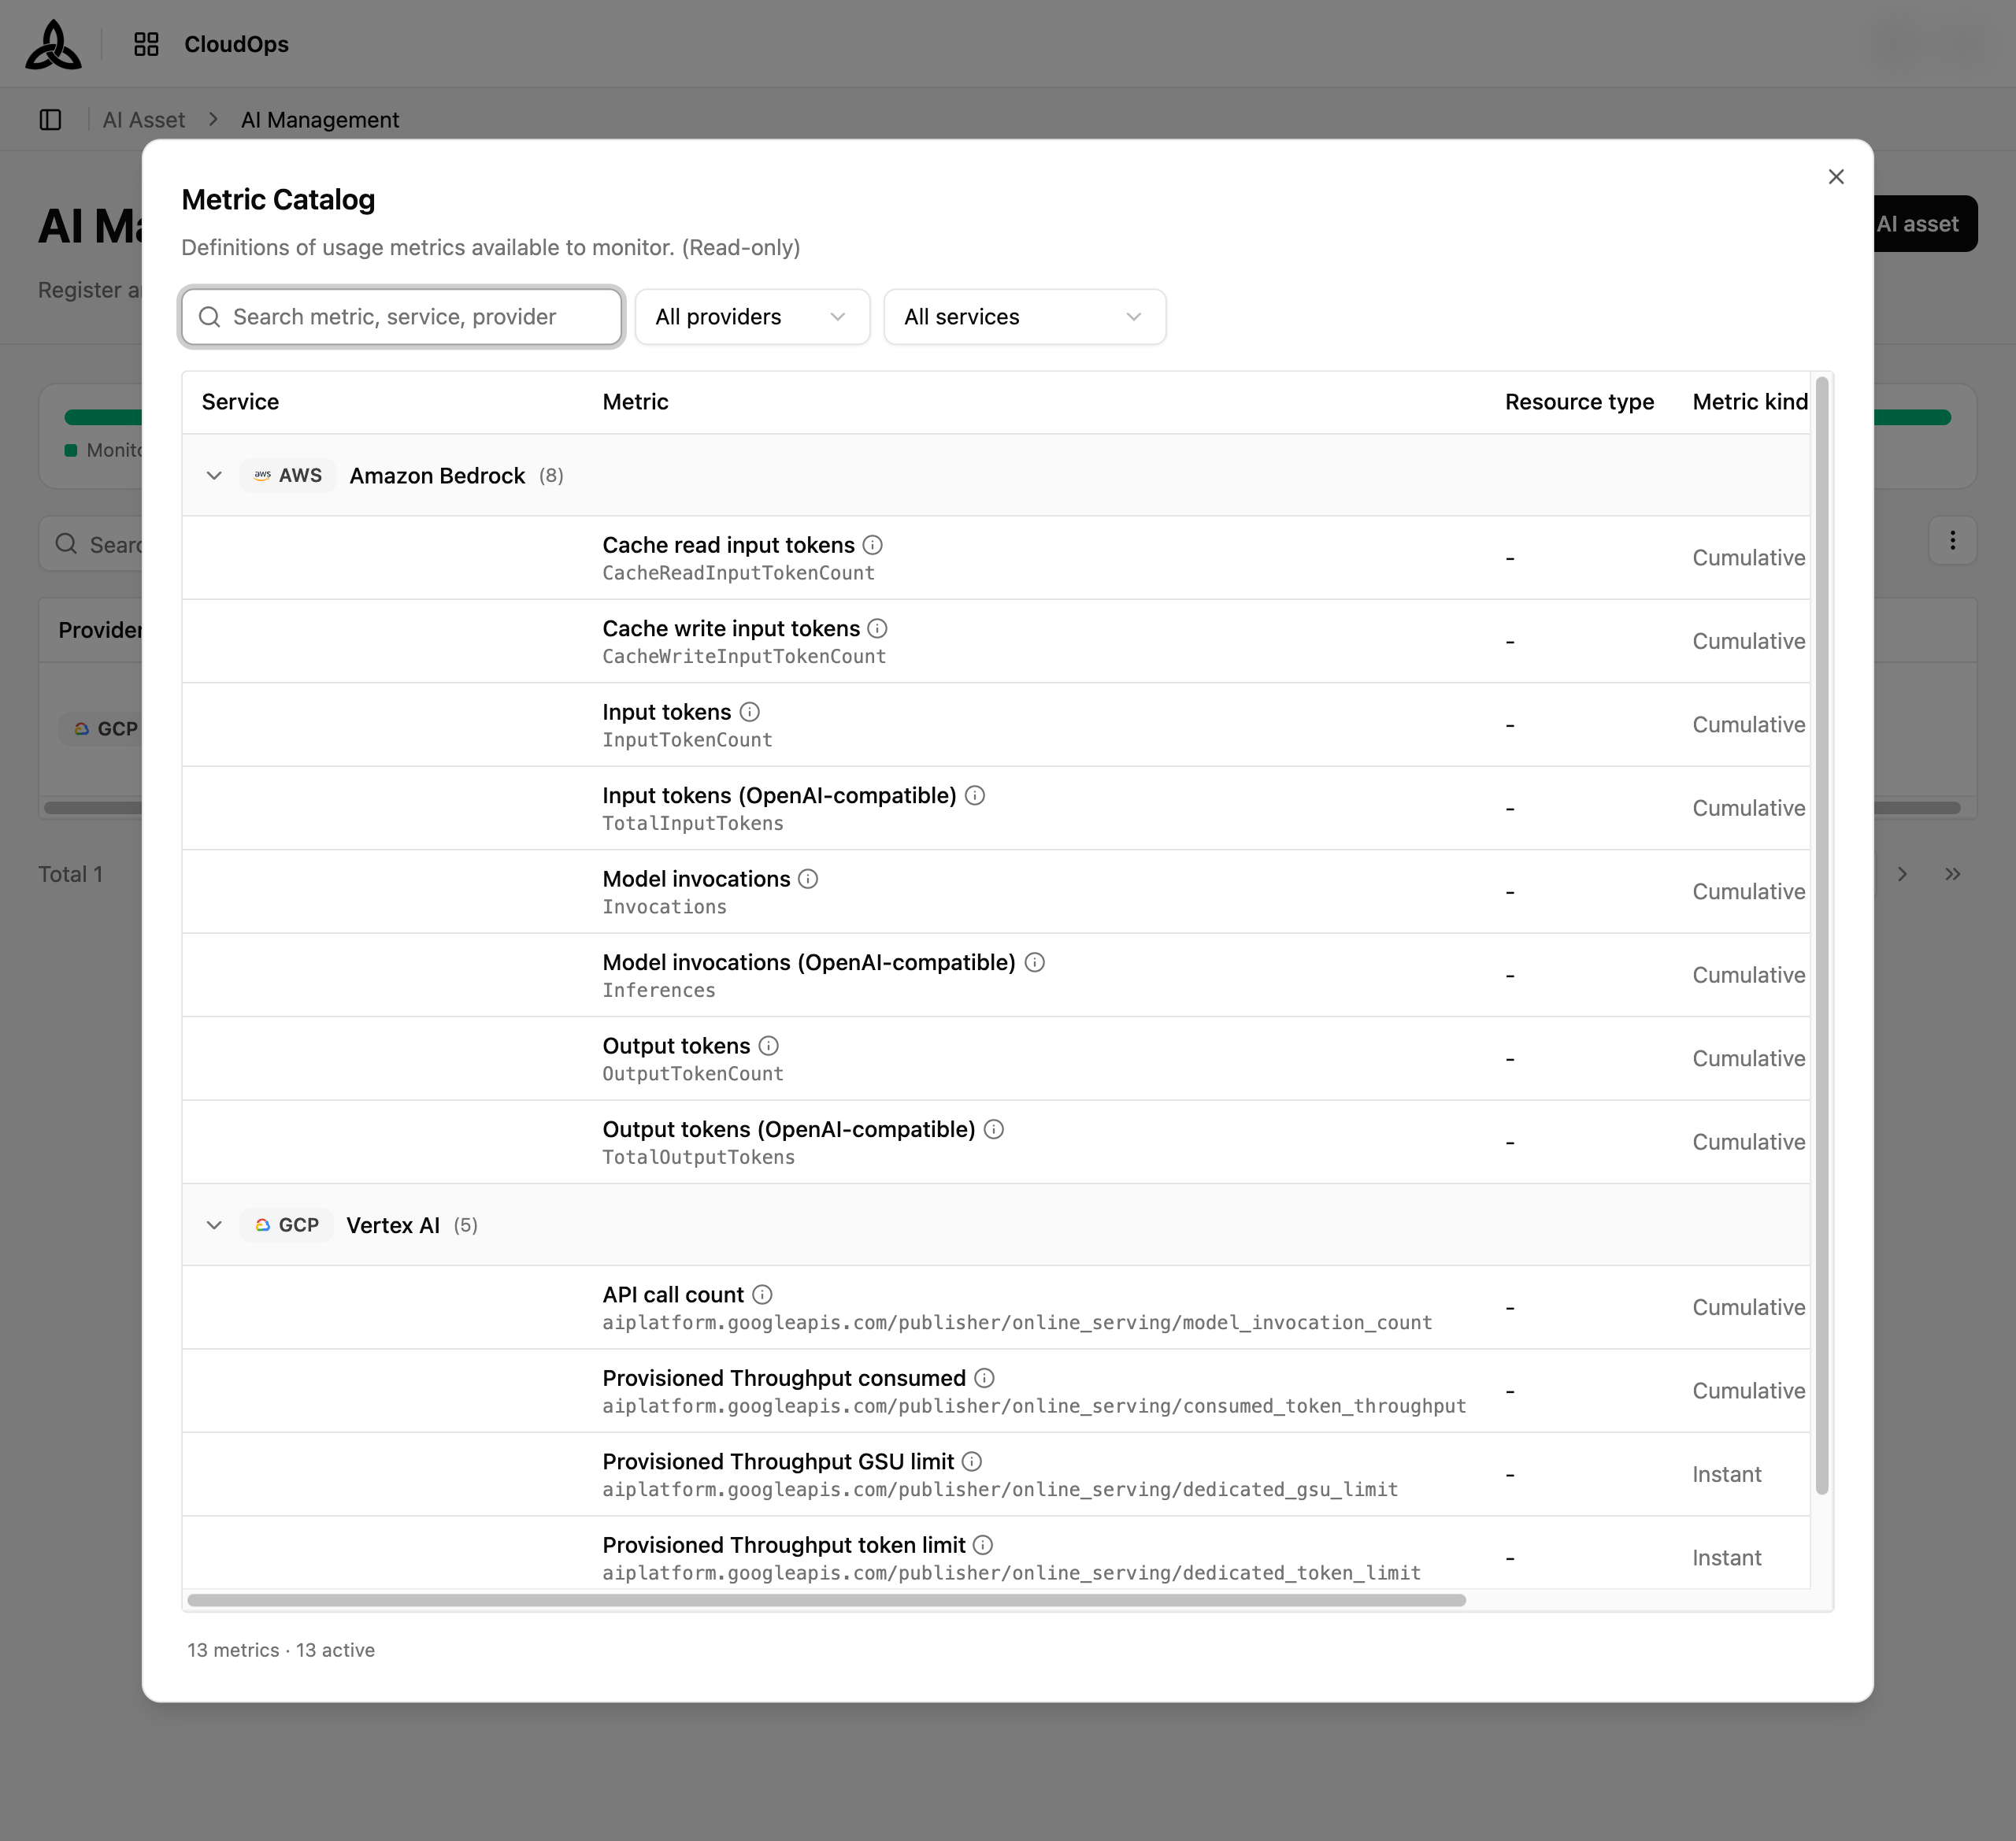
Metric Catalog lists the usage metrics available to monitor, with the provider metric each one maps to. It is read-only reference material — you cannot add a metric here, only look up what a rule can watch. It is reachable both from this page’s header and from an asset’s Rules tab.
Search covers metric, service, and provider at once, and Provider and Service narrow the list. The heading counts both what exists and what is live — 84 metrics · 61 active.
Asset Detail
Clicking a row opens the asset. The header carries the asset’s status, its AI service, provider, and assigned App; the ⋮ menu holds Delete AI resource.
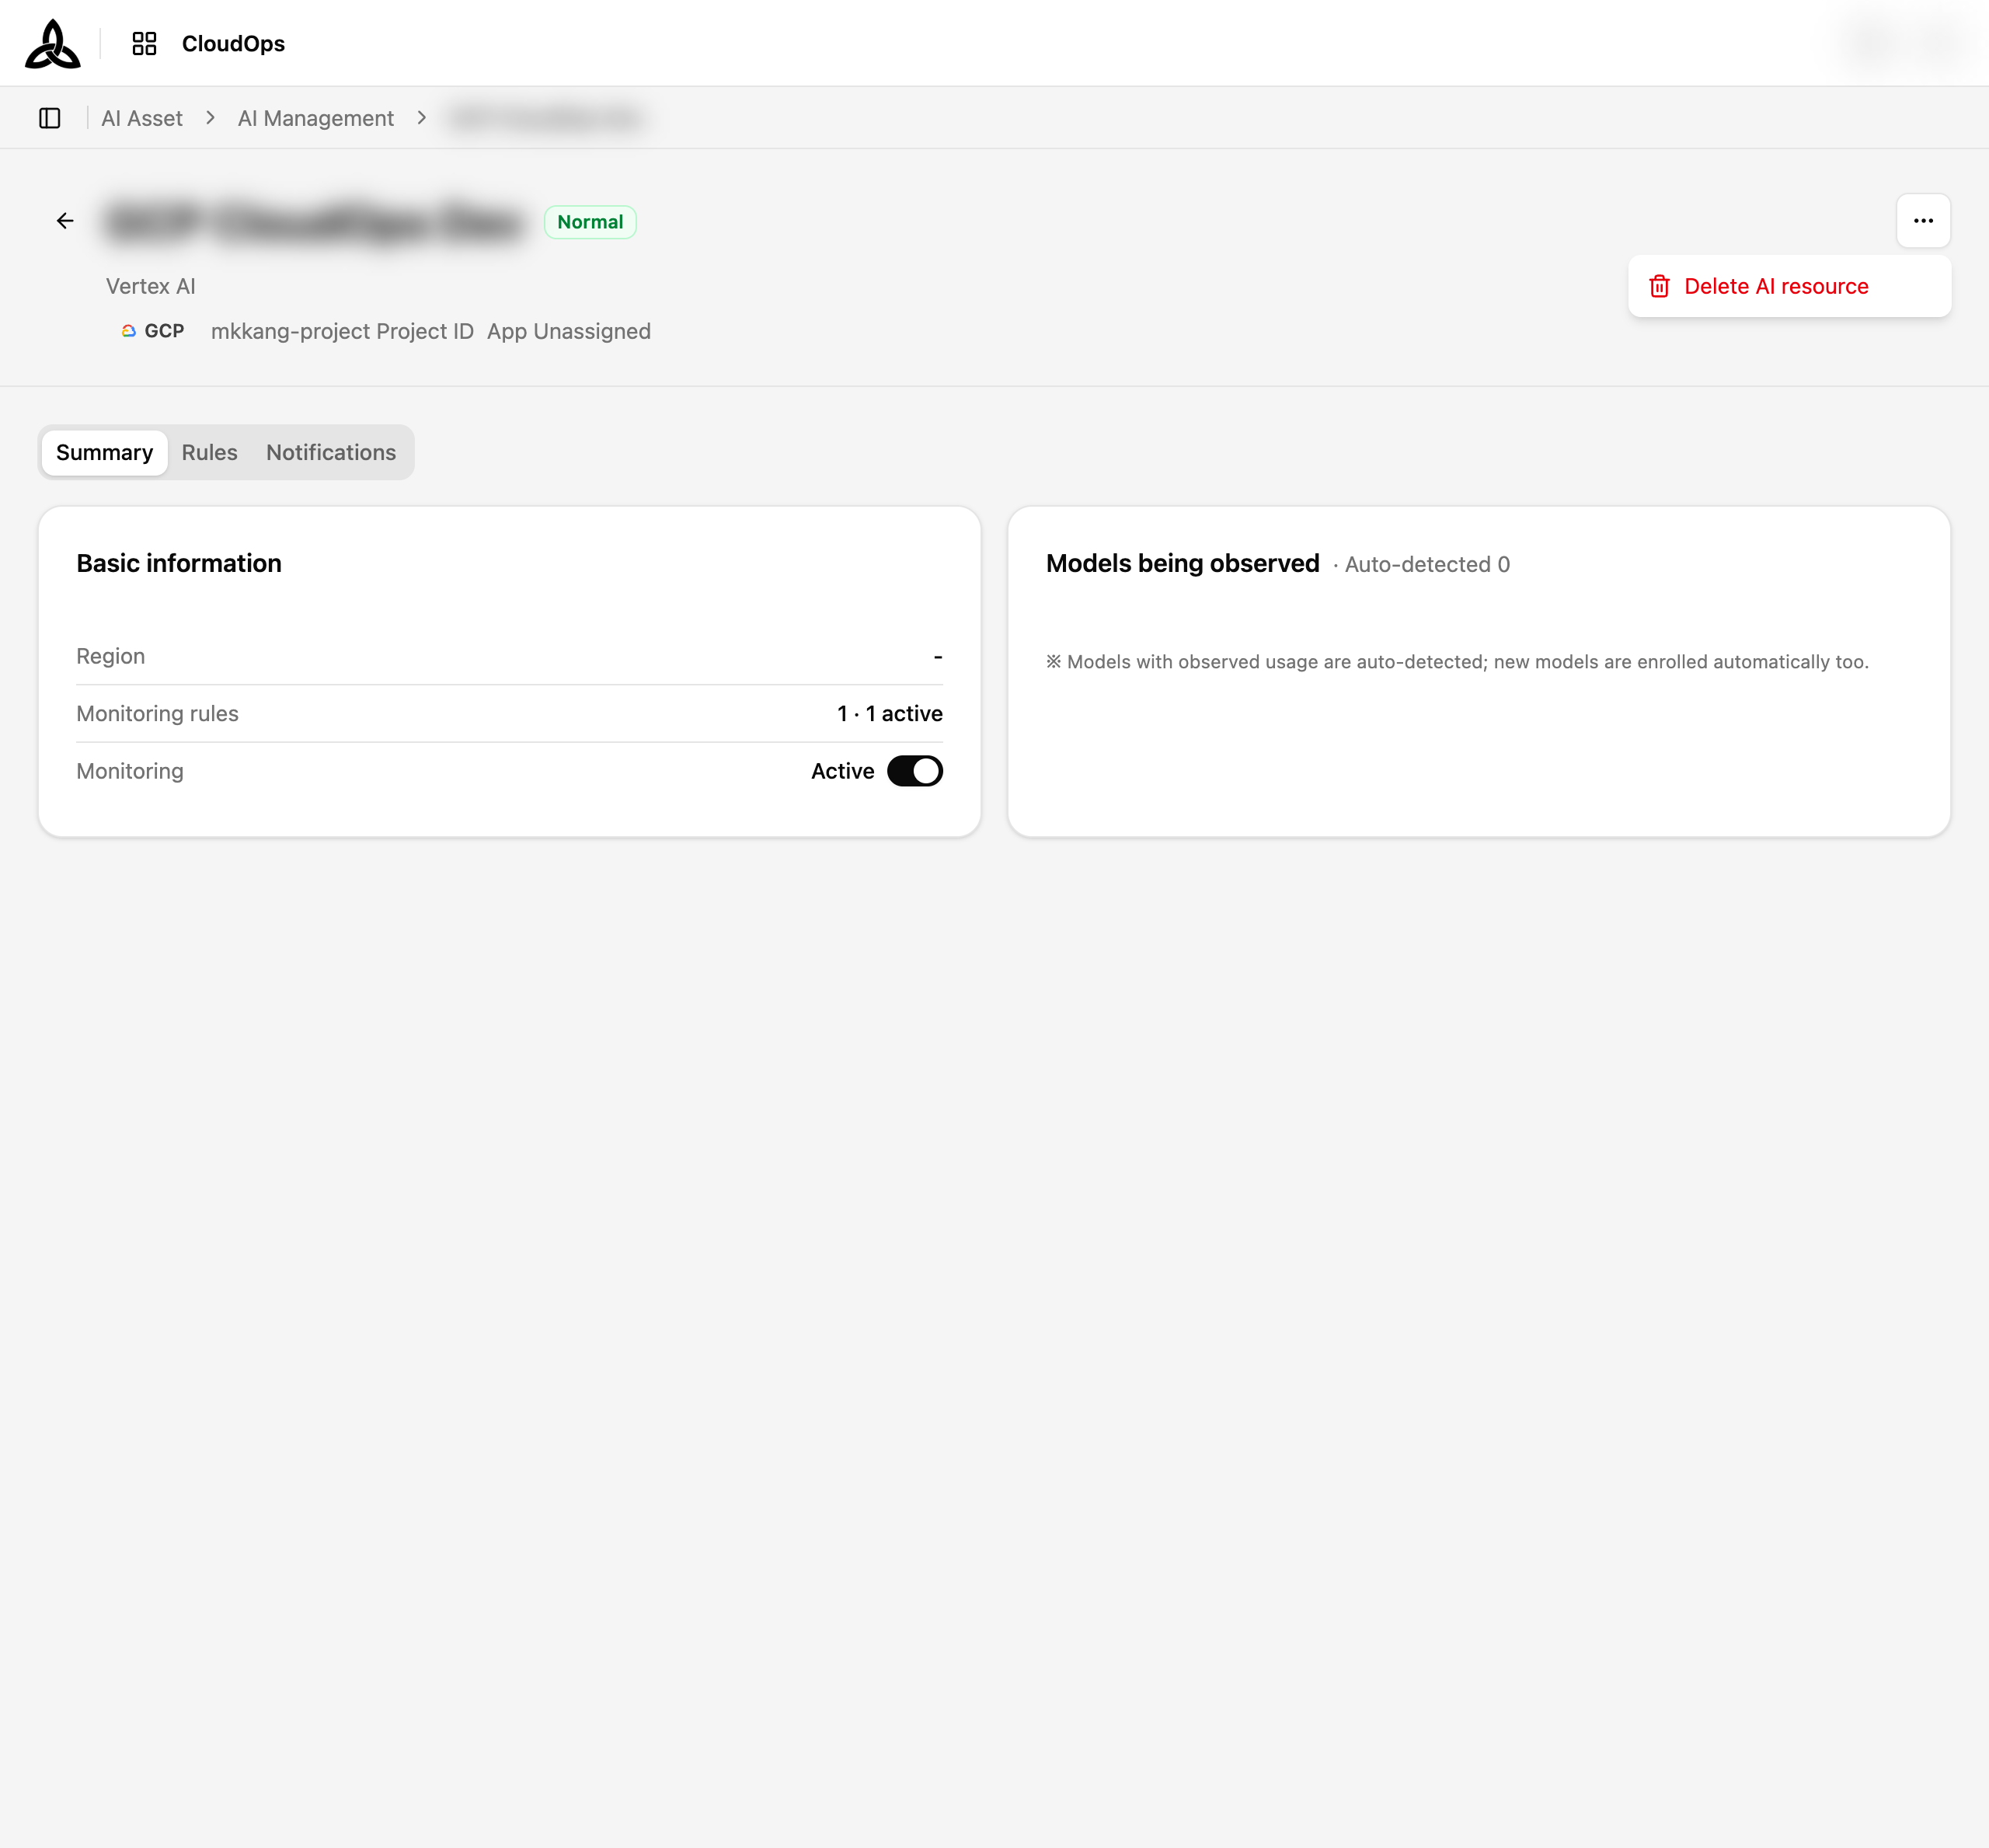
The detail page has three tabs.
Summary Tab
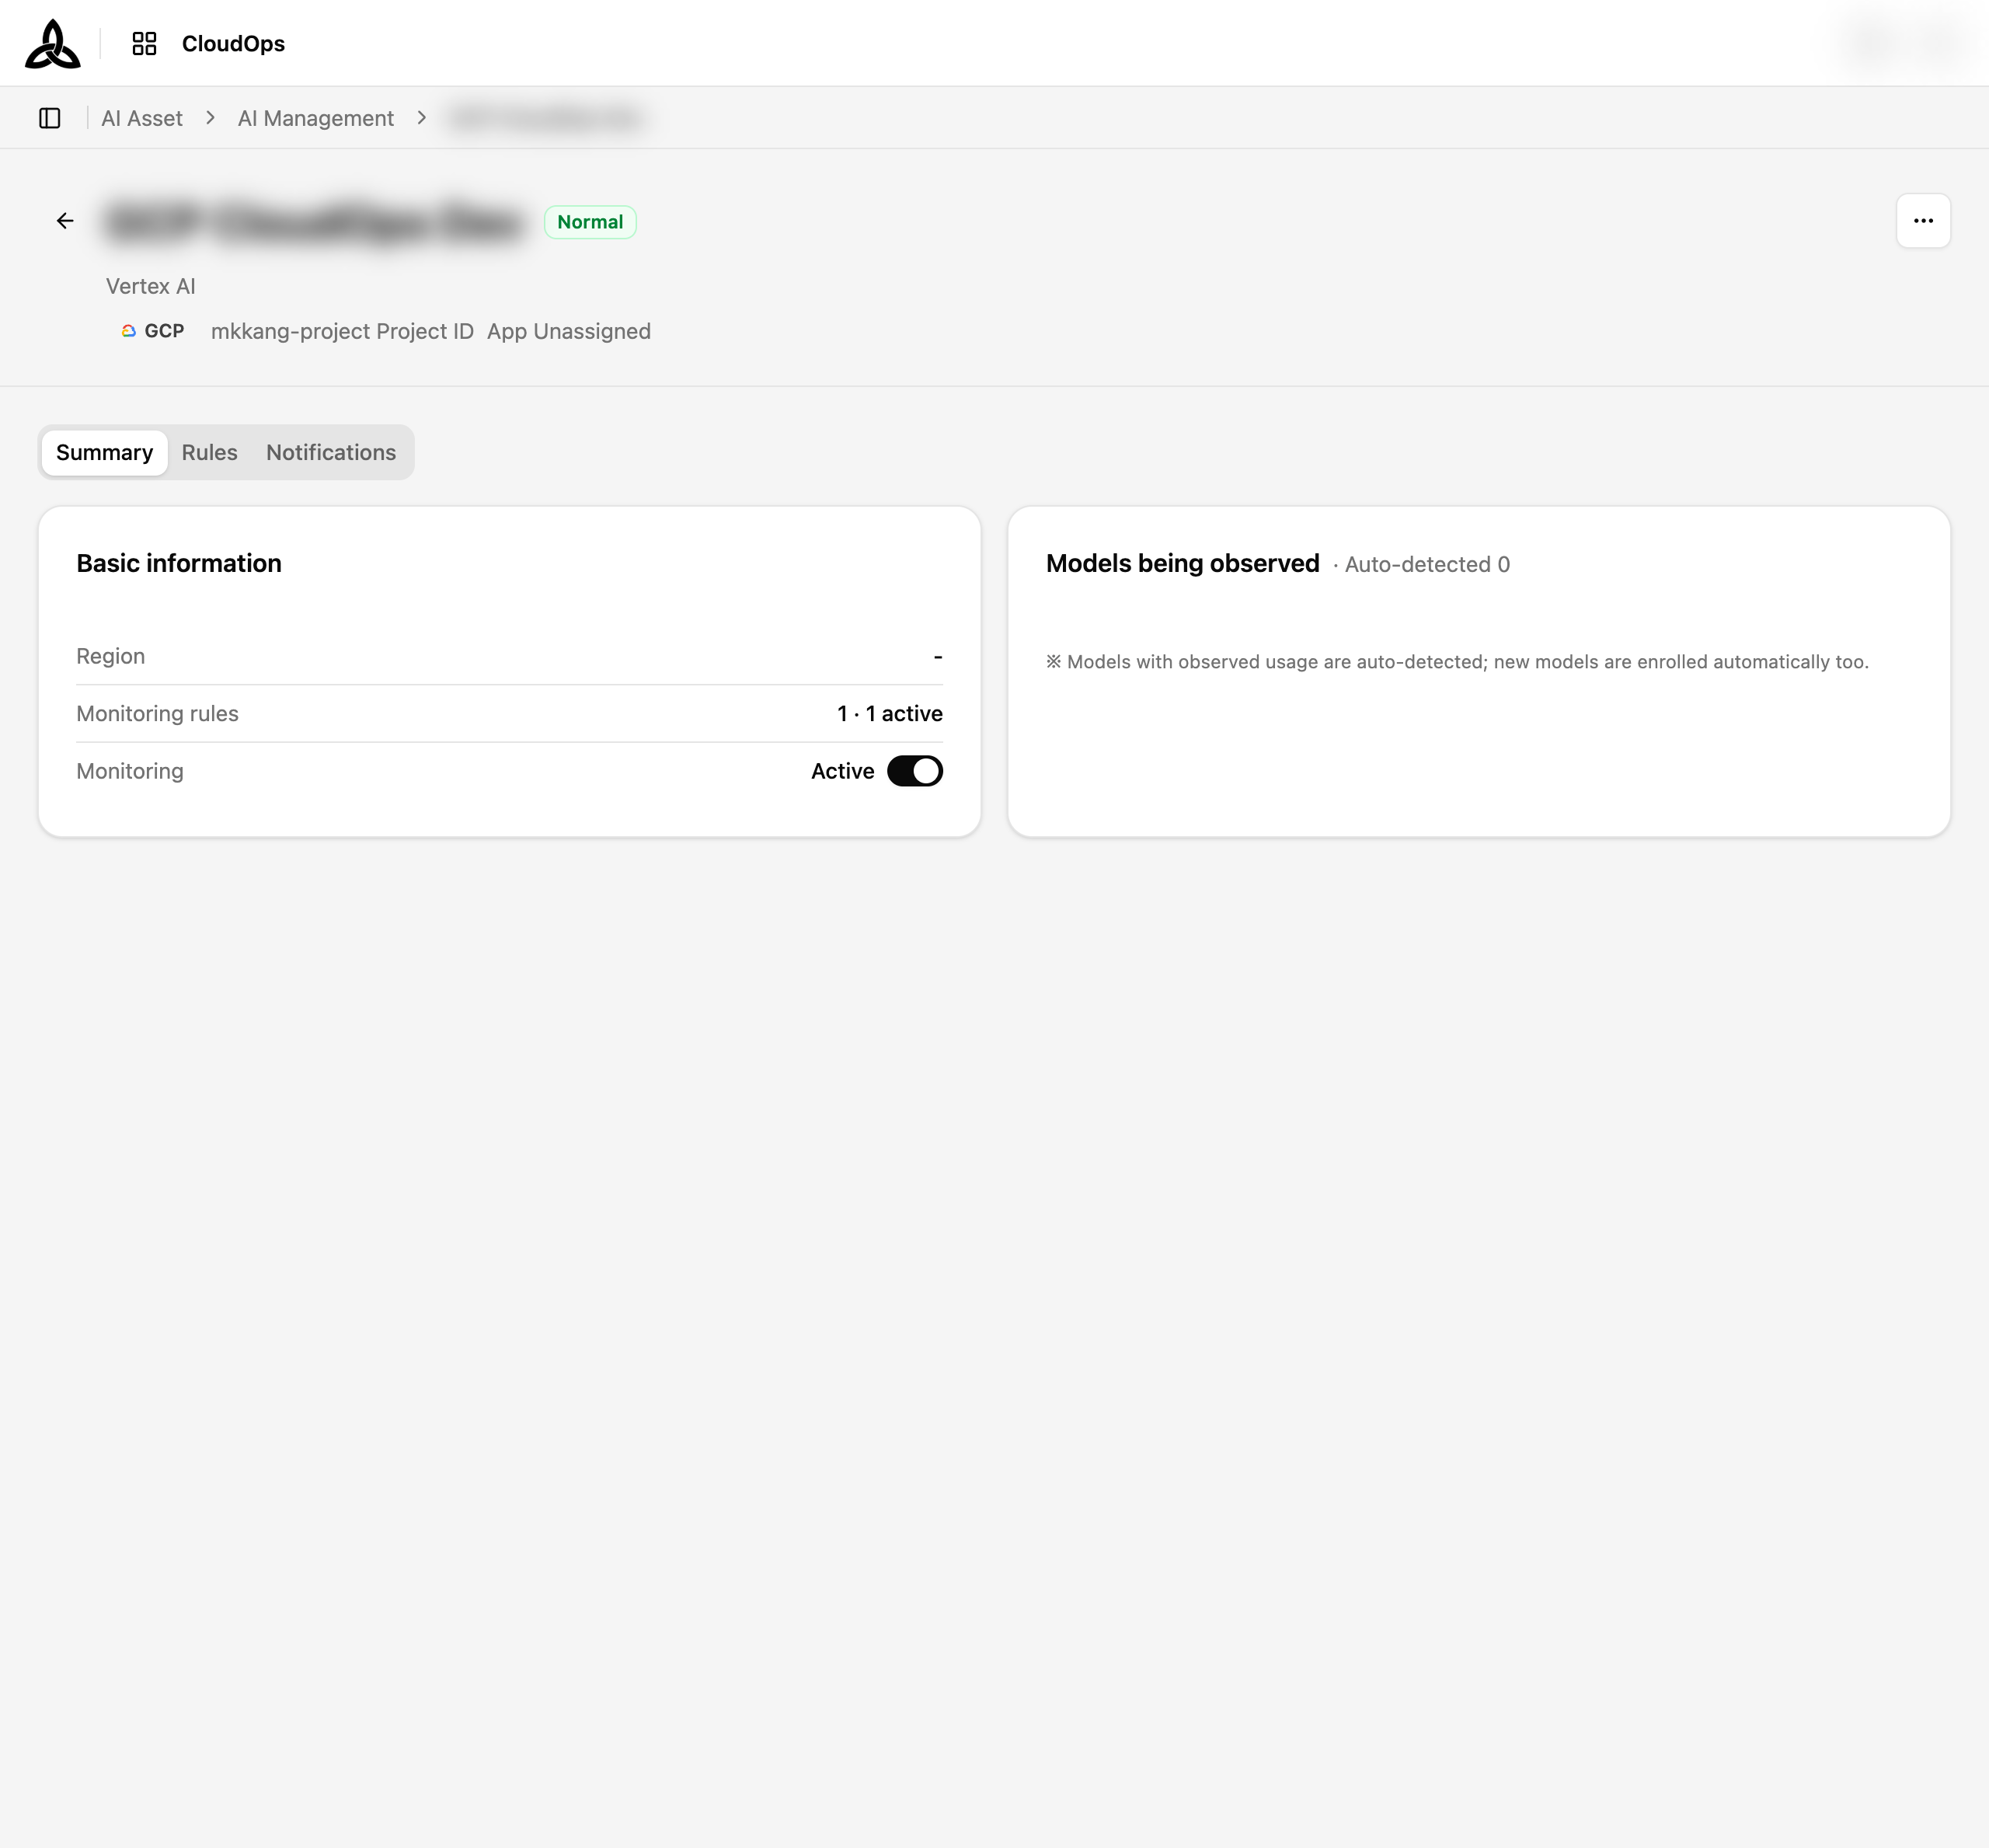
Basic information shows the region, the rule count, and the monitoring switch. Models being observed lists the models CloudOps has actually seen usage for.
Rules Tab
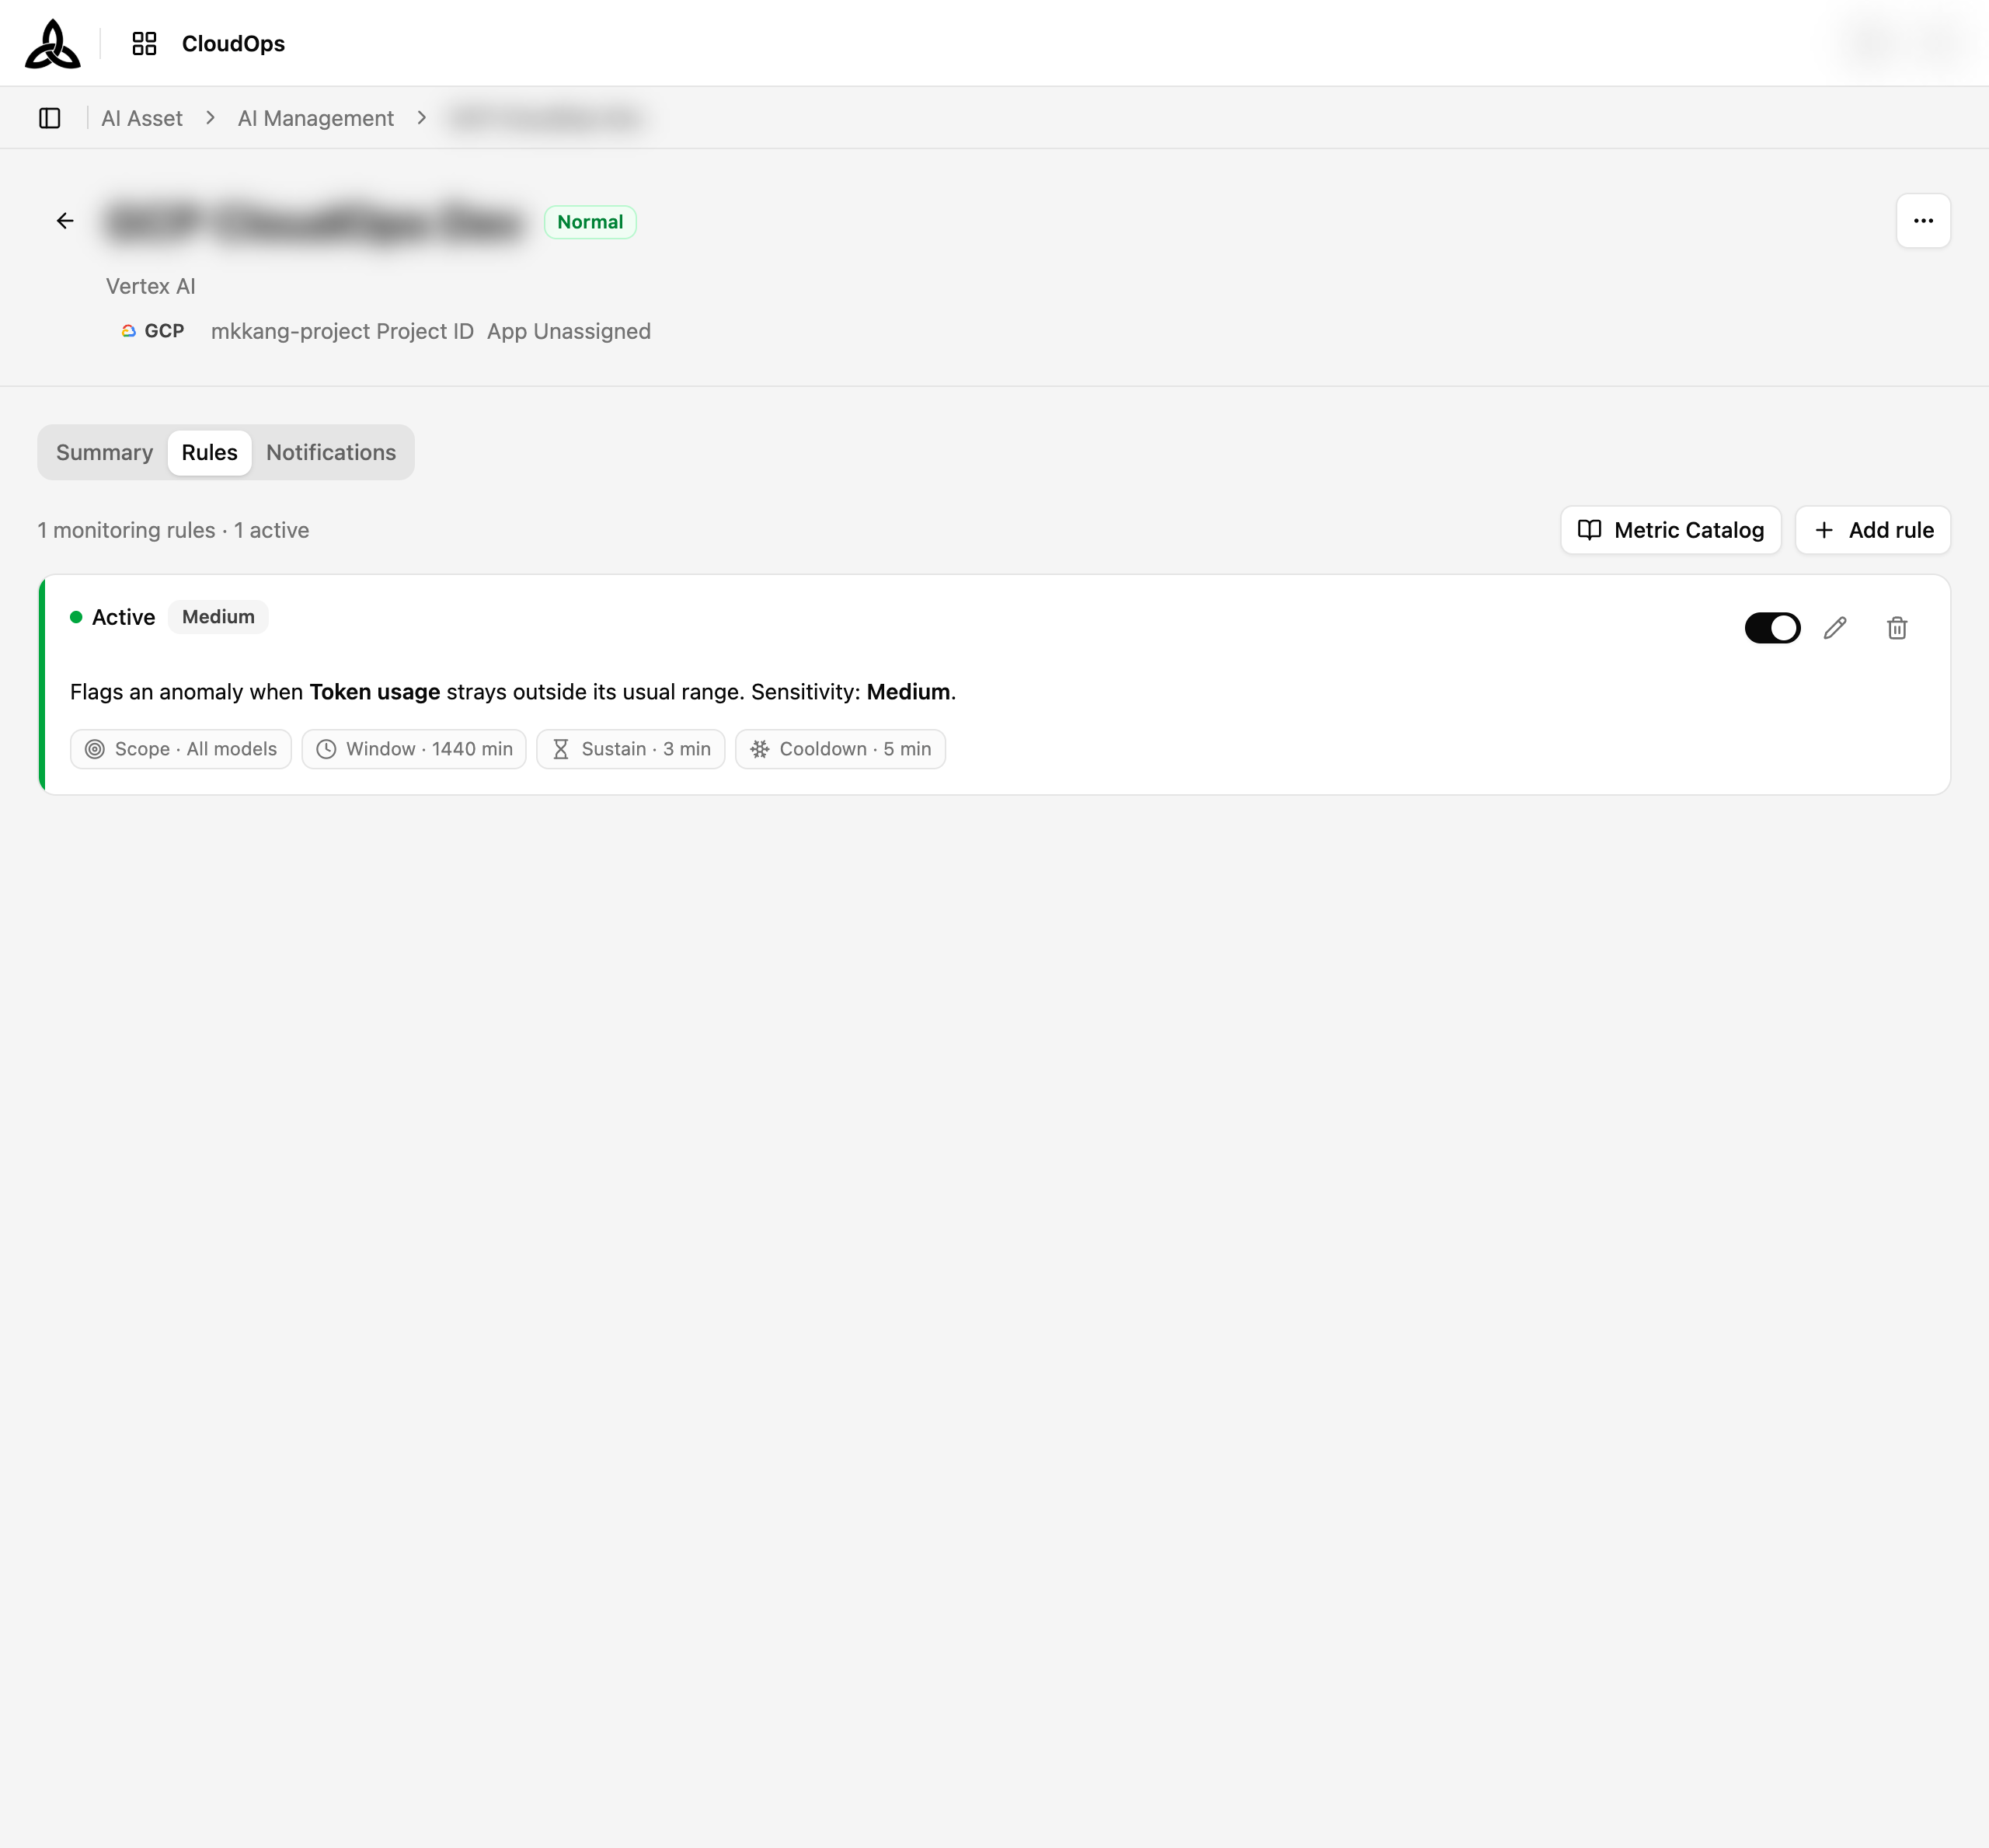
Each monitoring rule is a card that reads as a sentence — “Flags an anomaly when Token usage reaches ×1.1 of its baseline.” — followed by the four settings that shape it:
| Setting | Meaning |
|---|---|
| Scope | Which models the rule applies to |
| Window | The period of usage each evaluation looks at |
| Sustain | How long the condition must hold before an anomaly is raised |
| Cooldown | How long to wait before the same rule can fire again |
Every card has its own switch, edit, and delete controls, so one rule can be paused without touching the others. Add rule creates another, and the count above the list tracks how many are active.
Notifications Tab
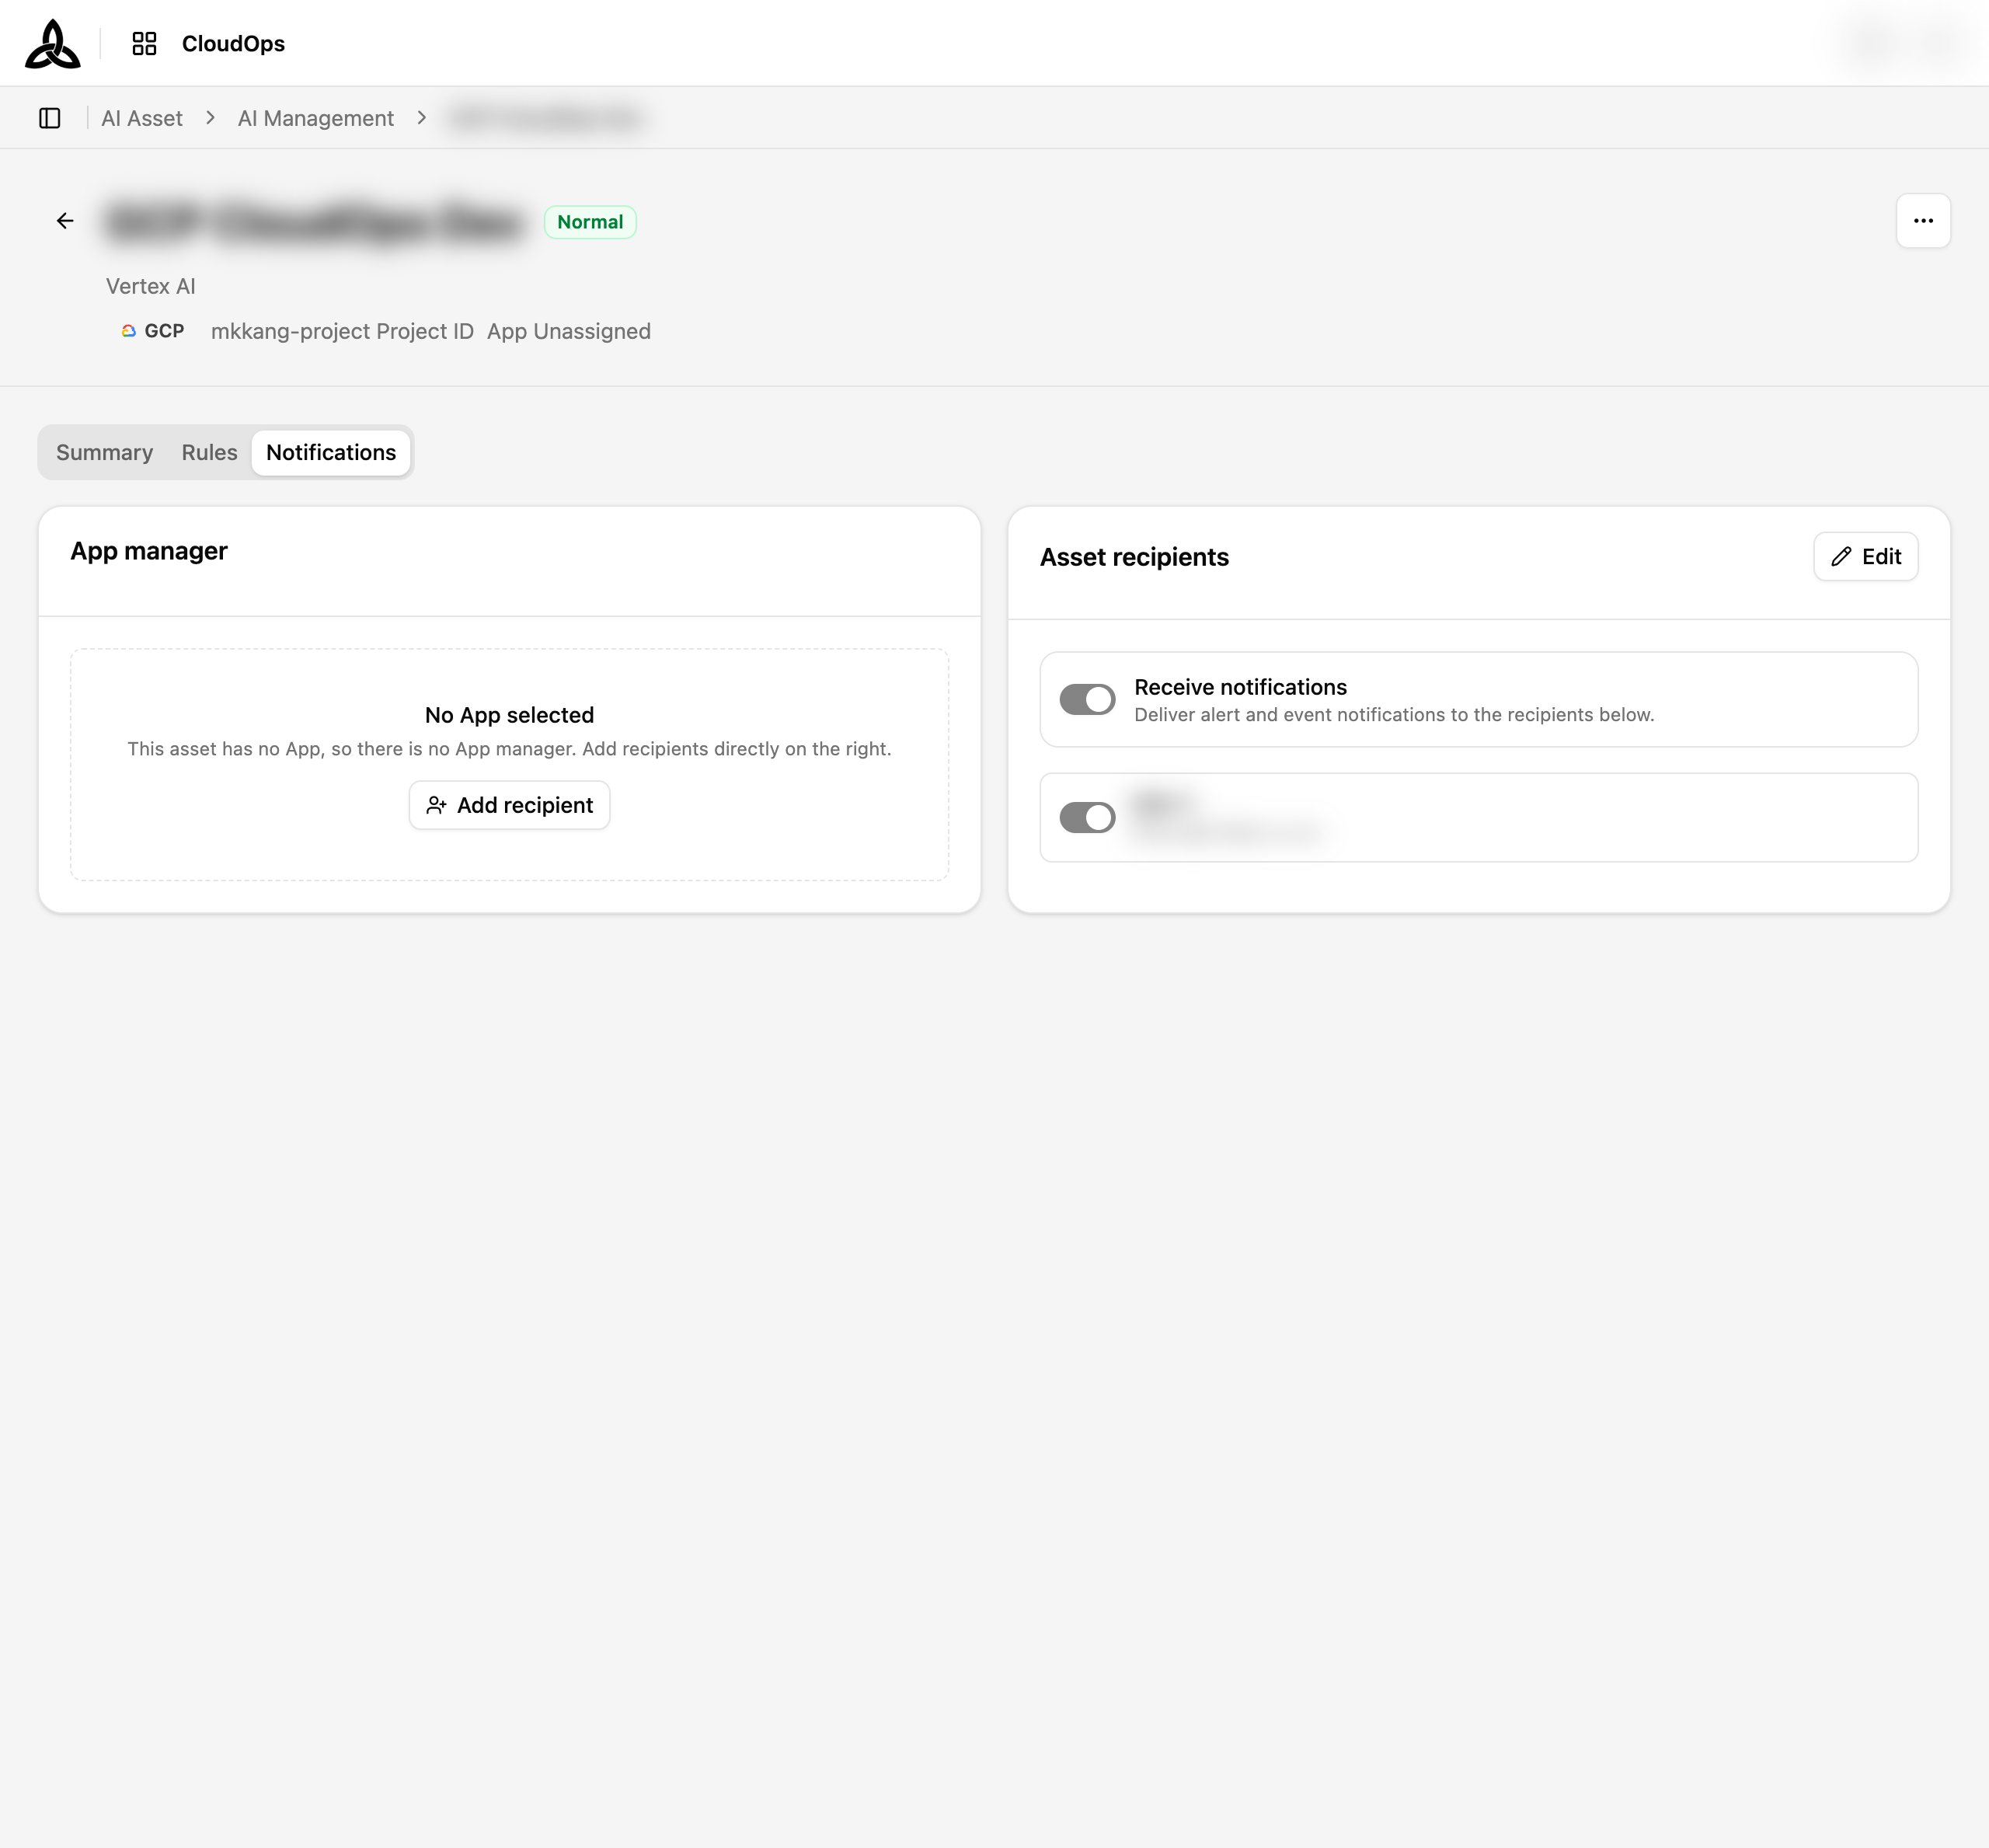
| Card | Purpose |
|---|---|
| App manager | The manager of the assigned App, added as a recipient automatically. When the asset has no App, this card explains why it is empty |
| Asset recipients | Recipients set directly on this asset. Receive notifications is the master switch; each recipient below has its own |
Turning off the master switch stops delivery without removing anyone from the list.
Registering an Asset
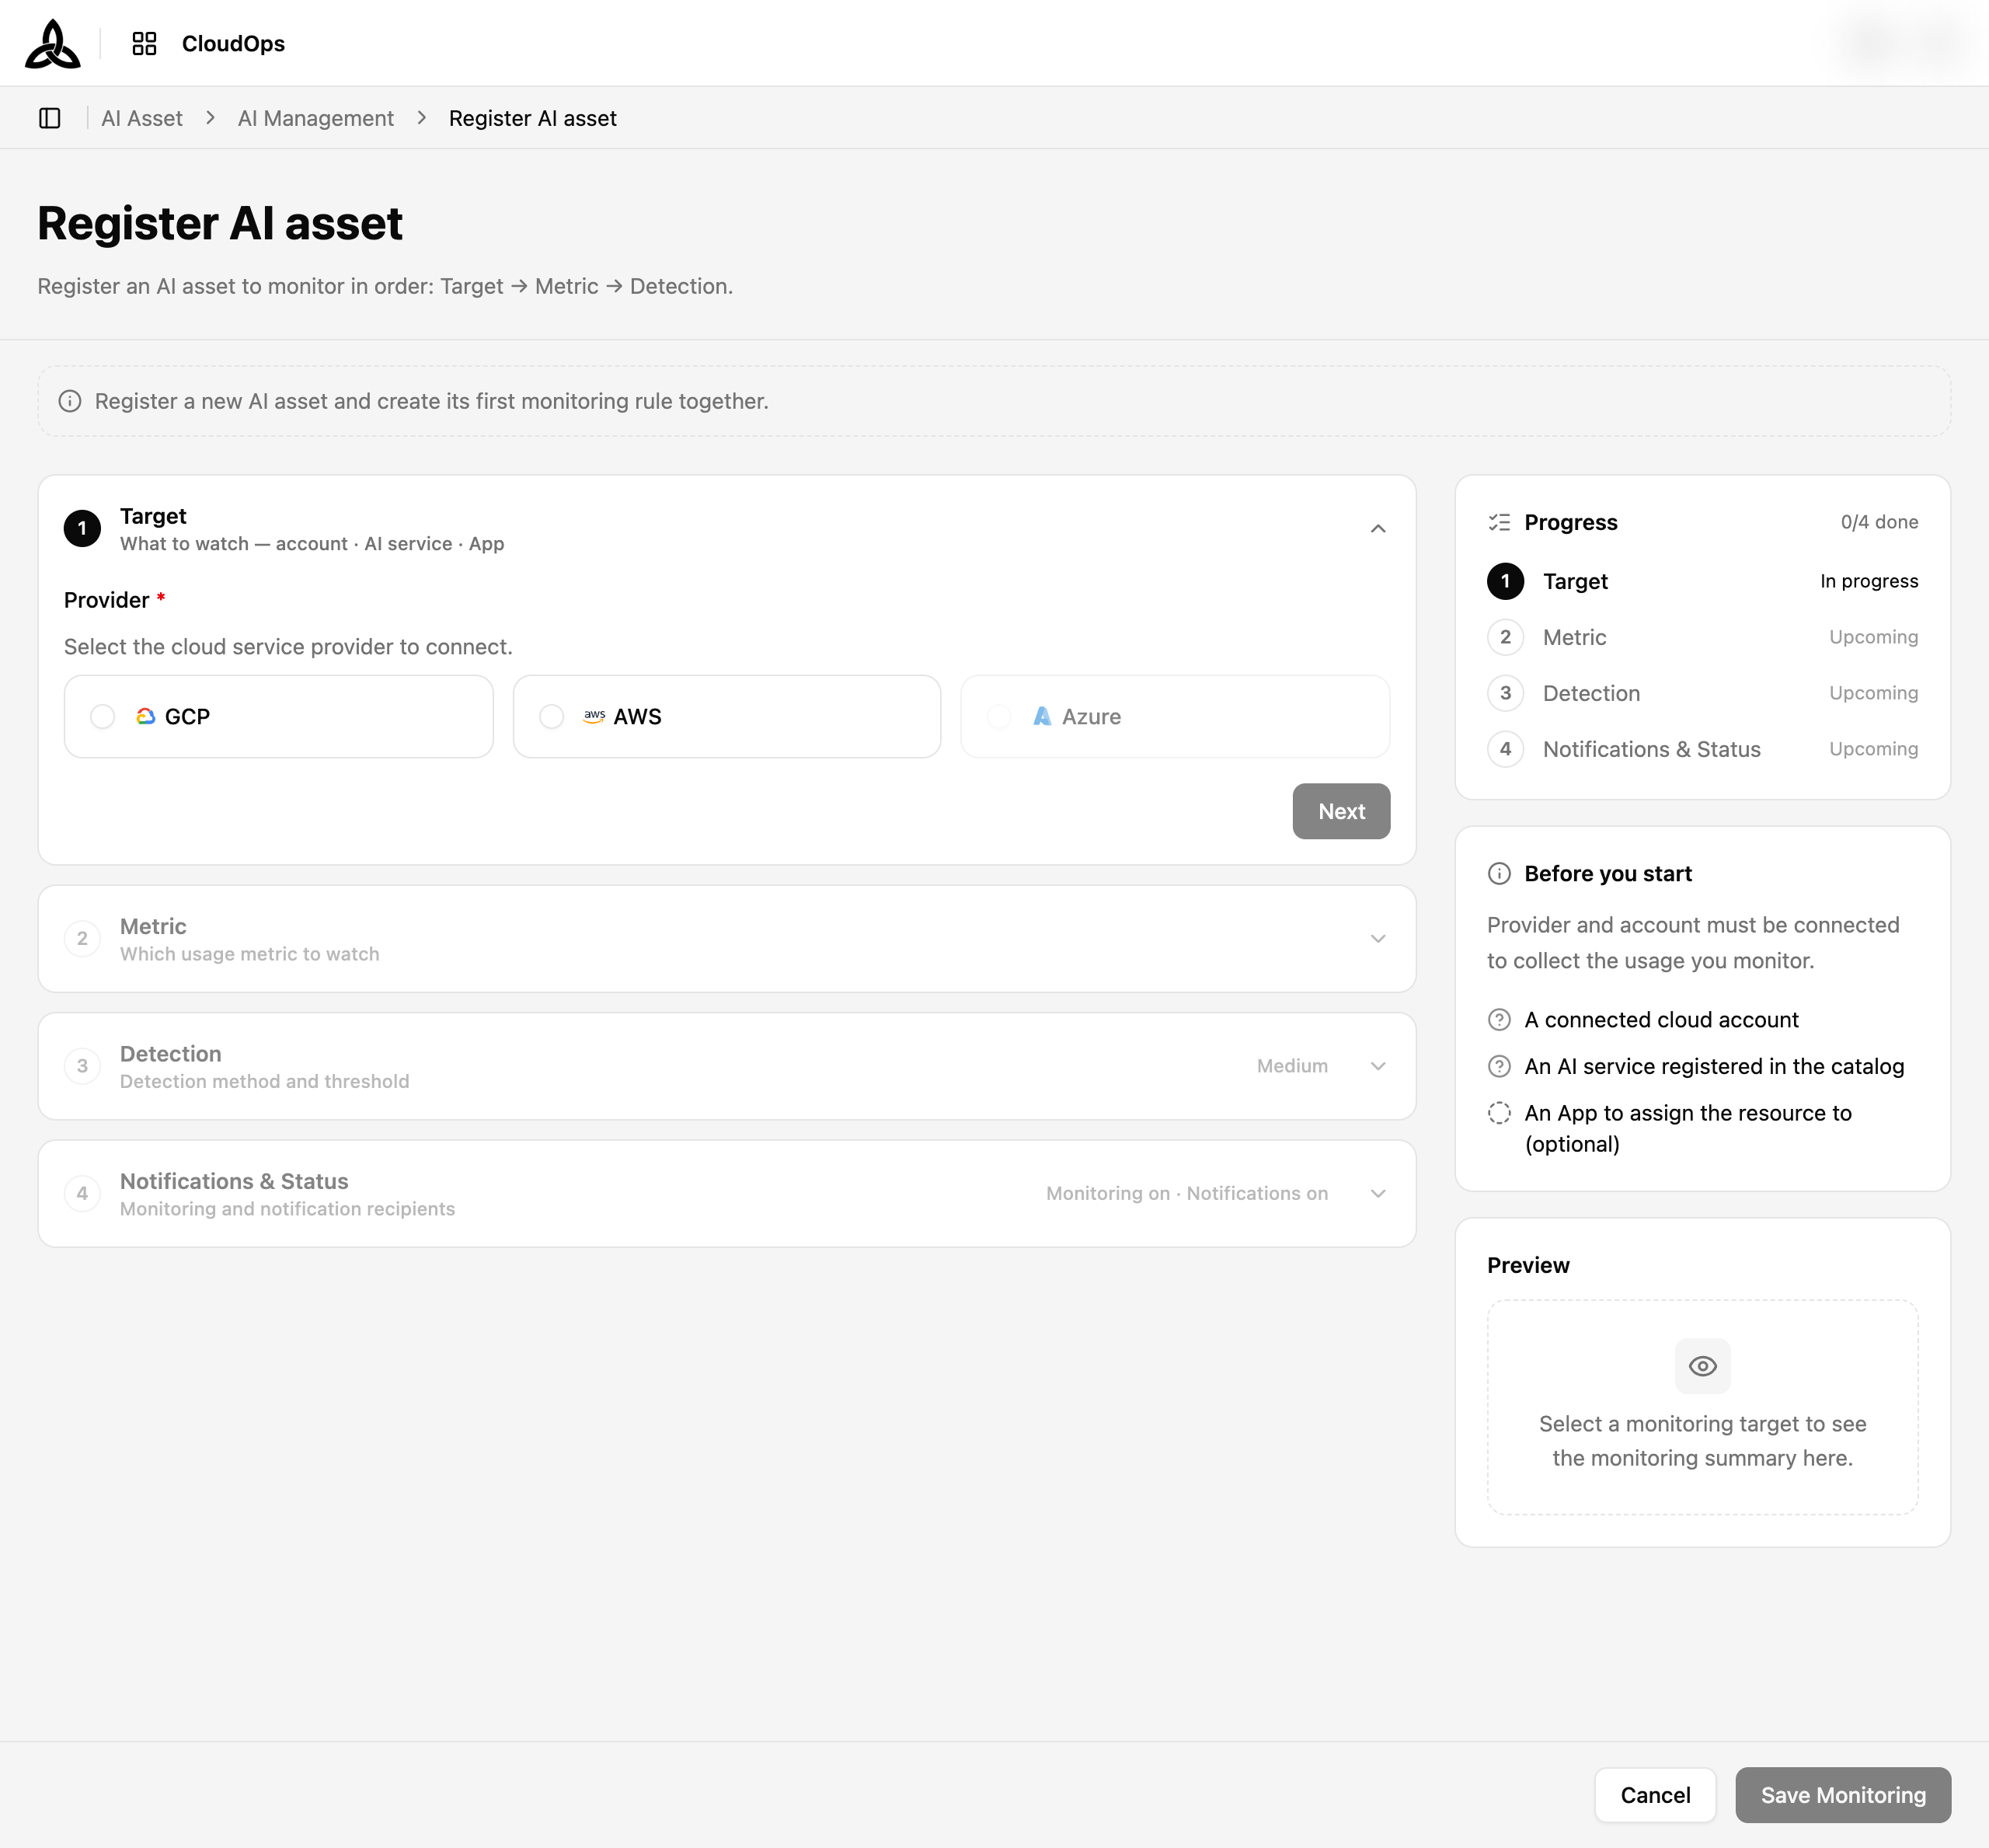
Register AI asset opens a four-step wizard — Target → Metric → Detection → Notifications & Status — with a Progress panel on the right that tracks which steps are done. The asset and its first monitoring rule are created together, so a newly registered asset is never left without a rule.
A Before you start panel lists what has to exist first:
| Prerequisite | Why |
|---|---|
| A connected cloud account | The account where the AI usage happens must already be connected |
| An AI service in the metric catalog | The service you want to watch must be registered there |
| An App to assign the resource to | Optional |
Under the panels a Preview shows the monitoring summary as you build it — until a target is chosen it just says so, which is the quickest check that the wizard has picked up what you selected.
Target
Pick the Provider, the Account, and the AI Service. Application is optional — leaving it unassigned is fine, and choosing one makes its manager a suggested notification recipient.
Metric
Choose which usage metric to watch, from the same set the Metric Catalog documents. A metric is required — the asset cannot be registered without one, which is why this is a step of its own rather than an option inside Detection.
Metrics that already have a rule on this target are marked Already added and cannot be selected. To change how an existing metric is watched, edit that rule rather than adding a second one for the same metric.
Detection
Set the Detection sensitivity — High, Medium, or Low — rather than a hand-typed threshold. Then choose the Target Scope: All models (wildcard) watches every model on the asset, including ones that appear later, while Specific models limits the rule to the models you pick.
Notifications & Status
Set the notification recipients and whether monitoring starts on or off.
Adding or editing a rule on an existing asset
The same wizard is reused to add a rule to an asset, or to edit one. In both cases a banner explains the mode and the Target step is locked — the account, AI service, and App belong to the asset and cannot be changed from here. Only the metric and the detection condition are editable.